CHAPTER 2. SOCIOECONOMIC CHARACTERISTICS
INTRODUCTION
Rising rates of obesity reflect the changes in society and behavioural patterns which have occurred over recent decades. Economic growth, modernisation, urbanisation and globalisation of food markets are some of the forces thought to underlie these increases (WHO 2003).
There are some differences between those who are overweight or obese and those who are underweight or normal weight across most socioeconomic indicators. To some extent, many of the differences are also related to the age and gender profile of different population groups.
AGE AND SEX
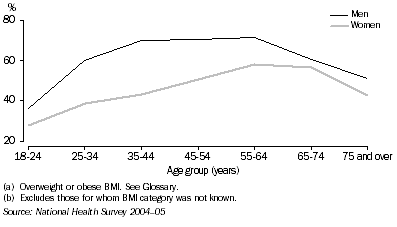
In 2004-05, a higher proportion of men than women were classified as overweight or obese across all age groups, although the difference was greatest among the age groups under 45 years. For example, among 35-44 year olds, 70% of men were categorised as overweight or obese compared with 43% of women. For both men and women the proportion classified as overweight or obese was highest in the 55-64 year age group, with persons in this age group being twice as likely to be overweight or obese (72% of men and 58% of women aged 55-64 years) than those in the 18-24 years age group (36% of men and 28% of women). Similar patterns are evident across surveys conducted since 1989-90.
2.1 OVERWEIGHT OR OBESE (a)(b)
COUNTRY OF BIRTH
Adults born in Southern and Eastern Europe and the Oceania region (excluding Australia) were the most likely to be overweight or obese (65% and 63% respectively). While those born in Australia were less likely to be overweight or obese (55%), adults born in South East Asia were least likely to be classified in this way (31%).
Adults who arrived in Australia before 1996 were more likely to be overweight or obese than those who arrived between 1996 and 2005 (54% compared to 40%). Most people born overseas are in good health on arrival due to the rigorous health checks they undergo to be eligible for migration. This 'healthy migrant effect' generally wanes as their length of time in Australia increases, and time since migration is an important factor in excess weight in migrants (AIHW 2004).
As for the total population, men born overseas were more likely to be to be classified as overweight or obese than overseas born women (58% compared to 43%). The highest proportion of overweight and obesity was recorded for men born in Southern and Eastern Europe (72%), followed by men born in the Oceania region (excluding Australia) (68%). The largest proportion of overweight and obese women were those born in the Oceania region (excluding Australia) and Southern and Eastern Europe (both with 56%).
MAIN LANGUAGE SPOKEN
Those who mainly spoke a language other than English at home were less likely than English speakers to be classified as overweight or obese (46% compared to 54%). This partly reflects the differing birthplaces and ages within this group.
HIGHEST NON-SCHOOL QUALIFICATION
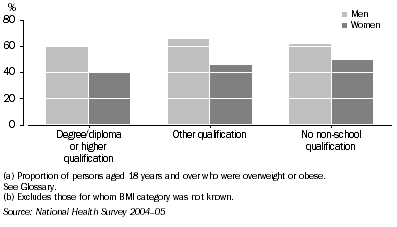
Adults with a degree, diploma or higher qualification were less likely to be overweight or obese than those with other or no non-school qualifications. Approximately half (48%) of those with a degree, diploma or higher qualification were overweight or obese, compared to 57% of those with other qualifications and 55% of those with no qualifications.
The proportion of men with a degree, diploma or higher qualification who were overweight or obese was 57%, compared to 65% of men with other qualifications and 62% of men with no non-school qualifications. The proportion of women with a degree, diploma or higher qualification who were overweight or obese was 38%, while the proportion was 45% for those with other qualifications and 49% for those with no qualifications.
2.2 Highest non-school qualification(a)(b)
LABOUR FORCE
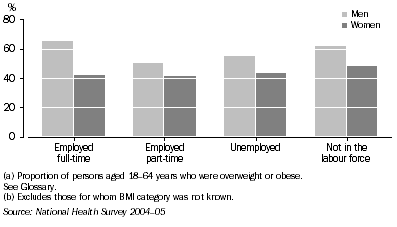
Of Australian adults in the labour force aged 18-64 years, the proportion of overweight and obesity was higher among those who were employed (54%) than those who were unemployed (50%). Over half (53%) of those who were not in the labour force in this age group were overweight or obese.
Nearly two-thirds (65%) of men who were employed full-time were overweight or obese, and this was higher than the proportions amongst those employed part-time (51%), the unemployed (55%) and those not in the labour force (62%). Among women, the proportion who were overweight or obese was similar regardless of labour force status: 42% among those working full-time; 42% among part-time workers; 43% among the unemployed; and 49% among those not in the labour force.
2.3 Labour force participation(a)(b)
INDUSTRY
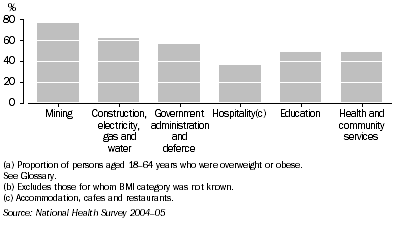
The extent to which workers aged 18-64 years were classified as overweight or obese varied across industries, with the proportion in these categories ranging from 36% in the hospitality industry to 76% in the mining industry. This partly reflects differences in the age and sex of employees across industries.
2.4 SELECTED INDUSTRIES(a)(b)
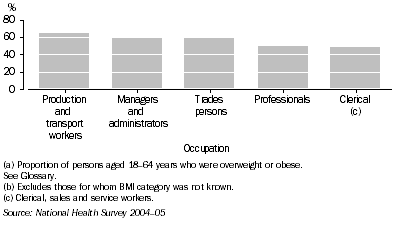
OCCUPATION
The occupation with the highest proportion of overweight or obese adults aged 18-64 years was production and transport workers (63%), while the lowest proportion was recorded among clerical, sales and services workers (46%). As with industry, this partly reflects differences in the age and sex of workers across occupations.
2.5 SELECTED OCCUPATIONS(a)(b)
HOURS WORKED
The likelihood of being overweight or obese was related to the number of hours a person usually worked each week, with the proportion of workers aged 18-64 years who were overweight or obese increasing in line with the number of hours reported. This pattern was particularly true for men. The proportion who were overweight or obese increased from 48% among men working less than 25 hours to 70% among those working 49 hours or more. To some extent, this reflects the much greater likelihood of men to work part time when they are younger.
Women are more likely than men to work part time through their working lives. Consistent with this among women the proportion who were overweight or obese was similar regardless of the hours worked. The proportions of women in each hours worked grouping who were overweight or obese ranged between 41% and 44% across the different age groups.
However, longer work hours may also be a contributor to obesity. As the hours worked increased so did the level of sedentary or low physical activity and the likelihood of consuming inadequate amounts of fruit and vegetables recorded by these people.
LIVING ARRANGEMENTS
While the proportion of adults who were overweight or obese was similar regardless of the structure of the household, the proportion was slightly higher among adults living in couple only households (56%) than among adults in households containing couples with children (54%), adults in lone person households (51%), and adults in lone parent households (47%).
INCOME
While fairly similar proportions of adults in low income and high income households were overweight or obese in 2004-05 (56% and 52% respectively), those in low income households were more likely to be obese. Around one fifth (21%) of adults in low income households were obese compared with 16% of adults in high income households.
DISADVANTAGE
A higher proportion of adults living in areas with the greatest disadvantage (those in the lowest quintile of the index of socioeconomic disadvantage) were overweight or obese (56%) compared to those living in areas with the least disadvantage (those in the highest quintile of the index of socioeconomic disadvantage)(48%). The proportion of adults living in areas with the greatest disadvantage who were obese (22%) was almost double that of obese adults living in areas with the least disadvantage (13%).
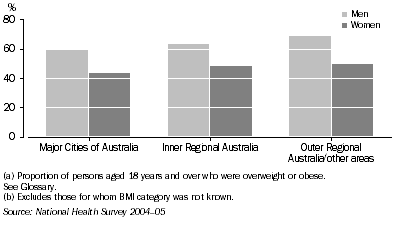
GEOGRAPHICAL AREAS
The proportion of adults who were overweight or obese was lower among people living in major cities of Australia (52%) than the proportion among those living in inner regional Australia (56%) and outer regional Australia and other areas of Australia (60%).
A high proportion of men living in outer regional Australia (69%) were overweight or obese compared to major cities of Australia (60%) and inner regional areas of Australia (64%). The same trend was present in the female population. One in two women who lived in outer regional Australia were overweight or obese (50%). The proportions for overweight or obese women living in the inner regional and major cities of Australia were 48% and 43% respectively.
2.6 Geographical areas(a)(b)
INDIGENOUS AUSTRALIANS
After adjusting for age differences between the two populations and for differences in non-response in the 2004-05 NHS and the 2004-05 National Aboriginal and Torres Strait Islander Health Survey (NATSIHS), Indigenous Australians (aged 18 years or more) were 17% more likely to be overweight or obese than non-Indigenous Australians.
Of Indigenous respondents aged 18 years or more, an estimated 60% were overweight or obese. Among men, 62% were overweight or obese. Among women, 58% were overweight or obese. Some 35% of Indigenous adults were classified as being of normal weight, and 4% were underweight.
The proportion of adults who were overweight or obese was higher among Indigenous Australians than the non-Indigenous population in all age groups. While this pattern held for women, among men the proportion who were overweight or obese was lower than the non-Indigenous population in the middle years (68% and 72% respectively in the 35-54 years age group). In each age group the disparity between Indigenous and non-Indigenous people was greater for females than for males. Further data on age and sex is available in Appendix 1.
 Quality Declaration
  Print Page
 Print All