CHAPTER 1. INTRODUCTION
INTRODUCTION
Overweight and obesity have become a world-wide concern, reaching epidemic proportions. Excess body weight contributes to medical risk for conditions such as diabetes, cardiovascular disease, osteoarthritis, some cancers, high blood pressure and high cholesterol (WHO 2003). High body mass was responsible for 7.5% of the total burden of disease and injury in Australia in 2003 (AIHW 2007). It has been estimated that overweight and obesity and their associated illnesses cost Australian society and governments a total of $21 billion in 2005 (Access Economics 2006).
A range of factors influence the body mass outcomes of given individuals and populations. Specific lifestyle behaviours such as exercise and dietary habits impact on weight. This publication presents body mass information and associated characteristics as reported by adults in the National Health Survey (NHS).
BODY MASS INDEX
Body Mass Index (BMI) is an internationally recognised measure of the amount of fat and muscle in the human body and used as an index of obesity. The BMI values in this publication are calculated from self-reported height and weight. The values are grouped into body mass categories in line with the WHO and National Health and Medical Research Council (NHMRC) guidelines, and are used to derive a measure of the proportion of overweight and obesity in the population. See BMI in the Glossary for more information.
Because height and weight measures are ‘as reported’ by respondents, they may differ from those which might be obtained for the same person by actual physical measurement. Overall, people tend to overstate their height and understate their weight (ABS 1995).
It should be noted that while BMI is a useful tool to assess and monitor changes in body mass at the population level, it has been identified as an inappropriate measure for certain populations and individuals. For example, those whose high body mass is due to muscle rather than fat.
OVERVIEW
In 2004-05, 54% of adults were classified as overweight or obese. The proportion of men in these categories was significantly higher than that for women (62% of men compared to 45% of women). This difference is most evident in the overweight category, where 43% of men were overweight compared to 28% of women. The median age of men who were overweight or obese (45 years) is lower than that of women (48 years).
In addition to the BMI score calculated from the height and weight reported by respondents in the NHS, adults were also asked for their own perception of whether they were of acceptable weight, underweight or overweight. In 2004-05, the majority of adults considered themselves to be of acceptable weight (63% of men and 59% of women), while 32% of men and 37% of women considered themselves to be overweight. However, this was significantly below the proportions classified as overweight or obese based on their body mass index (BMI), calculated from reported height and weight; 62% of men and 45% of women. Of those classified as obese, 84% perceived themselves as overweight compared to only 42% of those who were overweight.
CHANGES OVER TIME (footnote 1)
Comparing the results of the 2004-05 survey with those conducted in the preceding 15 years shows increases in the number and proportion of adults who are overweight or obese. Over the four surveys, the number of overweight or obese adults increased from 4.6 million in 1989-90 to 5.4 million in 1995, 6.6 million in 2001, and 7.4 million in 2004-05.
Even when the effect of changes in the age structure of the adult population over time is taken into account (i.e. when age standardisation is applied to the data), the proportion of overweight or obese adults increased steadily over this period - from 38% in 1989-90 to 44% in 1995, 50% in 2001 and 53% in 2004-05. The increase was most marked among obese adults, with the proportion of the adult population in this category doubling between 1989-90 and 2004-05 (from 9% to 18%). Over the same period, the proportion of overweight adults increased from 29% to 35%.
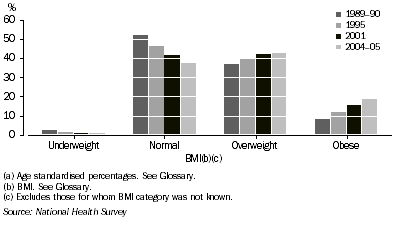
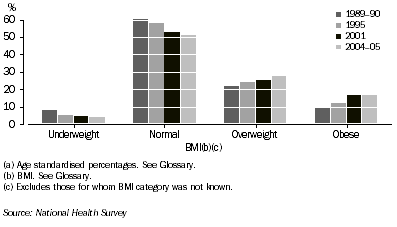
The proportion of men classified as overweight or obese increased steadily from 45% in 1989-90, to 52% in 1995, 58% in 2001, and 62% in 2004-05. The proportion of overweight or obese women also increased progressively, from 32% in 1989-90, to 37% in 1995, 42% in 2001, and 45% in 2004-05. During the period, the proportion of men who were classified as obese more than doubled (from 9% in 1989-90 to 19% in 2004-05) while the proportion of women in this category increased from 10% to 17%.
Increases in the proportion of adults who were overweight or obese occurred among all age groups. Hence the median age of overweight or obese adults remained similar over the 15 year period. In 2004-05, the median age of overweight or obese adults was 46 years.
In keeping with the increase in the proportions of the population who were overweight or obese in the 15 years to 2004-05, there were corresponding decreases in the proportions of the population who were classified as normal or underweight during this period. Between 1989-90 and 2004-05, the proportion of men who reported normal weight decreased from 52% to 37%, and the proportion of women in this category decreased from 60% to 51%. Over the same period, the proportion of men who were underweight decreased from 3% to 1%, and the proportion of women in this category decreased from 8% to 4%.
While adults with higher BMI scores are more likely to assess themselves as being overweight than those with lower scores, overweight or obese adults (both male and female) are increasingly likely to see themselves as having an acceptable weight. On an age standardised basis, the proportion who perceived themselves as having an acceptable weight increased from 37% in 1995, to 41% in 2001, and 44% in 2004-05. This change over time was most marked for those in the overweight BMI category (45% in 1995, 53% in 2001 and 57% in 2004-05) although it was also apparent among those in the obese category (13% in 1995, 17% in 2001 and 16% in 2004-05).
1.1 Body mass index(a), Men
 1.2 Body Mass index(a),
 Women

WEIGHT AND HEIGHT
As reported in How Australians Measure Up, 1995 (cat. no. 4359.0) people tend to over estimate their height and under estimate their weight. These reporting errors are relatively uniform over time and across the population suggesting the BMI measure obtained from self reported height and weight are useful when examining trends and patterns.
Over the four surveys conducted in the 15 years to 2004-05, the average self-reported weight of Australian men increased steadily from 77.4 kg in 1989-90 to 83.6 kg in 2004-05 (an overall increase of 6.2 kg). Across the age groups, the increases ranged from 3.5 kg (for 18-24 year olds) to 7.5 kg (for 35-44 year olds). The average height of men increased marginally over the same period, with the greatest increase (1.6 cm) occurring in the 25-34 years and 35-44 years age groups.
The average weight of women also increased steadily over the period, from 62.6 kg in 1989-90 to 67.7 kg in 2004-05 (a total increase of 5.1 kg). Increases in average weight for women across age groups ranged from 3.0 kg in the 75 years and over age group to 6.2 kg in the 25-34 years age group. The average height of women increased marginally over the same period, with the greatest increase (1.8 cm) occurring in the 25-34 years age group.
1 Percentages in this section are based on age standardised data. <back
 Print Page
 Print All
 Quality Declaration