Feature Article - Spotlight on occupation
This article was published in the April 2004 issue of Australian Labour Market Statistics (cat. no. 6105.0).
Introduction
This article provides a description of the way in which the ABS classifies occupations, and describes the range of occupation data currently available from the Labour Force Survey (LFS).
The remainder of this spotlight highlights some of the occupation data available from the LFS, including changes to the occupational structure of employment over the last seven years.
Classification of occupations
The ABS defines an occupation as a set of jobs with similar sets of tasks. A job is defined as a set of tasks designed to be performed by an individual employed person. ABS collections use the Australian Standard Classification of Occupations (ASCO) Second Edition to classify jobs into occupations based on skill level and skill specialisation. The structure of ASCO comprises five hierarchical levels and is described in the table below.
The skill level of an occupation is a function of the range and complexity of the set of tasks involved. The greater the range and complexity of the set of tasks, the greater the skill level of the occupation. The ASCO Second Edition measures the skill level of occupations based on the formal education and/or training and previous experience usually required for entry to the occupation.
Skill specialisation is used to group occupations according to type, rather than level of skill. The skill specialisation of an occupation is a function of the field of knowledge required, tools and equipment used, materials worked on, and goods or services provided in relation to the tasks performed.
Changes in classification
Before 1996, occupation data were classified according to the Australian Standard Classification of Occupations First Edition. The change in classification produced a break in series, with ASCO Second Edition used in the LFS from August 1996.
The first edition of the Australian and New Zealand Standard Classification of Occupations (ANZSCO) is currently in development and is planned for introduction into the LFS and the Census of Population and Housing in 2006.
Labour Force Survey
The LFS collects information on the occupations of employed persons at the ASCO Unit Group (i.e. 4-digit) level. More detailed information on the occupations of employed persons (i.e. at the Occupation, or 6-digit level) is available from the Census of Population and Housing.
Occupation data in the LFS are collected from all employed and recently unemployed persons (those who had worked for at least two weeks in the previous two years) quarterly in February, May, August and November. A comparable time series utilising the ASCO Second Edition is available from August 1996.
Tables 2.3-2.6 of this publication present data on the occupations of employed persons for February 2004. These data are also available in electronic spreadsheets and data cubes as listed in Appendix 1.
Changes in coding methods
Changes implemented in February 2000
The LFS asks employed persons to provide details of the employer or business for which they worked in their main job, and the job title and main tasks they performed in their main job. These details are used to code industry and occupation of main job.
Prior to February 2000, occupation was coded manually using an index containing descriptions of job titles and activities. In February 2000, computer-assisted coding was introduced to the LFS for occupation and industry. As a result of these changes, estimates for the February 2000 survey onwards are not strictly comparable with those for earlier periods.
The new coding method resulted in an estimated increase of 4% for employed Associate professionals, with contributions mainly from Managers and administrators, Professionals, and Intermediate clerical, sales and services workers. In contrast, Elementary clerical, sales and service workers fell by an estimated 4% under the new method, mainly changing to Intermediate clerical, sales and service workers.
The effect on estimates classified by industry was generally higher than that on estimates classified by occupation. For more details on these changes, see the article Information Paper: Forthcoming Changes: Industry, Occupation and Status in Employment Data in the May 2000 issue of Labour Force, Australia (cat. no. 6203.0), available free on the ABS web site.
Changes implemented in February 2004
In a small number of cases, responses to the occupation and industry questions are not sufficiently detailed to allow the ABS to code people to the lowest level of these classifications. Since the introduction of computer-assisted coding in 2000, these inadequate responses had been proportionally distributed to the most detailed level of the classifications.
From February 2004, inadequate responses have been coded to 'not further defined' categories at an appropriate level in both the industry and occupation classifications. This change has not affected estimates at the 1-digit level. Estimates were recoded back to August 2000. For more details of this change see Technical Report: Improvements to labour force estimates in this issue.
Males and females
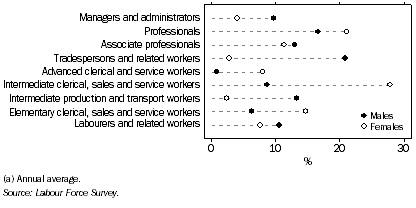
In 2003, an estimated 28% of employed females worked in Intermediate clerical, sales and service workers occupations, compared with 9% of employed males. Tradespersons and related workers comprised 21% of employed males on average, compared with 3% of employed females.
Employed persons, Occupation major groups—2003(a)

Changes in occupations over time
The changes in the distribution of occupations at the major group level over the last seven years have been relatively slight, but show some consistent trends even after accounting for the February 2000 coding changes.
Males
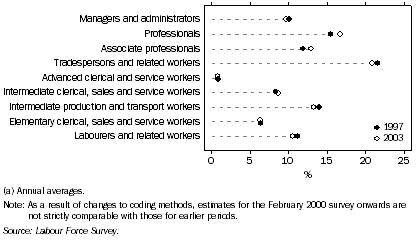
Between 1997 and 2003 the proportion of males working as Professionals increased from 15% to 17%, while the proportion working as Associate professionals increased from 12% to 13%. This was offset by a reduction in the proportion of males working as Tradespersons and related workers (from 22% to 21%) and Intermediate production and transport workers (from 14% to 13%).
Employed males, Occupation major groups—1997 and 2003(a)

Females
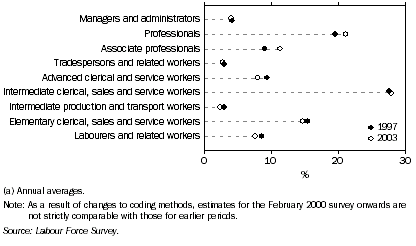
As for men, between 1997 and 2003 the proportion of females working as Professionals increased (from 20% to 21%), while the proportion working as Associate professionals increased (from 9% to 11%). However, the occupations that reduced were different, reflecting the different occupational distribution between males and females. There was a reduction in the proportion of females working as Advanced clerical and service workers (from 9% to 8%), and Labourers and related workers (from 9% to 8%).
Employed females, Occupation major groups—1997 and 2003(a)

Further information
For further information on ASCO Second Edition, refer to ASCO: Australian Standard Classification of Occupations, Second Edition (cat. no. 1220.0). For further information on occupation data available from the Labour Force Survey, please contact Peter Bradbury on Canberra 02 6252 6565 or email peter.bradbury@abs.gov.au.
 Print Page
 Print All