DEATHS
In 2007, there were 137,900 deaths (70,600 males and 67,300 females) registered in Australia, an increase of approximately 4,100 deaths (or 3.1%) compared with the number of deaths registered in 2006 (133,700). Since 1987. the number of deaths registered has increased by around 0.5% per year on average for males and 1.1% per year for females, with year to year fluctuations. The steady increase in the number of deaths over time reflects the increasing size of the population and, in particular, the increasing number of older people. With the continued ageing of the population, the number of deaths is projected to continue to increase throughout the remainder of the century (Series B, Population Projections, Australia, 2006 to 2101(3222.0)).
Despite the ageing of the population over the last 20 years, death rates have continued to decline over the long-term. The crude death rate declined from 7.2 deaths per 1,000 population in 1987 to 6.4 deaths per 1,000 population in 2005, and has risen slightly since then, to 6.5 deaths per 1,000 population in 2007. Given the ageing of Australia's population, the overall decline in the crude death rate indicates a considerable decline in age-specific death rates over the period.
The standardised death rate (SDR), which eliminates the effect of changes in the age structure of a population over time, was 6.0 deaths per 1,000 standard population in 2007, the same as the previous two years and down by 34% from 1987 (9.1). The rates for 2005, 2006 and 2007 are the lowest on record.
Life expectancy
Life expectancy is the average number of additional years a person of a given age and sex might expect to live if the age-specific death rates of the given period were to continue throughout his or her remaining lifetime.
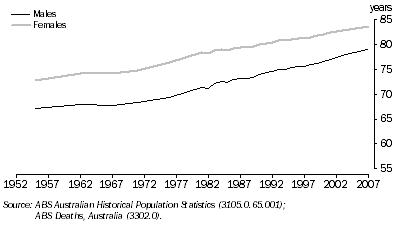
Over the past century, male life expectancy at birth has increased by 24 years, from 55.2 years in 1901-1910 to 79.0 years in 2005-2007 (graph 7.24). Similarly, female life expectancy at birth has increased by 25 years, from 58.8 years to 83.7 years. The increase in life expectancy at birth reflects declining death rates at all ages.
7.24 Life expectancy at birth
Improvements in living conditions in the early-20th century, such as better water supplies, sewerage systems, food quality and health education resulted in an overall decline in mortality. The continuing reduction in mortality in the latter half of last century is attributed to improving social conditions and advances in medical technology such as mass immunisation and antibiotics. The past two decades in particular have seen further increases in life expectancy. These increases are due in part to lower infant mortality, fewer deaths among young adults from motor vehicle accidents and fewer deaths among older men from heart disease. The reduction in the number of deaths from heart disease has been related to medical advances and behavioural changes such as improvements in diet and a reduction in smoking.
During the 20th century, life expectancy of new-born girls was consistently higher than that of new-born boys, with the difference peaking at about seven years in the 1970s and early-1980s. The difference was largely due to the significant decline in heart disease, stroke and respiratory disease mortality among women. In recent years, the gap in life expectancy between new-born males and females narrowed to around five years. This can be attributed to the large reductions in death rates of males aged 45 years and over, and particularly to the reduction in heart disease deaths among males.
The increase in life expectancy for older persons has implications for retirement planning and income policies. Life expectancy of 65 year old males increased from 15 years in 1985-1987 to 19 years in 2005-2007, while life expectancy of 65 year old females increased from 19 years to 22 years during the same period.
Australians have a life expectancy at birth which compares well with that experienced in other developed nations. Life expectancy at birth of Australian males (79.0 years) is exceeded only by Iceland, Hong Kong (SAR of China) and Switzerland. Life expectancy at birth of Australian females (83.7 years) is exceeded by Japan, Hong Kong (SAR of China), France, Switzerland, Italy and Spain. Combined Australian male and female life expectancy of new-born babies for 2005-2010 was 81.5 years. This was higher than the level for Canada (80.7 years), New Zealand (80.2 years), the United Kingdom (79.4 years) and the United States of America (79.2 years).
A life table is a statistical model that is constructed from the death rates of a population at different ages. It is frequently used to express death in terms of the probability of dying. In its simplest form, a life table is generated from age-specific death rates and the resulting values are used to measure mortality, survivorship and life expectancy. Table 7.25 shows the expectations of additional years of life at specific ages for Australian males and females using deaths for the period 2005-2007.
7.25 Expectancy of life at specific ages(a) |
|
 | Males | Females |
|
| At exact age (years) | years | years |
| 0 | 79.0 | 83.7 |
| 10 | 69.6 | 74.2 |
| 20 | 59.7 | 64.3 |
| 30 | 50.2 | 54.5 |
| 40 | 40.7 | 44.7 |
| 50 | 31.4 | 35.2 |
| 60 | 22.6 | 26.0 |
| 70 | 14.7 | 17.4 |
| 80 | 8.3 | 10.0 |
| 90 | 4.2 | 4.8 |
| 100 | 2.4 | 2.6 |
|
| (a) Calculated using data for the three years 2005-07. |
| Source: ABS Deaths, Australia (3302.0). |
Table 7.26 provides selected summary measures of mortality for the period 1997 to 2007.
7.26 Selected summary measures of mortality |
|
| | | | Life expectancy at birth(a) |
| | | |
|
| Registered deaths | Crude death rate(b) | Infant mortality rate(c) | Males | Females |
| '000 | no. | no. | years | years |
|
| 1997 | 129.4 | 7.0 | 5.3 | 75.6 | 81.3 |
| 1998 | 127.2 | 6.8 | 5.0 | 75.9 | 81.5 |
| 1999 | 128.1 | 6.8 | 5.7 | 76.2 | 81.8 |
| 2000 | 128.3 | 6.7 | 5.2 | 76.6 | 82.0 |
| 2001 | 128.5 | 6.6 | 5.3 | 77.0 | 82.4 |
| 2002 | 133.7 | 6.8 | 5.0 | 77.4 | 82.6 |
| 2003 | 132.3 | 6.6 | 4.8 | 77.8 | 82.8 |
| 2004 | 132.5 | 6.6 | 4.7 | 78.1 | 83.0 |
| 2005 | 130.7 | 6.4 | 5.0 | 78.5 | 83.3 |
| 2006 | 133.7 | 6.5 | 4.7 | 78.7 | 83.5 |
| 2007 | 137.9 | 6.5 | 4.2 | 79.0 | 83.7 |
|
| (a) Data are based on 3-year averages, with the year shown being the last year of the 3-year period. |
| (b) Deaths per 1,000 population. |
| (c) Infant deaths per 1,000 live births. |
| Source: ABS Australian Historical Population Statistics (3105.0.65.001); ABS Deaths, Australia (3302.0). |
 Print Page