GEOGRAPHIC DISTRIBUTION OF THE POPULATION
Most of Australia’s population is concentrated in two widely separated coastal regions - the south-east and east, and the south-west. Of the two regions, the south-east and east is by far the largest in area and population. The population within these regions is concentrated in urban centres, particularly the state and territory capital cities.
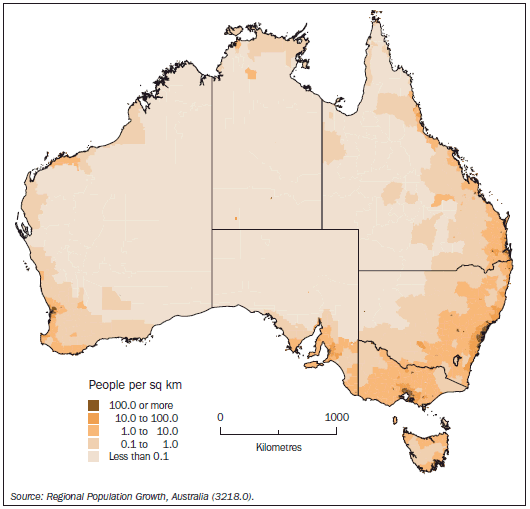
Australia's population density at June 2008 was 2.8 people per square kilometre (sq km), compared with 2.6 people per sq km in 2003. Of the states and territories, the Australian Capital Territory had the highest population density at June 2008 with 147 people per sq km (reflecting the fact that the city of Canberra constitutes a large proportion of the Australian Capital Territory's area when compared to other capital cities), followed by Victoria with 23 people per sq km. The Northern Territory had a population density of 0.2 people per sq km, the lowest of all the states and territories (reflecting more recent settlement, distance from areas settled earlier, large arid areas and, perhaps, climate).
Population density at June 2008 was highest in the city centres, particularly in the Sydney Statistical Division where the two most densely populated Statistical Local Areas (SLAs) in Australia were located. These were Sydney (C) - East (with 8,400 people per square kilometre) and the neighbouring Sydney (C) - West (7,500). Waverley (A), which is located just east of the Sydney (C) LGA and contains the beach-side suburbs of Coogee, Bronte and Bondi, also had one of the highest population densities in Australia at 7,200 people per square kilometre. The most densely populated SLA in Victoria was Melbourne (C) - Inner with 7,300 people per square kilometre, making it the third most densely populated SLA in the country. Port Phillip (C) - St Kilda, which is on the shores of the bay just south of the city centre, with 6,200 people per square kilometre, completes the list of Australian SLAs that had more than 6,000 people per square kilometre at June 2008. At the other extreme, there were over 250 SLAs in Australia with less than 1 person per square kilometre, close to one-third of which were located in Western Australia. The density of Australia's population at June 2008 is shown in map 7.14.
7.14 Population Density-June 2008
Regional population change
At June 2008, capital city Statistical Divisions (SDs) were home to 13.7 million people, or around two-thirds (63.9%) of Australia's population. The capital city SD of Melbourne experienced the largest increase in population of capital cities between 2003 and 2008, followed by Sydney and Brisbane. In terms of percentage growth, however, Darwin was the fastest growing capital city between 2003 and 2008, with an average annual growth rate of 2.3% per year. Perth and Brisbane experienced the next highest average annual growth rates over this period (both at 2.2%). Table 7.15 illustrates the changes in population of Australia's major regions over the five-year period 2003-08.
Generally, the largest growth outside capital city SDs occurred in Australia's coastal regions. Of these regions, the largest increase in population between 2003 and 2008 occurred in Gold Coast-Tweed, up by an average 16,700 people per year (or 3.3% per year). Hervey Bay recorded the fastest growth over the same period with an average growth rate of 5.4% per year. This growth was also faster than any capital city. Mandurah and Bunbury, south of Perth, also had average annual growth rates above 4.0% during the same period.
7.15 ESTIMATED RESIDENT POPULATION, By major regions(a) |
|
 | June 2003 | June 2008 | Change 2003-08 |
| '000 | '000 | no. á | %(b) |
Capital city statistical division |
|
| Sydney | 4 190 874 | 4 399 722 | 208 848 | 1.0 |
| Melbourne | 3 577 411 | 3 892 419 | 315 008 | 1.7 |
| Brisbane | 1 744 111 | 1 945 639 | 201 528 | 2.2 |
| Adelaide | 1 121 742 | 1 172 105 | 50 363 | 0.9 |
| Perth | 1 435 907 | 1 602 559 | 166 652 | 2.2 |
| Greater Hobart | 199 853 | 209 287 | 9 434 | 0.9 |
| Darwin | 107 440 | 120 652 | 13 212 | 2.3 |
| Canberra | 325 340 | 345 257 | 19 917 | 1.2 |
Statistical district |
|
| Newcastle (NSW) | 503 160 | 531 191 | 28 031 | 1.1 |
| Wollongong (NSW) | 273 788 | 284 169 | 10 381 | 0.7 |
| Nowra-Bomaderry (NSW) | 31 007 | 33 212 | 2 205 | 1.4 |
| Lismore (NSW) | 30 664 | 31 926 | 1 262 | 0.8 |
| Coffs Harbour (NSW) | 47 803 | 51 538 | 3 735 | 1.5 |
| Port Macquarie (NSW) | 39 881 | 42 900 | 3 019 | 1.5 |
| Tamworth (NSW) | 43 119 | 45 615 | 2 496 | 1.1 |
| Dubbo (NSW) | 35 325 | 36 653 | 1 328 | 0.7 |
| Wagga Wagga (NSW) | 52 916 | 56 911 | 3 995 | 1.5 |
| Bathurst (NSW) | 31 137 | 32 942 | 1 805 | 1.1 |
| Orange (NSW) | 37 126 | 37 991 | 865 | 0.5 |
| Albury-Wodonga (NSW/VIC) | 97 528 | 102 894 | 5 366 | 1.1 |
| Geelong (VIC) | 162 543 | 172 300 | 9 757 | 1.2 |
| Warrnambool (VIC) | 30 317 | 32 712 | 2 395 | 1.5 |
| Ballarat (VIC) | 85 074 | 91 787 | 6 713 | 1.5 |
| Bendigo (VIC) | 81 434 | 88 031 | 6 597 | 1.6 |
| Shepparton (VIC) | 45 564 | 47 710 | 2 146 | 0.9 |
| La Trobe Valley (VIC) | 74 743 | 78 531 | 3 788 | 1.0 |
| Mildura (VIC) | 45 912 | 49 280 | 3 368 | 1.4 |
| Sunshine Coast (QLD) | 202 780 | 237 562 | 34 782 | 3.2 |
| Bundaberg (QLD) | 58 833 | 66 176 | 7 343 | 2.4 |
| Hervey Bay (QLD) | 43 123 | 56 165 | 13 042 | 5.4 |
| Rockhampton (QLD) | 69 040 | 75 497 | 6 457 | 1.8 |
| Gladstone (QLD) | 41 549 | 48 796 | 7 247 | 3.3 |
| Mackay (QLD) | 68 532 | 81 148 | 12 616 | 3.4 |
| Townsville (QLD) | 140 362 | 162 730 | 22 368 | 3.0 |
| Cairns (QLD) | 118 503 | 142 001 | 23 498 | 3.7 |
| Toowoomba (QLD) | 113 714 | 125 339 | 11 625 | 2.0 |
| Gold Coast-Tweed (QLD/NSW) | 475 472 | 558 888 | 83 416 | 3.3 |
| Mandurah (WA) | 63 562 | 78 612 | 15 050 | 4.3 |
| Bunbury (WA) | 51 366 | 63 202 | 11 836 | 4.2 |
| Kalgoorlie/Boulder (WA) | 29 890 | 31 509 | 1 619 | 1.1 |
| Geraldton (WA) | 31 861 | 35 361 | 3 500 | 2.1 |
| Launceston (TAS) | 100 515 | 104 649 | 4 134 | 0.8 |
| Burnie-Devonport (TAS) | 78 198 | 81 144 | 2 946 | 0.7 |
| Canberra-Queanbeyan (ACT/NSW) | 369 769 | 395 126 | 25 357 | 1.3 |
|
| (a) Based on 2008 Australian Standard Geographical Classification boundaries. |
| (b) Average annual growth rate. |
| Source: ABS Regional Population Growth, Australia (3218.0). |
Interstate migration
A key contributor changing the distribution of Australia's population is internal migration. During 2007-08, 360,800 people moved from one state or territory to another. This is an increase of 2,100 people compared with the previous year.
In 2007-08, Queensland, Western Australia, Tasmania and the Northern Territory all experienced net interstate migration gains, while New South Wales, Victoria, South Australia and the Australian Capital Territory experienced net interstate migration losses. Queensland has experienced positive net interstate migration for more than 30 years; in contrast, New South Wales has experienced net losses every year since 1978-79. As table 7.16 illustrates, however, any losses due to interstate migration in 2007-08 were offset by growth due to natural increase and/or net overseas migration.
Queensland was the most popular destination for Australians moving interstate, receiving the largest number of arrivals during 2007-08 (100,600 persons). New South Wales and Victoria followed with 85,200 and 65,500 arrivals respectively.
The most common moves were between the three most populous states: New South Wales, Queensland and Victoria. The largest interstate flow was from New South Wales to Queensland (50,400 persons), while the counter flow from Queensland to New South Wales was the second largest (35,500 persons), followed by the flow from New South Wales to Victoria (23,500 persons).
There were also significant movements between bordering states and territories. This is especially apparent between the Australian Capital Territory and surrounding New South Wales, with 10,900 arrivals to the Australian Capital Territory from New South Wales and 10,400 departing from the Australian Capital Territory to New South Wales in 2007-08.
The largest net flow in 2007-08 was between New South Wales and Queensland with Queensland gaining a net 14,900 from New South Wales, and the second largest net movement was between Victoria and Queensland, with Queensland gaining a net 4,400 people from Victoria.
7.16 Components of population Growth rate-2007-2008 |
|
| NSW | Vic. | Qld | SA | WA | Tas. | NT | ACT |
| % | % | % | % | % | % | % | % |
|
| Natural Increase | 0.58 | 0.71 | 0.80 | 0.49 | 0.89 | 0.50 | 1.33 | 0.91 |
| Net overseas migration | 0.89 | 1.11 | 0.98 | 0.90 | 1.64 | 0.31 | 0.45 | 0.49 |
| Net interstate migration | -0.32 | -0.05 | 0.55 | -0.28 | 0.23 | 0.07 | 0.56 | -0.08 |
| Total population growth | 1.15 | 1.77 | 2.33 | 1.11 | 2.76 | 0.88 | 2.33 | 1.32 |
|
| Source: ABS Migration, Australia (3412.0). |
 Print Page