PRODUCTION
In 2007-08 Australia's total primary energy production was estimated at 17,452 PJ (table 19.5) of which black coal accounted for half (50%), followed by uranium (27%), natural gas (11%) and crude oil (5%). Renewable energy production (including wood, bagasse, biofuel, hydro-electricity and solar thermal energy) accounted for only 2% (290 PJ) of total production in 2007-08.
In the period 2002-03 to 2007-08, Australia's total energy production increased by 2,089 PJ (14%). This was due to increased production of non-renewable energy sources - black coal (up 1,391 PJ), uranium (up 437 PJ), and natural gas (up 388 PJ). Only the production of crude oil significantly decreased over the period 2002-03 to 2007-08 (down 279 PJ). In the same period, total renewable energy production increased by 9% - from 266 PJ in 2002-03 to 290 PJ in 2007-08.
19.5 PRODUCTION OF ENERGY |
|
 | 2002-03 | 2007-08 | Change from
2002-03 to 2007-08 |
| Fuel | PJ | PJ | % |
|
| Black coal | 7 331 | 8 722 | 19.0 |
| Brown coal | 654 | 709 | 8.4 |
| Crude oil and ORF(a) | 1 233 | 954 | -22.6 |
| LPG(b) | 124 | 105 | -15.2 |
| Natural gas | 1 444 | 1 833 | 26.9 |
| Uranium | 4 311 | 4 747 | 10.1 |
| Renewables(c) | 266 | 290 | 8.9 |
| Stock changes and statistical differences(d) | - | 92 | - |
| Total | 15 363 | 17 452 | 13.6 |
|
| - nil or rounded to zero (including null cells) |
| (a) Other refinery feedstock. |
| (b) Naturally occurring. |
| (c) Includes wood, woodwaste, bagasse, biofuels, wind, hydroelectricity and solar. |
| (d) Includes a statistical difference adjustment and previously unreported production. |
| Source: Australian Bureau of Agricultural and Resource Economics, 'Australian Energy Statistics - Australian Energy Update', 2009, Table A & J. |
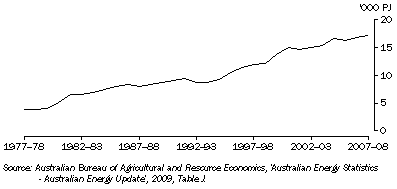
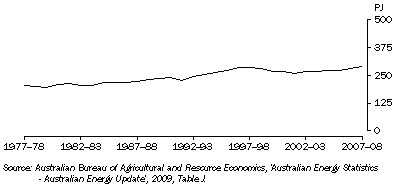
Graphs 19.6 and 19.7 show longer-term trends in the production of non-renewable and renewable energy fuels. Over the period 1977-78 to 2007-08 the production of non-renewable fuels has shown an upward trend, increasing from 3,733 PJ in 1977-78 to 17,070 PJ in 2007-08 (up 357%). However, there has been relatively little growth in the production of renewable energy fuels, which only increased from 202 PJ in 1977-78 to 290 PJ in 2007-08 (up 44%).
19.6 PRODUCTION OF NON-RENEWABLE FUELS

19.7 PRODUCTION OF RENEWABLE FUELS

 Print Page