|
|
Family Functioning: Families with no employed parent
In 2001, over 350,000 families with children under 15 years had no employed parent living in the household. Almost two-thirds (64%) of these families were one-parent families.
Families with no employed parent have been identified as a matter of policy concern by Australian governments in recent years. (SEE ENDNOTE 1) These families can not only experience economic disadvantage, but may have reduced social opportunities which may impact on their wellbeing. Research suggests that children living in families with no employed parent are particularly at risk, as the absence of a resident employed parent may negatively impact on the child's immediate material wellbeing as well as adversely affecting their future income, 'social class' and economic success. (SEE ENDNOTE 2) However, for one-parent families in this situation, a non-resident parent generally provides financial assistance and may also be employed and serve as a role model for the children.
This article uses census data to analyse the characteristics of families with children aged less than 15 years, in which no resident parent is employed. An overview of the social wellbeing and financial stress encountered by families with no employed parent is presented using data from the General Social Survey (GSS).
RECENT TRENDS
In 2001, over 350,000 families with children aged less than 15 years had no employed parent living with them, compared to around 330,000 in 1991. Over this decade, families in which no parent was employed have been a relatively stable proportion of all families with children aged less than 15 years (around 18%). The proportions of families with no employed parent have decreased for both one-parent families (from 58% to 55%) and couple families (from 11% to 8%). There has also been a change in the balance between one-parent and couple families with no employed parent - largely due to the increase in the number of one-parent families over the decade. In 1991, each comprised about half of families with no employed resident parent. By 2001, the balance had changed to around two-thirds (64%) being one-parent families. In a decade of sustained economic growth and declining unemployment, the proportion of families in which both parents were employed increased from 53% in 1991 to 57% in 2001.
FAMILIES WITH NO EMPLOYED RESIDENT PARENT
This article uses data from the 1986, 1991, 1996 and 2001 Censuses of Population and Housing and the ABS 2002 General Social Survey (GSS).
A family is two or more persons, one of whom is at least 15 years of age, who are related by blood, marriage (registered or de facto), adoption, step or fostering, and who are usually resident in the same household.
A couple family with children aged less than 15 years comprises two usual residents, both aged 15 years and over, who are married to each other or living in a defacto relationship with each other who have at least one child aged less than 15 years usually resident in the family.
A one-parent family with children under 15 years is a parent with no resident partner (married or defacto), with at least one child aged less than 15 years usually resident in the family.
In this article, family with no employed parent refers to a family with at least one child aged less than 15 years and in which no resident parent is employed. Other members of the family, or household in which the family lives may be employed. No information is provided on non-resident parents.
Unemployed people are those aged 15 years and over who were not employed, but were available for work and who were actively looking for work.
Not in the labour force people are those aged 15 years and over who were not employed and who were not actively looking for work. |
 |
FAMILIES(a) WITH CHILDREN UNDER 15 YEARS(b): EMPLOYMENT STATUS OF PARENTS |
|
| Couple families(c) | | One-parent families |
|
|
|
| Both parents | One parent | Neither parent | | Total couple | Parent | Parent not | | Total one-parent |
| employed | employed | employed | Total | families | employed | employed | Total | families |
| | | | | | | | | |
| % | % | % | % | ‘000 | % | % | % | ‘000 |
|
| 1991 | 52.9 | 36.5 | 10.6 | 100.0 | 1 510.2 | 41.8 | 58.2 | 100.0 | 289.5 |
| 1996 | 54.4 | 35.5 | 10.1 | 100.0 | 1 521.3 | 42.9 | 57.1 | 100.0 | 372.9 |
| 2001 | 56.5 | 35.0 | 8.5 | 100.0 | 1 528.0 | 45.4 | 54.6 | 100.0 | 420.6 |
|
| (a) Excludes families where a parent’s employment status was not stated. | | | |
| (b) Excludes families where all children aged less than 15 years were absent on census night as comparable data are not available for 1991. |
| (c) Excludes couple families where a spouse was absent on census night. |
|
| Source: ABS 1991-2001 Censuses of Population and Housing. |
|
CHARACTERISTICS OF FAMILIES WITH NO EMPLOYED PARENT
In both financial and social terms, families with no employed resident parent can be disadvantaged relative to families living with an employed parent. However, this is not always the case as people are not in employment for a range of reasons. While some may be unable to obtain employment, others may have an alternative source of income, choose to stay at home (for example, to care for children) or be unable to work (for example, due to ill-health).
In 2001, 83% of lone parents who were not employed were not in the labour force (that is, not actively looking for work) rather than unemployed. Among one-parent families where the parent was not employed but was looking for work, the majority were looking for part-time (58%) rather than full-time employment. This could reflect the difficulty of managing work and home responsibilities without the support of a resident partner.
In 2001, of couples in which both of the partners were not employed, 60% had both partners not in the labour force and a further 9% had both partners unemployed. Among such couple families where both partners were looking for work, 59% of the couples were both looking for full-time employment.
|
COUPLE FAMILIES(a)(b) WITH CHILDREN AGED UNDER 15 YEARS WITH NO EMPLOYED PARENT - 2001
|
| % |
|
| Both parents unemployed | 9.4 |
| Both parents looking for full-time employment | 5.5 |
| Both parents looking for part-time employment | 0.7 |
| One parent looking for part-time employment and one parent looking for full-time employment | 3.2 |
| One parent unemployed and one not in the labour force | 30.7 |
| Both parents not in the labour force | 59.9 |
| Total | 100.0 |
|
(a) Excludes families where a parent’s employment status was not stated..
(b) Excludes couple families where a spouse was absent on census night. |
| Source: ABS 2001 Census of Population and Housing. | |
|
ONE-PARENT FAMILIES(a) WITH CHILDREN(b) WITH PARENT NOT EMPLOYED - 2001
|
| % |
|
| Parent unemployed | 16.5 |
| Looking for full-time work | 7.0 |
| Looking for part-time work | 9.6 |
| Parent not in the labour force | 83.5 |
| Total | 100.0 |
(a) Excludes families where the parent’s employment status was not stated.
(b) Children aged under 15 years.
Source: ABS 2001 Census of Population and Housing. |
...FAMILY COMPOSITION
According to the 2001 census, 18% of children under 15 years (over 660,000 children) lived in a household with no employed parent, with over half (61%) of these living in one-parent families.
In half (50%) of all the couple families with no employed parent, the youngest child was aged less than five years, and in a further 27% the youngest child was aged 5-9 years, while in the remaining 23% the youngest child was aged 10-14 years. A considerable proportion (44%) of one-parent families with the parent not employed were families with their youngest child aged less than five years and a further 32% were families in which the youngest child was aged 5-9 years.
Families with no employed parent were more likely to have a larger number of children than were families with at least one employed parent. In 2001, of families with children aged less than 15 years, around one-quarter (27%) of couple families with no employed parent, and one-fifth (19%) of such one-parent families, had three or more children living in the family. In comparison, of families with at least one employed parent, 20% of couple families and 9% of one-parent families had three or more children.
...HOUSEHOLD INCOME
The economic wellbeing of families is largely determined by their income. Partners in a relationship and dependent children generally share the family's income. Income estimates are equivalised to take into account household size and composition (see Australian Social Trends 2004, Household income, pp. 142-145).
FAMILIES(a) WITH CHILDREN UNDER 15 YEARS: Equivalised gross household income distribution - 2001
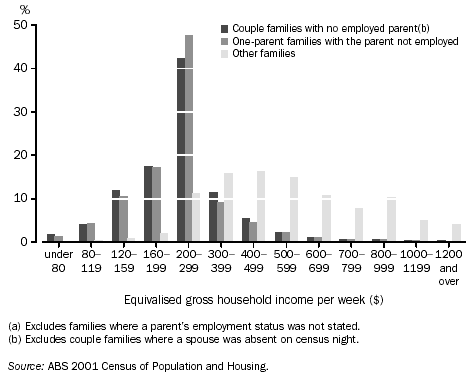
In 2001, for a large proportion of couple families with no employed parent (79%) and one-parent families with the parent not employed (88%), the equivalised gross household income was less than $300 per week.
Only a small proportion (15%) of families with an employed parent had an equivalised household income less than $300 per week. The proportions of couple and one-parent families with no employed parent were highest in the $200-$299 equivalised household income range.
|
Families(a) with children aged under 15 years with no employed parent: other employed people in the household(b) - 2001 |
|
| Couple families | One-parent families |
| | |
| Household member employed | % | % |
|
| One person employed | | |
|
| 16.6 | 9.9 |
|
| 48.6 | 23.1 |
|
| 9.0 | 15.4 |
Unrelated individual living in family household
| 4.5 | 22.3 |
| Two or more people employed | 12.0 | 14.2 |
| Other(c) | 9.4 | 15.1 |
| | |
| Total | 100.0 | 100.0 |
|
| ‘000 | ‘000 |
|
| Total families with no employed parent in a household where someone is employed | 16.5 | 35.3 |
|
| (a) Excludes families where a parent’s employment status was not stated. | |
| (b) Excludes visitors to the household on census night. | |
| (c) ‘Other’ category includes families with no employed parent living in multiple family households where members of the second family are employed. |
| | |
| Source: ABS 2001 Census of Population and Housing. | | |
|
OTHER EMPLOYED PEOPLE IN THE HOUSEHOLD
While the employment status of parents can be particularly influential for a family, having other family members in employment can affect economic wellbeing and offer role models for children. Also, while most Australian families are formed around a couple or parent relationship and live in a household by themselves, some families share their dwelling with other families or other related and unrelated individuals, any of whom may be employed (see Australian Social Trends 2003, Changing families, pp.35-39). Whilst the employed person may or may not share their income with the family, there are potential economic gains such as shared dwelling costs. Such household members may also provide a role model for children in the household in terms of being an employed adult.
In 2001, 13% of couple families with no employed parent lived in a residence where someone was employed. In almost half (49%) of couple families, the person employed was a non-dependant child. In some of these couple families more than one person was employed (12%). In comparison, 16% of one-parent families, with the parent not employed, lived in a residence where someone was employed.
In almost one-quarter (23%) of these one-parent families, the person employed was a non-dependant child. Also, in 14% of these families more than one person was employed.
GENERAL SOCIAL SURVEY
The General Social Survey (GSS), conducted by the ABS in 2002, provides a wide range of information on the social and economic wellbeing of adults (persons aged 18 years and over) living in private households.
Information about individuals (e.g. contact with family/friends, participation in voluntary work or social activities, ability to get support in a time of crisis) was collected for only one randomly selected adult per household. Information about the household in which they live (e.g. household and family composition, number of adults employed, financial stress) was also collected.
The discussion in this article on financial stress and social wellbeing uses data on family households, i.e. households with at least one child aged less than 15 years of age.
In the GSS, the selected indicators of financial stress relate to the household, and the selected indicators of social activities and support relate to an adult in the family household, not necessarily a parent. |
FINANCIAL STRESS
The remainder of the article uses data from the 2002 General Social Survey (GSS). Analysing GSS data on family households where no resident parent was employed provides insight into the financial stress and social wellbeing of families with no employed parent.
SELECTED INDICATORS OF FINANCIAL STRESS(a) IN FAMILY HOUSEHOLDS - 2002
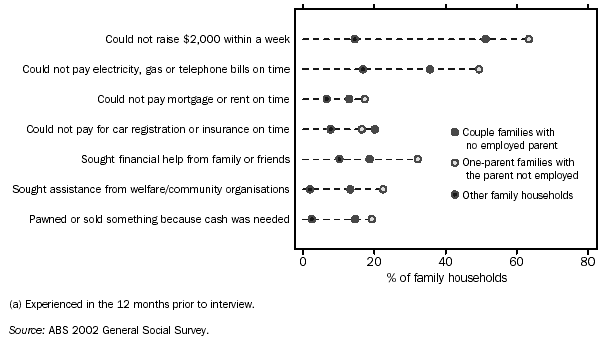
In 2002, just over 600,000 children aged less than 15 years were living with no employed resident parent. Their families were more likely to report financial difficulties than were families where at least one parent was employed. Their families were also more likely to be affected by selected indicators of financial stress than families where at least one parent was employed.
In 2002, of families with no employed resident parent, just under two-thirds (64%) of the one-parent families, and over one half (51%) of the couple families, felt that they could not raise $2,000 within a week. Conversely, only 15% of all other families felt they could not raise this amount. Also, of families with no employed resident parent, a greater proportion of the one-parent families (49%) and the couple families (36%) had difficulty paying bills on time than did other family households (17%). Similarly, of the families with no employed resident parent, both one-parent (32%) and couple families (19%) were more likely to have sought financial help from family or friends than were other families (10%).
SOCIAL WELLBEING
Participation in paid work is only one way in which individuals can feel a sense of social inclusion and build social networks. Social networks can also be built through volunteer work, participation in sporting or recreation clubs, as well as through family and friends. If members of families with no employed parent do not have means of social participation unrelated to employment, then feelings of exclusion and isolation could be experienced by the entire family.
Social participation, in itself valuable, can also help people to develop skills that may be useful in gaining paid employment. In 2002, a substantial majority of adults in families with no employed resident parent did interact with wider social networks, but overall these interactions were less likely than for adults in other families. Three-quarters (75%) of adults in couple families with no employed resident parent participated in selected social activities, compared to 90% of adults in one-parent families with no resident employed parent and 96% of adults in other families. Adults in both couple families and one-parent families with no employed resident parent (85% and 92% respectively) were less likely to feel able to gain support in a time of crisis than did adults in other families (96%).
For more information on social participation, see Australian Social Trends 2004, Social interactions outside home, pp. 35-40.
|
SELECTED SOCIAL ACTIVITIES AND SOCIAL SUPPORT CHARACTERISTICS OF ADULTS IN FAMILIES - 2002 |
|
| Family households with no
employed resident parent | |
| |
|
| |
| | One-parent | Other family |
| Couple family | family | households |
|
| % | % | % |
|
| Participated in selected social activities in the last three months(a) | 74.8 | 89.5 | 95.9 |
Recreational, cultural, community or special interest
group activities (incl. church or religious activities)
| | | |
27.6 | 28.1 | 45.2 |
Socialising, sports and entertainment activities(b)
| 72.4 | 88.7 | 94.3 |
| | | |
| Undertook unpaid voluntary work in the last 12 months | 18.2 | 31.5 | 43.4 |
| At least weekly contact with family or friends(c) | 90.1 | 94.9 | 96.7 |
| Able to get support in a time of crisis(a)(d) | 85.0 | 92.1 | 96.1 |
Family member or friend(c)
| 80.1 | 85.7 | 95.0 |
Neighbour or work colleague
| 20.9 | 24.0 | 48.4 |
Community, charity or religious organisation
| 15.3 | 22.0 | 17.0 |
Health, legal or financial professional
| *11.1 | 11.1 | 15.4 |
Local council or other government services
| *7.5 | 11.3 | 8.6 |
|
| ‘000 | ‘000 | ‘000 |
|
| Total households | 98.0 | 220.8 | 1 844.3 |
|
| (a) Components do not add to total as respondents could be in more than one category. |
| (b) Includes going out to a restaurant, cafe or bar; attending or taking part in sport/physical activities, movie, theatre or concert; and visiting a library, museum, art gallery, park/garden, zoo or theme park. |
| (c) Other than members of own household. |
| (d) Includes other sources of support not listed. | | | |
| | | |
| Source: ABS 2002 General Social Survey. | | | |
|
ENDNOTES
1 Reference Group on Welfare Reform 2000, Participation Support for a More Equitable Society: Final Report of the Reference Group on Welfare Reform, Department of Family and Community Services, Canberra.
2 Gregory, RG 1999, Children and the changing labour market: Joblessness in families with dependent children, Discussion Paper No.406, Centre for Economic Policy Research, Australian National University.
|
 Print Page
 Print All