Qinghuan Luo (Economic Statistics Research Section)¹
Hospital output measures in the Australian National Accounts: experimental estimates, 2004-05 to 2017-18
This paper describes new experimental indexes for the volume of output of Australian hospitals
Released
28/09/2020
Introduction
The ABS recently published experimental indexes for hospital admitted care services for the Australian National Accounts (ANA) using Australian Institute of Health and Welfare (AIHW) disease expenditure data.² ³ This paper extends those experimental indexes to include hospital services in emergency department care and non-admitted patient care, thereby achieving complete coverage of hospital patient care services. This coverage enhancement also enables measurement of shifts across categories of care over time.
The primary purpose of the work presented in this paper is to improve output measures of health care services in the Australian National Accounts.⁴ Enhanced output measures also have the potential to improve the measurement of health care in ABS productivity statistics, which are an important source of information for broader economic decision making.⁵
With the national accounting focus of this work in mind, its scope is hospital services which are classified under two Australian and New Zealand Standard Classification (ANZSIC) classes: Hospitals (excluding psychiatric hospitals) and Psychiatric hospitals.⁶ Hospital output is significant, accounting for 38.3% of the Health care services industry’s output in 2016-17.⁷ With the backdrop of an ageing population, technological change and other potential changes in health care, hospital output is expected to come under increasing scrutiny.
The ABS invites feedback from the public on the experimental methods proposed in this paper. For further discussion of these methods please contact the ABS at economic.research@abs.gov.au.
Footnotes
Overview of hospital services
The Australian hospital system consists of public hospitals and private hospitals. Public hospitals provide the majority of services.
Hospital services fall into three categories:
- Admitted patient care,
- Emergency department care, and
- Non-admitted patient care.
Admitted patient care refers to hospital services provided to patients who undergo a formal hospital admission process. Emergency department care refers to services provided in hospital emergency departments. Non-admitted patient care refers to services provided to patients who do not undergo a formal admission process. These services are mainly provided at outpatient clinics within hospitals.
Almost all emergency department care and non-admitted patient care services are provided by public hospitals.
Private hospitals focus on providing admitted patient care services. The proportion of private hospital activity in emergency department and non-admitted care is relatively small (for example, in 2016-17, private hospital non-admitted care accounted for only about 4% of all non-admitted events). As a result, for private hospitals, only admitted patient care has been measured.
Figure 1 shows the relative proportions of hospital expenditure for public and private hospitals between the three categories of care in 2017-18.⁸
In addition to caring for patients, hospitals may engage in training, teaching and research. It is difficult to estimate growth in the volume of these activities because of a lack of output indicators and suitable data. Output in this area is therefore assumed to grow at the same rate as total patient care services delivered to patients.
Source: AIHW Hospital Resources 2017-18, ABS Private Hospitals 2016-17.
Note: ED=Emergency Department
Footnote
Market and non-market classification of hospitals
Non-market output occurs when goods and services are provided free of charge, or when consumers face prices which are not economically significant. This occurs when prices have no significant effect on the amount that producers are willing to supply and consumers wish to buy.⁹
To ensure accurate measurement, the ABS examines each producing unit in the economy to determine whether it charges economically significant prices for its output. Units that predominantly charge prices that are not economically significant are classified as non-market producers.
Private hospitals are considered to produce market output.
Public hospitals deliver services to patients at prices (paid by patients) which are not deemed to be economically significant.¹⁰ As non-market producers under the control of governments, public hospitals are classified to the general government sector in macroeconomic statistics. More information on the institutional sector classification used in Australia can be found in Standard Economic Sector Classifications of Australia (ABS Cat. no. 1218.0).¹¹
While most industries in Australia contain only a small proportion of non-market production, the Health care services industry contains significant amounts of non-market output. This creates difficulties with measuring the productivity of this industry. As a result, the ABS currently excludes the Health care services industry from published multifactor productivity statistics.
For further information about the conceptual framework which underpins the measurement of non-market output, please refer to “Non-market output measures in the Australian National Accounts: a conceptual framework for enhancements”.
Footnotes
Data sources and methods
Hospital output volume indexes
The direct volume index approach was adopted for both public and private hospitals.¹² In this approach, the volume of hospital output was measured using volume indexes constructed by combining indicators describing changes in output of each product with cost weights (Schreyer 2010). Cost weights were used to derive the relative price of each product, and thus compile an aggregate index.
The volume of private hospital output could be estimated by deflation. However, the direct volume index method was used for two main reasons. First, it allowed a comparison between public and private hospitals using the same approach. Second, private hospital separations and costs data was available.
Ideally, indexes for health care output should be constructed based on products describing the treatment of each disease where the quantity unit is the “bundle” of activities involved in the treatment (Schreyer 2010; Aizcorbe 2013). In practice, National Statistical Offices usually adopt products defined as episodes of care. In the case of hospitals, separations (for admitted care) or episodes of care are used.¹³
In measuring hospital output, an ideal index should capture substitutions across different care settings within hospitals. For example, shifts away from treatments in admitted patient care settings to outpatient treatments, driven by technological improvement, could lead to lower costs but achieve the same or a better outcome. This is an efficiency gain and should be reflected in the volume of output (Schreyer 2010; Aizcorbe 2013; Gu and Morin 2014). A preferred approach is to group episodes of hospital care by disease regardless of care settings, but this requires an integrated data set covering all care types, which is not yet available.
While the long-term aspiration is to develop a total hospital output volume index from an integrated data set, a pragmatic approach has been used that constructs a total hospital index as the aggregation of indexes constructed separately for each service category. Using this pragmatic approach, variations in output for the three categories of care can be captured.
Admitted patient care
The current ABS method for measuring hospital activities was developed in the late 1990s. Hospital separations were stratified by Australian Refined Diagnosis Related Groups (AR-DRG) (ABS 1997, 1999). The indexes, mainly covering admitted acute patient care in public and private hospitals, relied on the AIHW’s published AR-DRG data (around 600 AR-DRGs). When the published AR-DRG cost data became less accessible, the indexes from 2007-08 were based around 25 Major Diagnostic Categories (MDCs) without further disaggregation.¹⁴ The Major Diagnostic Category generally groups diagnoses according to the major organ in which a condition occurs.¹⁵ Cost weights were sourced from the published costs of Major Diagnostic Categories.¹⁶ The existing indexes from 2015-16 onward exclude mental health.
The ABS recently constructed new experimental volume indexes for admitted patient care using the AIHW admitted patients disease expenditure data. These experimental indexes cover all admitted patient care services including acute, admitted mental health, sub-acute and non-acute care.
Hospital separations were stratified using principal diagnosis and age group. Principal diagnoses were stratified to the International Classification of Diseases and Related Health Problems (ICD), Tenth Revision, Australian Modification (ICD-10-AM – henceforth ICD). ICD is the international classification standard for reporting diseases and health conditions. The classification is maintained by the World Health Organisation.
Stratification of hospital episodes by ICD has some advantages.¹⁷ It allows stratification of episodes across different care settings, e.g. admitted care in hospitals and hospital care delivered within the patient’s home, referred to as Hospital in the Home. The ICD approach also allows stratification of episodes across admitted patient care and outpatient settings, though this was not pursued due to a lack of non-admitted service events with diagnoses mapped to ICDs.
The disease expenditure data only allowed principal diagnoses to be grouped by broad categories of ICDs, called ICD chapters. The stratification gave rise to about 400 ICD chapters by age of patient cohorts, compared to 25 Major Diagnostic Categories used in the ABS’s current index. The age-group variable captured part of the patient characteristics related to co-existing medical conditions, referred to as comorbidities. A patient’s comorbidity can be related to age, with elderly patients more likely to have comorbidities.
The previously published experimental admitted patient care indexes were extended to the latest years, using AIHW’s published principal diagnosis data set.¹⁸ AIHW disease expenditure data is only available from 2004-05 to 2012-13.
The principal diagnosis data set includes all admitted patient separations in public and private hospitals with a time series extending back to 1998-99. One limitation with this data set is that it does not contain cost information. The other limitation is that the data is not decomposed into public and private hospital patients.
To overcome the first limitation, i.e. the lack of cost weights, relative cost weights covering the period from 2013-14 onward were estimated based on the unit costs in 2012-13 from the disease expenditure data, annually updated by the average length of stay of patients in hospitals. Here the average length of stay was calculated as total number of patient days for each principal diagnosis age group divided by total number of separations from the principal diagnosis data set.
The underlying assumption for this approach was that average length of stay is a main driver for patient costs. This was supported by the strong correlation between unit costs and average length of stay in the disease expenditure data.¹⁹
An alternative approach was to use the fixed unit costs of 2012-13. However, incorporating changes in the average length of stay has an advantage as it takes account of differential changes in the cost weights driven by variation in patient days over time and across principal diagnoses and age groups.
To partly overcome the second limitation, the AIHW’s published separations for principal diagnoses by hospital sector was used to split the principal diagnosis data set into public and private hospitals.²⁰ This essentially assumes the same ratio of public to private hospital separations across all age groups for each ICD chapter.
Changes in coding standards and rules pose a challenge for year to year comparison of hospital separations. This may impact indexes if the affected ICDs have a significant cost weight.²¹ The ICD classification is currently updated every two years, but changes mostly affect the finer level of details. In this analysis the impacts on the aggregate index were generally not material as the indexes are calculated from broad categories of diseases (ICD chapters).
In interpreting the results described in this paper, it is worth noting the following limitations:
- Cost weights from 2013-14 onwards were modelled based on unit costs in 2012-13 and the average length of stay. The method could be updated when the AIHW’s updated cost estimates become available.
- A fixed split was used for all age groups in partitioning hospital separations into public and private hospitals from 2013-14 onward. This drawback could be overcome in the future by sourcing the AIHW internal data directly.
- Patients may have comorbidities when admitted to hospital. These are usually recorded as additional diagnoses in the patient’s admission record. As a patient’s additional diagnoses can drive treatment costs, it is desirable to include comorbidity in the index. As mentioned, stratification by age group captures some aspects of comorbidity.
Emergency department care
The main data set for public hospital emergency department activity and costs was sourced from the Independent Hospital Pricing Authority (IHPA)’s published Urgency Related Group (URG) table.²² The IHPA data includes the number of emergency department presentations and average cost per presentation. The published data set goes back to 2009-10.
The URG is a patient classification used to group patients treated in an emergency department.²³ In 2017-18 it had around 120 classes within five triage categories in the following order of urgency: Resuscitation, Emergency, Urgent, Semi-urgent, and Non-urgent.
Emergency department activity and costs for the earlier period from 2004-05 to 2008-09 were sourced from the Productivity Commission Reports on Government Services (ROGS) - Public Hospitals.²⁴ The ROGS data set has a breakdown of 5 admitted triage categories and 5 non-admitted triage categories, which are largely aligned with the URG data. Both the URG data and ROGS data were sourced from the National Hospital Cost Data Collection - the administrative data on hospital costs and activity at the patient episode level, which is collected annually by IHPA.²⁵
The URG and ROGS data sets have varying coverage. As the National Hospital Cost Data Collection does not include all hospitals, the coverage for emergency department activity and non-admitted care activity varies significantly from year to year. For example, there was a significant increase in the coverage from 60% in 2010-11 to 73% in 2011-12. This could have been due to improved hospital activities data collection in anticipation of the implementation of Activity Based Funding for hospitals under the National Health Reform Agreement by the Commonwealth and state/territory governments.²⁶ As a result, the change in a volume index compiled from these data sets may not reflect the true change in the volume of output in emergency department care.²⁷
To help overcome this limitation, AIHW published totals were used to estimate the population total (all emergency department presentations). A volume index was constructed by combining the URG and ROGS data sets with the AIHW’s total. Two approaches were considered for constructing an index incorporating the AIHW’s total.
The first approach, referred to as the “composition” method, treated emergency department presentations covered by the sample (URG or ROGS) and those outside the sample as two separate components. An index was constructed for each component, with the final index being an aggregate of the two.
For presentations covered by the sample, a volume index was constructed based on the URG classification (the URG data set) or triages (the data set from ROGS). The number of presentations was used as the quantity indicator and URG or triage unit costs used to derive cost weights.
Change in the volume of output outside of the sample was assumed to be the same as the unweighted index of total quantity (i.e. the difference between the AIHW’s total and sample total).
A final index for emergency department care was derived as an aggregate of the volume index from the sample and the unweighted index. Quantity weights were used in the aggregate, which assumed that the average cost of episodes outside the sample equals the average cost within the sample. In this approach, the effect of a sample coverage increase is largely balanced out by a decrease in the unweighted index.
The second approach, referred to as the “scale-up” method, was to scale up the sample (URG or ROGS data set) to the aggregate total from the AIHW. This created a rescaled data set with total number of presentations being equal to the aggregate total. A final index was calculated using the rescaled data set in the same way as for the construction of an index from the original sample in the first approach. The second approach implicitly assumes that composition of the sample is representative for all emergency department activity.
A more detailed description of these two approaches is provided in Appendix B.
The two approaches produce very similar results, confirming that the contribution to change in the index from varying coverage was largely removed.
Non-admitted patient care
The main data set for non-admitted patient care activity and costs was sourced from the IHPA’s public hospital non-admitted patient care data using the Tier 2 Non-Admitted Patient Care Classification, i.e. the Tier 2 data set. The Tier 2 classification is a patient classification for grouping non-admitted patients.²⁸ The data includes variables of the number of non-admitted events and average cost per event classified to the Tier 2 Classification. The published data goes back to 2009-10.
Similar to the URG data, the Tier 2 data coverage varies significantly from year to year, especially between 2009-10 to 2012-13.
Similar to the approaches used for emergency department activity, AIHW published data was used to approximate the population total of non-admitted events. A volume index was constructed by combining the URG data set and AIHW’s total using the two approaches described earlier for emergency department care.
A complication with the two approaches was that the AIHW’s aggregate total of non-admitted events is only available from 2013-14 and onwards. For 2012-13 and earlier years the AIHW used a different counting unit based on occasions of service.²⁹
A time series was created back to 2009-10 for total non-admitted events by extrapolating from the 2013-14 estimate using the growth rate of non-admitted occasions. The underlying assumption was that the ratio of two counting units (event versus occasion) was fixed over this period.
Where possible, adjustments for coding rule changes were made to minimise the impacts on the final index. For example, there was a change in the counting rules for Tier 2 Class 1016 Renal Dialysis - Peritoneal Dialysis - Home Delivered in 2015-16. Prior to 2015-16, each occasion was counted individually, but from 2015-16, an event was defined on a monthly basis i.e. more than one occasion in a month was only counted once. This resulted in a sharp fall in the number of events in this class, compared to 2014-15. This change was reflected in the aggregate total of non-admitted events, so an adjustment was made to both the aggregate total and Tier 2 data to make the quantity measures comparable over time.
Due to a lack of non-admitted care data with breakdowns of costs to match the details of non-admitted activity for 2008-09 and earlier periods, an unweighted quantity index based on the total number of non-admitted occasions was used from 2004-05 to 2009-10.
There are some limitations with the general approaches described above:
- The Tier 2 data set has limited coverage, with the ratio of the Tier 2 total to the AIHW’s aggregate total being around 50% in 2017-18.
- Changes in coding rules of the Tier 2 Classification may not be fully accounted for, as this requires remapping of the Tier 2 data to the same version from patient episode level data.
Total hospital volume index
A total hospital volume index was calculated as the aggregate of the total public and private hospital indexes. The total public hospital index was calculated as aggregate of admitted patient care (AP), emergency department care (ED) and non-admitted patient care (NAP). The total private hospital index was proxied by a private hospital admitted care index because, as discussed earlier, the quantities of emergency department care and non-admitted patient care delivered by private hospitals are relatively small.
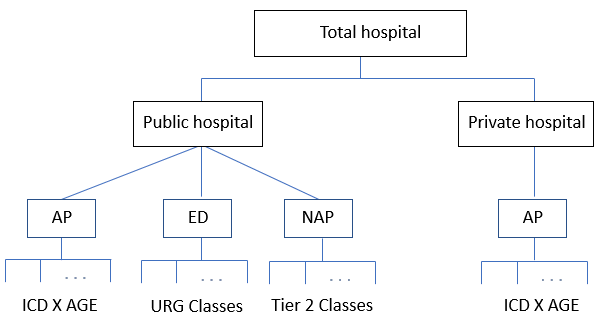
Figure 2 illustrates the index structure for the aggregate total hospital index. The lowest level is the stratification by the relevant classifications used for each service category.
Figure 2: Aggregate total hospital index
Image
Description
This image is a flow diagram that begins with Total Hospital. This flows into two separate sections for public hospital and private hospital.
Public hospital then flows into AP (Admitted patient care), ED (Emergency department) and NAP (Non-admitted patent care). AP flows into ICD X AGE, ED flows into URG Classes and NAP flows into Tier 2 Classes.
Private hospital flows into it own separate AP (Admitted patent care) which flows into ICD X AGE.
AP: Admitted patient care; ED: Emergency department; and NAP: Non-admitted patient care
Public hospital weights by service category
Public hospital weights by service category were estimated directly from the AIHW estimates of recurrent expenditure on public hospital services split by National Health Reform Agreement product stream.³⁰ Recurrent expenditure includes salary and wage expenditure, and non-salary expenditure such as payments to visiting medical officers, on a recurring basis. The published expenditure estimates by product stream go back to 2014-15.
To estimate the historical weights for 2013-14 and earlier, the proportion of total expenditure on admitted care was sourced directly from the AIHW.³¹
The proportion of total expenditure on emergency department care was derived as follows. First, the ratio of expenditure on emergency department care to that on admitted care, denoted by \(R_{ED/AP}\), was estimated using average cost \(\big(C_{ED}\big)\) per emergency department presentation and total number of presentations \(\big(N_{ED}\big)\), and average admitted patient cost \(\big(C_{AP}\big)\) and total number of separations \(\big(N_{AP}\big)\), that is, \(R_{ED/AP}=C_{ED}N_{ED}/C_{AP}N_{AP}\). Second, the proportion for emergency department care was estimated as \(R_{ED/AP}*\) (proportion for admitted care).
The proportion for non-admitted care was approximated by³²
(proportion for non-admitted care) = 1 – (proportion for admitted care) – (proportion for emergency department care).
Relative weights of public versus private hospitals
As the primary objective was to measure the gross output of hospitals, aggregate public and private hospital output were derived based on their current price value weights. For public hospitals, the appropriate weights were based on hospital recurrent expenditure as described above.
For private hospitals, one option was to use hospital recurrent expenditure in the same way as public hospitals. The second option was to use revenue for private hospitals. This second option would give a higher weight to private hospitals as it includes profit margin, a concept which is not applicable for public hospitals.
To enable a comparison of relative output between public and private hospitals on the basis of the same cost weighted method, recurrent expenditure was used as weights for both public and private hospitals. These weights were sourced directly from the AIHW’s published recurrent expenditure proportions by area of expenditure.³³ The relative weights in 2017-18 were estimated to be about 78% for public hospitals and 22% for private hospitals.
Footnotes
Results
Public hospitals
Figure 3 presents volume indexes for public hospital admitted care, emergency department, non-admitted care, and total public hospital care from 2004-05 to 2017-18. The index reference period is set at 2004-05. For admitted care, costs from 2013-14 and onward were modelled based on the 2012-13 costs and annual estimates of average length of stay. For both emergency department and non-admitted care, the composition method was used to remove the effects of variations in the data coverage as described earlier.
As expected, the total public hospital index tracks closely the admitted care index as admitted care dominates the total index.
The non-admitted index increases at an annual rate of around 3.9% from 2004-05 to 2017-18, compared to admitted care of around 3.6%. The non-admitted care index appears to increase at a faster rate from 2015-16. Increasing shifts of care that has traditionally been delivered in the admitted setting to non-admitted care could be a contributing factor to such increases.
The emergency department index generally outpaces the admitted care index in earlier periods (2004-05 to 2009-10), driven mainly by strong growth in the number of presentations to the emergency department. From 2012-13, the index follows largely the admitted care index.
Figure 4 shows the emergency department index derived using both the composition method and the scale-up method. The two indexes show a similar pattern with an average annual rate of about 3.6%.³⁴
Figure 4 also shows that, from 2011-12, the indexes generally increase faster than total number of presentations. This could be caused by shifts in the composition of emergency department presentations from the less urgent triages with lower average costs to the more urgent triages with higher average costs. Such shifts can be seen from Figure 5 showing the relative proportions of emergency department presentations grouped into the less urgent 4 – 5 (Semi-urgent, and Non-urgent) and the more urgent 1 – 3 (including Resuscitation, Emergency, and Urgent). Figure 5 used the ROGS and URG data. Since presentations in triages 1 – 3 tend to have a higher average cost, this might explain why the volume index grows more quickly than the number of presentations.
Figure 6 compares the composition and scale-up methods for non-admitted care. The unweighted index based on AIHW’s total count of non-admitted occasions (2004-05 to 2013-14) and events (2013-14 to 2017-18) is included for comparison. While the two methods produce indexes growing at similar rates over most periods, significant differences can be seen from 2009-10 to 2010-12 where the scale-up method shows some volatility. Note that the sample coverage is very low over this period (around 20%). The scale-up method performed less well than the composition method because the sample coverage is low and its composition becomes less representative for the population. The composition method performs better in this case.³⁵
Public versus private hospital admitted care
Figure 7 compares volume indexes for admitted patient care between public and private hospitals. The private hospital index generally grows faster than the public hospital index, until 2015-16, when growth in the public hospital index outpaces the private hospital index.
As growth in hospital admissions is a key driver for growth in the admitted care volume indexes, the slowdown in growth in the private hospital index from 2015-16 could be attributed to a slowdown in growth in private hospital admissions. This could partly reflect trends in private health insurance hospital cover as the majority of private hospital separations were funded by private health insurance.³⁶ The coverage of private health insurance hospital cover, as percentage of the Australian population, rose steadily from 2005-06, peaking at around 47.3% in 2014-15. Since then coverage has declined to 45.5% in 2017-18.³⁷ The small decline in private health insurance coverage may have contributed to the slowdown in private hospital admissions growth in recent years, although flows of private patients to public hospitals can also affect the growth of private hospital admissions.³⁸
Figure 8 shows that from 2011-12 the public hospital admitted care volume index increased slightly faster than total number of public hospital separations. This could be caused by shifts from episodes of care involving less resources to those involving more resources. Given that the difference is small, some caution is needed in interpretation of this result.
Figure 9 shows that the private hospital admitted care index grew more slowly than total number of private hospital separations. This could be caused by shifts towards episodes of care that involve less resources. This trend is in contrast to public hospitals from 2011-12 (as shown in Figure 8).
For both public and private hospitals, the admitted care index for each ICD chapter can be estimated by aggregating across age groups. Table 1 compares average annual growth rates of ICD chapters between public and private hospitals from 2004-05 to 2017-18. Index movement patterns may partly reflect differences in `product mix’ (e.g. public hospitals tend to have more patients admitted with emergencies while private hospitals tend to have more patients admitted for elective surgeries).
| IDC Chapters | Public | Private | |
|---|---|---|---|
| A00-B99 | Certain infectious and parasitic diseases | 8.0% | 6.5% |
| C00-D48 | Neoplasms | 2.0% | 3.2% |
| D50-D89 | Diseases of the blood and blood-forming organs and certain disorders involving the immune mechanism | 5.8% | 8.2% |
| E00-E89 | Endocrine, nutritional and metabolic diseases | 2.9% | 5.3% |
| F00-F99 | Mental and behavioural disorders | 2.9% | 5.6% |
| G00-G99 | Diseases of the nervous system | 5.7% | 6.1% |
| H00-H59 | Diseases of the eye and adnexa | 4.6% | 6.1% |
| H60-H95 | Diseases of the ear and mastoid process | 2.9% | 3.5% |
| I00-I99 | Diseases of the circulatory system | 2.0% | 2.1% |
| J00-J99 | Diseases of the respiratory system | 4.0% | 3.1% |
| K00-K93 | Diseases of the digestive system | 2.6% | 2.1% |
| L00-L99 | Diseases of the skin and subcutaneous tissue | 4.2% | 1.6% |
| M00-M99 | Diseases of the musculoskeletal system and connective tissue | 3.2% | 3.5% |
| N00-N99 | Diseases of the genitourinary system | 3.1% | 2.2% |
| O00-O99 | Pregnancy, childbirth and the puerperium | 1.9% | -1.1% |
| P00-P96 | Certain conditions originating in the perinatal period | 2.3% | -0.2% |
| Q00-Q99 | Congenital malformations, deformations and chromosomal abnormalities | -0.5% | -0.9% |
| R00-R99 | Symptoms, signs and abnormal clinical and laboratory findings, not elsewhere classified | 6.0% | 6.9% |
| S00-T98 | Injury, poisoning and certain other consequences of external causes | 5.0% | 3.7% |
| Z00-Z99 | Factors influencing health status and contact with health services | 3.5% | 5.4% |
Figures 10 and 11 compare the new indexes with the ABS current method. There are noted differences, especially from 2015-16 onwards where the existing indexes exhibit a sharp fall in growth compared to the experimental indexes for both public and private hospitals. The fall can be largely attributed to the exclusion of admitted mental health data from 2015-16.³⁹ From that period mental health was classified to a separate care type. Mental health has been seen in Table 1 with a relatively higher annual growth rate for private hospitals.
Figure 12 shows the total hospital index as an aggregate of the public and private hospital indexes. The ABS current method, i.e. an aggregate from Figures 10 and 11, is also shown for comparison. The new total index generally grows faster than the existing index.
Overall, from 2013-14 to 2017-18, the total hospital index grows an annual rate of 4.3%, significantly faster than the 1.6% annual population growth over the same period. As mentioned, the growth was largely driven by growth in hospital admissions. The rising demand for hospital care services could be attributed to demographic factors, particularly Australia’s ageing population, and the rise in prevalence of chronic disease among adults.⁴⁰
Footnotes
Conclusions and discussion
A volume index was constructed covering all three service categories delivered by hospitals (admitted patient care, emergency department care, and non-admitted patient care) using data sourced from the AIHW and IHPA. Experimental volume indexes for admitted care were constructed separately for public and private hospitals using the method described in an earlier paper (Footnote 3) by combining the AIHW disease expenditure data set and principal diagnosis data set.
Experimental volume indexes for public hospital emergency and non-admitted care were constructed using the IHPA’s published emergency department and non-admitted patient care data sets, combined with the AIHW’s aggregate totals. The data sets sourced from IHPA have varying coverage, which can impact the indexes. In both cases, the AIHW’s aggregate total was incorporated into the index to account for coverage changes.
Several conclusions can be drawn from the experimental indexes, with some caveats due to data limitations:
- Changes in the volume of hospital output are largely driven by changes in the volume of admitted patient care. This is not surprising given that majority of hospital activities are in admitted patient care. Overall growth was notably faster than population growth.
- For public hospitals, the output index from non-admitted care services tended to grow faster than the admitted care index with compound annual growth rate of around 3.9% compared to 3.6% for admitted care from 2004-05 to 2017-18. The emergency department index exhibited a faster growth in earlier periods (2004-05 to 2009-10) and then re-aligned to the admitted care index.
- There were notable differences between public and private hospitals in admitted care. The private hospital index generally grew faster in earlier periods (2012-13 and earlier), but growth slowed in recent years (from 2013-14).
- The private hospital admitted care index grew more slowly than total number of private hospital separations. In contrast, the public hospital admitted care index grew slightly faster than total number of public hospital separations from 2011-12. This suggests compositional shifts between public and private hospitals over this period (as discussed in relation to Figures 8 and 9).
Next steps - possibilities for future work
The experimental indexes for admitted care rely on the AIHW disease expenditure data with cost breakdowns by ICD chapters and age groups. It is desirable to develop sustainable methods and models for estimating admitted patient costs with further breakdowns for each ICD chapter. A potential benefit of stratifying episodes of care more finely by ICD is to improve matching, which controls more effectively for quality changes in an index. While hospital separations by diagnosis to the finer level of ICDs can be sourced from the AIHW principal diagnosis data cubes, cost weights matching this level of activity detail are not readily available. For public hospitals, one possibility is to source patient costs directly from the patient level data from the National Hospital Cost Data Collection.
The admitted care indexes can be refined by including comorbidities. The AIHW has developed a cost model that allows costs to be attributed to secondary diagnoses in addition to the principal diagnosis. However, to utilise these disaggregated costs in constructing quantity indexes, a method for stratifying hospital separations including patient comorbidity is needed.
Longer term, the aggregate hospital index could be improved by using an integrated data set covering all three service categories. This would allow output to be measured using the patient "pathway" within hospitals, across different care settings. This has the advantage of better accounting for shifts across different service categories. To achieve this, the ABS would require patient level data, which could be sourced from the National Hospital Cost Data Collection.
It could also be worth exploring the possibility of explicitly adjusting output measures for quality changes from the patient’s perspective. Some National Statistical Offices have already experimented in this area.⁴¹ Due to the lack of an internationally agreed framework for explicit quality adjustment, such an extension would be challenging.
Footnote
References
Show all
Glossary⁴²
Show all
Technical appendix A: General formulae for constructing hospital quantity indexes
Show all
Technical appendix B: Methods for accounting for varying data coverage in a quantity index
Show all
Previous catalogue number
This release previously used catalogue number 5900.0.00.002