Personal Safety, Australia

This is not the latest release View the latest release

Statistics for family, domestic, sexual violence, physical assault, partner emotional abuse, child abuse, sexual harassment, stalking and safety

Reference period
2016
Released
8/11/2017

Key statistics

  •  Two in five Australian adults had experienced violence since age of 15.
  •  One in six women and one in seventeen men experienced partner violence.
  •  One in two women and one in four men had experienced sexual harassment.
  •  One in six women and one in ten men experienced abuse before age of 15.

Key findings

This release presents information from the Australian Bureau of Statistics’ (ABS) 2016 Personal Safety Survey (PSS).

The survey collected information from men and women aged 18 years and over about the nature and extent of violence experienced since the age of 15. It also collected detailed information about men's and women's experience of:

  • current and previous partner violence and emotional abuse since the age of 15
  • stalking since the age of 15
  • physical and sexual abuse before the age of 15
  • witnessing violence between a parent and partner before the age of 15
  • lifetime experience of sexual harassment
  • general feelings of safety.
     

Experiences of violence

Prevalence of violence since the age of 15

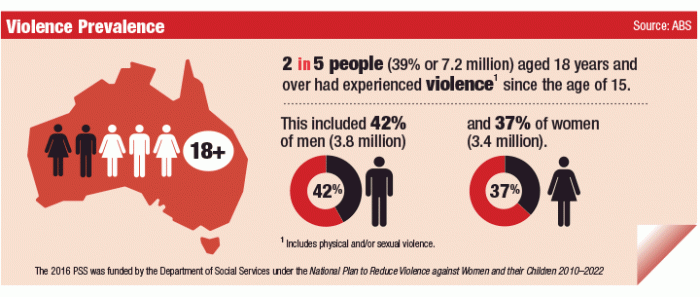
Infographic: violence prevalence
Two in five people (39% or 7.2 million) aged 18 years and over had experienced violence since the age of 15. This included 42% of men (3.8 million) and 37% of women (3.4 million).

Two in five people (39% or 7.2 million) aged 18 years and over experienced an incident of physical or sexual violence since the age of 15, including 42% of men (3.8 million) and 37% of women (3.4 million).

Four in ten men (41% or 3.7 million) and three in ten women (31% or 2.9 million) experienced physical violence.

One in five women (18% or 1.7 million) and one in twenty men (4.7% or 428,800) experienced sexual violence.

For a definition of violence see Endnote 1.

Changes in violence prevalence rates over time

The proportion of Australians experiencing violence in the last 12 months, has declined over the last decade, decreasing from 8.3% in 2005 to 5.4% in 2016. This decline was driven by a drop in experiences of physical violence, falling from 7.5% in 2005 to 4.5% in 2016.

For men the proportion experiencing physical violence in the last 12 months has almost halved since 2005, decreasing from 10% in 2005 to 5.4% in 2016. For women, the proportion has fallen from 4.7% in 2005 to 3.5% in 2016.

Over a shorter time period, since 2012, the proportion of men experiencing physical violence in the last 12 months decreased, falling from 8.5% in 2012 to 5.4% in 2016. The proportion of women experiencing physical violence in the last 12 months decreased from 4.6% in 2012 to 3.5% in 2016.

The proportion of women experiencing sexual violence in the last 12 months has remained steady between 2005 and 2016 (1.6% in 2005 compared to 1.8% in 2016). However since 2012, there has been an increase, from 1.2% in 2012 to 1.8% in 2016.

Prevalence of violence since the age of 15 - relationship to perpetrator

More than one in three Australians experienced violence by a male perpetrator since the age of 15 (36% or 6.7 million), compared to one in ten by a female perpetrator (11% or 2 million).

Approximately one in four women (23% or 2.2 million) experienced violence by an intimate partner, compared to one in thirteen men (7.8% or 703,700). Endnote 2

More than one in four men (27% or 2.5 million) experienced violence by a stranger, compared to one in eleven women (9.4% or 880,800).

Most recent incident of violence experienced since the age of 15

Detailed information was collected on the most recent incident for some types of violence, but only if the incident occurred less than 10 years prior to the survey.

Men’s and women’s most recent incident of physical assault by a male

  • In the most recent incident of physical assault by a male, men were most likely to be physically assaulted by a male stranger (66% or 873,100).
  • The location of the incident was most likely to be either a place of entertainment or recreation venue (28% or 370,700) or an outside location (28% or 370,500).
  • In the most recent incident of physical assault by a male, women were most likely to be physically assaulted by a male that they knew (92% or 977,600).
  • The location of the most recent incident was most likely to be in their home (65% or 689,800).
  • Two-thirds of men and women who experienced physical assault by a male did not report the most recent incident to police (69% or 908,100 for men and 69% or 734,500 for women).
     

Men’s and women’s most recent incident of physical assault by a female

  • For both men and women who were physically assaulted by a female, the most common location where the most recent incident occurred was in their home (55% or 286,200 for men and 30% or 98,700 for women).
     

Women’s most recent incident of sexual assault by a male

  • In the most recent incident of sexual assault by a male, women were most likely to experience sexual assault by a male they knew (87% or 553,700).
  • The location of the most recent incident was most likely to be in the respondent’s home (40% or 252,400) or in the perpetrator’s home (17% or 109,400).
  • The majority of women (9 out of 10) did not contact the police (87% or 553,900).
     

Partner violence

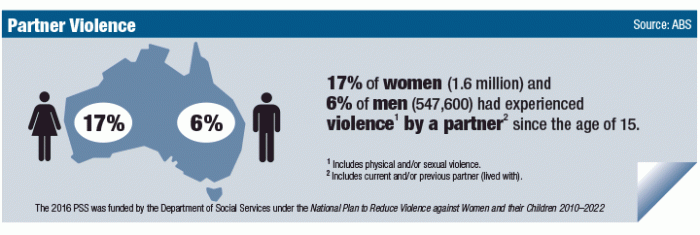
Infographic: partner violence
17% of women (1.6 million) and 6% of men (547,600) had experienced violence by a partner since the age of 15.

In-depth information about men’s and women’s experience of violence by a partner since the age of 15 was collected in the PSS. Endnote 3

  • Women were nearly three times more likely to have experienced partner violence than men, with approximately one in six women (17% or 1.6 million) and one in sixteen men (6.1% or 547,600) having experienced partner violence since the age of 15.
  • One in six women (16% or 1.5 million) and one in seventeen men (5.9% or 528,800) experienced physical violence by a partner.
  • Women were eight times more likely to experience sexual violence by a partner than men (5.1% or 480,200 women compared to 0.6% or *53,000 men).
     

* Estimate has a relative standard error of 25% to 50% and should be used with caution.

​​​​​​​Changes in partner violence prevalence rates over time

The proportion of women who experienced partner violence in the previous 12 months has remained relatively stable over the last decade. In 2005, approximately 1.5% of women aged 18 years and over experienced partner violence in the previous 12 months, whilst in 2016 the figure was 1.7%.

The proportion of men who experienced partner violence in the previous 12 months increased between 2005 and 2016. In 2005, approximately 0.4% of men aged 18 years and over experienced partner violence in the previous 12 months, whilst in 2016 the figure was 0.8%. However since the survey was last conducted in 2012, there was no significant change in the proportion of men who experienced partner violence (0.6%).

Partner emotional abuse

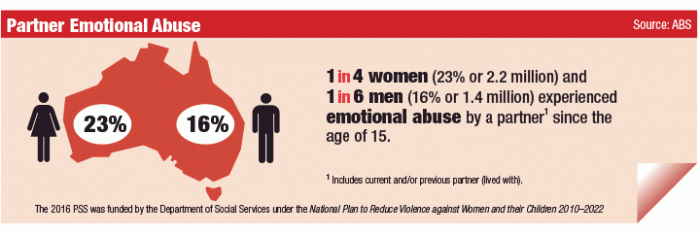
Infographic: partner emotional abuse
One in four women (23% or 2.2 million) and one in six men (16% or 1.4 million) experienced emotional abuse by a partner since the age of 15.

The 2016 PSS collected information about men’s and women’s experiences of emotional abuse by a current and/or previous partner since the age of 15. Endnote 4

  • One in four women (23% or 2.2 million) and one in six men (16% or 1.4 million) reported experiencing emotional abuse by a current and/or previous partner since the age of 15.
     

Abuse before the age of 15

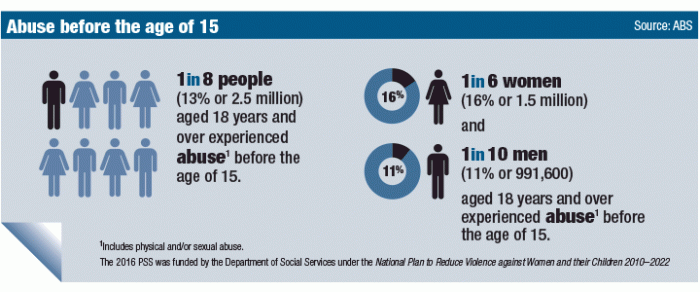
Infographic: abuse before the age of 15
One in eight people (13% or 2.5 million) aged 18 years and over experienced abuse before the age of 15. One in six women (16% or 1.5 million) and one in ten men (11% or 991,600) aged 18 years and over experienced abuse before the age of 15.

The 2016 PSS collected information about men’s and women’s experiences of physical and/or sexual abuse before the age of 15 years by any adult (male or female), including the person’s parents.

  • One in six women (16% or 1.5 million) and one in ten men (11% or 991,600) aged 18 years and over experienced abuse before the age of 15.
     

Witnessed violence before the age of 15

The 2016 PSS asked respondents if they ever heard or saw violence (physical assault) being directed at one parent by another before the age of 15.

  • One in ten men witnessed violence towards their mother by a partner before the age of 15 (10% or 896,700) and one in twenty-five men witnessed violence towards their father by a partner before the age of 15 (4% or 380,000).
  • One in eight women witnessed violence towards their mother by a partner before the age of 15 (13% or 1.2 million) and one in twenty women witnessed violence towards their father by a partner before the age of 15 (4.7% or 440,900).
     

Sexual harassment

Infographic: sexual harassment
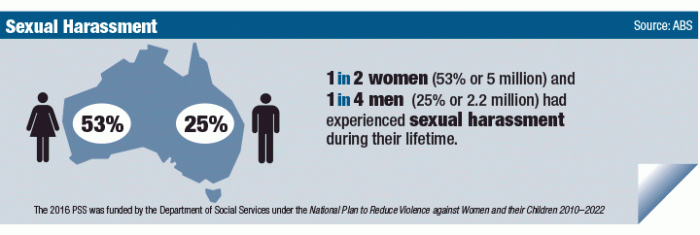
One in two women (53% or 5 million) and one in four men (25% or 2.2 million) had experienced sexual harassment during their lifetime.

The 2016 PSS collected information about men’s and women’s lifetime experiences of sexual harassment. Endnote 5

  • Two in five people (39% or 7.2 million) aged 18 years and over experienced sexual harassment during their lifetime.
  • One in two women (53% or 5 million) and one in four men (25% or 2.2 million) had experienced sexual harassment during their lifetime.
  • In the last 12 months, one in six women (17% or 1.6 million) and one in eleven men (9.3% or 836,700) experienced sexual harassment.
  • For both men and women, younger age groups were more likely than older persons to experience sexual harassment in the 12 months. Approximately 38% of women (421,400) and 16% of men (185,200) aged 18-24 years had experienced sexual harassment in the 12 months prior to the survey.
     

Changes since 2012 (endnote 6)

  • The proportion of women experiencing sexual harassment in the 12 months prior to the survey has increased from 15% in 2012 to 17% in 2016.
  • The proportion of men experiencing sexual harassment in the 12 months prior to the survey has increased from 6.6% in 2012 to 9.3% in 2016.
     

Stalking

Infographic: Stalking
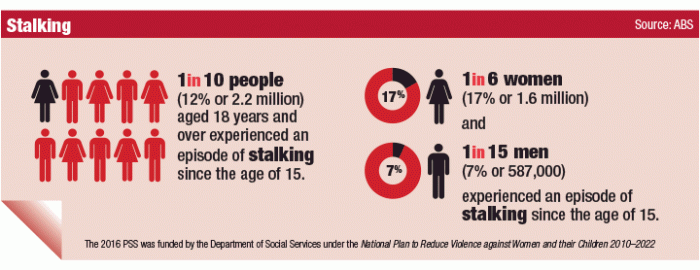
One in ten people (12% or 2.2 million) aged 18 years and over, one in six women (17% or 1.6 million) and one in fifteen men (6.5% or 587,000) experienced an episode of stalking since the age of 15.
The 2016 PSS collected information about men’s and women’s experiences of stalking since the age of 15. Endnote 7

  • The 2016 PSS found that one in six women (17% or 1.6 million) and one in fifteen men (6.5% or 587,000) experienced an episode of stalking since the age of 15.
     

Endnotes

Endnote 1

The Personal Safety Survey defines violence as any incident involving the occurrence, attempt or threat of either physical or sexual assault experienced by a person since the age of 15.

Endnote 2

The term ‘intimate partner’ is used to describe a current partner (living with), previous partner (lived with), boyfriend/girlfriend/date and ex-boyfriend/girlfriend (did not live with).

Endnote 3

The term 'partner' is used to describe a person the respondent lives with, or lived with at some point, in a married or de facto relationship.

For more information about current and previous partner definitions used in the survey refer to the Glossary in this publication.

Endnote 4

Emotional abuse occurs when a person is subjected to certain behaviours or actions that are aimed at preventing or controlling their behaviour, causing them emotional harm or fear.

Endnote 5

Sexual harassment is considered to have occurred when a person has experienced or been subjected to one or more selected behaviours which they found improper or unwanted, which made them feel uncomfortable, and were offensive due to their sexual nature.

Endnote 6

In order to accurately capture the emerging trends in experiences of sexual harassment (such as the use of information and communications technology), new sexual harassment behaviours have been specifically included in the 2016 PSS. Although these behaviours may have previously been collected as part of other categories, this should be considered when comparing sexual harassment prevalence rates between the 2012 and 2016 iterations of the survey.

Endnote 7

Stalking involves various behaviours, such as loitering and following, which the person believed were being undertaken with the intent to cause them fear or distress. To be classified as stalking more than one type of behaviour had to occur, or the same type of behaviour had to occur on more than one occasion.

Notes

For more detailed information about the definitions used in the survey refer to the Glossary in this publication.

Key findings - current state or territory of residence

This release provides information from the Australian Bureau of Statistics’ (ABS) 2016 Personal Safety Survey (PSS) for states and territories and includes data on experiences of:

  • violence
  • partner violence and partner emotional abuse
  • sexual harassment
  • feelings of general safety.
     

Where appropriate, data are presented for 2016 as well as in comparison to 2005 and/or 2012.

The PSS collects information about a person’s state or territory of usual residence at the time of interview although this is not necessarily the state or territory in which the experience took place. The reference period presented for all state and territory estimates is experiences in the 12 months prior to interview.

Although the PSS was not designed to produce estimates at the state and territory level for men, some data was able to be produced for the larger population states (New South Wales, Victoria, Queensland, South Australia and Western Australia). Care should still be used when interpreting this data. Endnote 1 For more information on Sample Design, refer to the Methodology page in the Personal Safety Survey, Australia: User Guide, 2016 (cat. no. 4906.0.55.003).

Feelings of general safety in the last 12 months

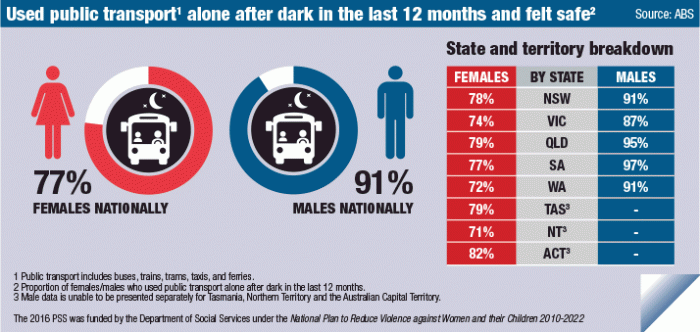
Infographic: Used public transport alone after dark in the last 12 months and felt safe, by state/territory and sex of respondent.
In Australia, 77% of women and 91% of men aged 18 years and over used public transport alone after dark in the last 12 months and felt safe. In New South Wales the proportion was 78% for women and 91% for men; in Victoria the proportion was 74% for women and 87% for men; in Queensland the proportion was 79% for women and 95% for men; in South Australia the proportion was 77% for women and 97% for men; in Western Australia the proportion was 72% for women and 91% for men; in Tasmania the proportion was 79% for women; in the Northern Territory the proportion was 71% for women; in the Australian Capital Territory the proportion was 82% for women. Male data is unable to be presented separately for Tasmania, the Northern Territory, and the Australian Capital Territory.

Women who used public transport alone after dark in the last 12 months (endnote 2)

  • In 2016, the proportion of women who felt safe using public transport alone after dark in the last 12 months across all states and territories was similar to the proportion of women who felt safe nationally (77%).
  • Between 2005 and 2016, the proportion of women who felt safe using public transport alone after dark in the last 12 months increased in New South Wales (from 67% to 78%) and Victoria (from 65% to 74%).
     

Men who used public transport alone after dark in the last 12 months (endnote 2)

  • In 2016, the proportion of men in Queensland who felt safe using public transport alone after dark in the last 12 months was higher than the proportion of men who felt safe nationally (95% compared to 91% respectively).
  • Between 2005 and 2016, the proportion of men who felt safe using transport alone after dark in the last 12 months increased in New South Wales (from 83% to 91%) and Queensland (from 88% to 95%).
     

Women who did not use public transport alone after dark in the last 12 months (endnote 3)

  • In 2016, Victoria (18%) and Western Australia (19%) had a higher proportion of women who did not use public transport alone after dark due to feeling unsafe, compared to the proportion of women who felt unsafe nationally (14%). In contrast, the proportions in Australian Capital Territory (14%), Queensland (10%) and Tasmania (7.8%) were lower than the proportion who felt unsafe nationally.
  • Between 2005 and 2016, there was a decrease in the proportion of women who did not use public transport alone after dark due to feeling unsafe in the following states:
     
    • New South Wales (from 18% to 13%)
    • Queensland (from 16% to 10%)
    • South Australia (from 21% to 13%)
    • Tasmania (from 15% to 7.8%)
    • Victoria (from 21% to 18%)
    • Western Australia (from 26% to 19%).
       

Men who did not use public transport alone after dark in the last 12 months (endnote 3)

  • In 2016, the proportion of men who did not use public transport alone after dark due to feeling unsafe was lower in Queensland compared to the proportion of men who felt unsafe nationally (1.7% compared to 2.8% respectively).
  • Between 2005 and 2016, there was a decrease in the proportion of men who did not use public transport alone after dark due to feeling unsafe in New South Wales and Queensland:
     
    • New South Wales (from 4.5% to 2.9%)
    • Queensland (from 3.7% to 1.7%).
       

Experience of violence in the last 12 months (endnote 4)

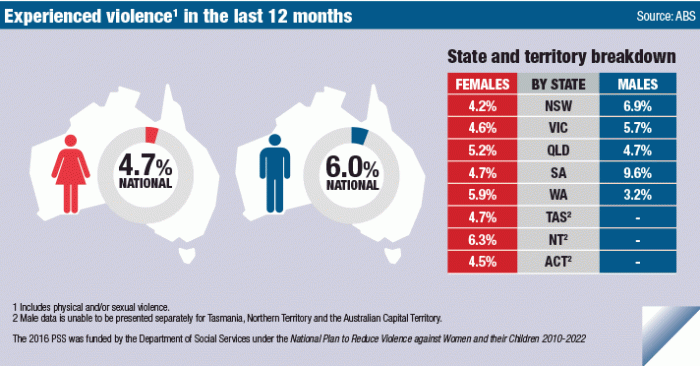
Infographic: Experienced violence in the last 12 months, by state/territory and sex of respondent.
In Australia, 4.7% of women and 6.0% of men aged 18 years and over experienced violence in the last 12 months. This included 4.2% of women and 6.9% of men in New South Wales; 4.6% of women and 5.7% of men in Victoria; 5.2% of women and 4.7% of men in Queensland; 4.7% of women and 9.6% of men in South Australia; 5.9% of women and 3.2% of men in Western Australia; 4.7% of women in Tasmania; 6.3% of women in the Northern Territory; and 4.5% of women in the Australian Capital Territory. Male data is unable to be presented separately for Tasmania, the Northern Territory, and the Australian Capital Territory.

Women’s experience of violence in the last 12 months

  • In 2016, women in the Northern Territory experienced higher rates of violence in the last 12 months compared to the national rate (6.3% compared to 4.7% nationally).
  • Since 2005, the proportion of women who experienced violence in the last 12 months remained steady across all states and territories, except in Victoria which declined from 6.5% to 4.6%.
     

Men’s experience of violence in the last 12 months

  • In 2016, across states where data is available, men in Western Australia experienced a lower rate of violence in the last 12 months compared to the national rate (3.2% compared to 6.0% respectively).
  • Since 2005, where data is available, all states expect South Australia had a decline in the proportion of men experiencing violence in the last 12 months:
     
    • New South Wales (10% in 2005 to 6.9% in 2016)
    • Victoria (11% in 2005 to 5.7% in 2016)
    • Queensland (12% in 2005 to 4.7% in 2016)
    • Western Australia (11% in 2005 to 3.2% in 2016).
       

Experience of partner violence in the last 12 months (endnote 5)

Women’s experience of partner violence in the last 12 months

  • In 2016, across all states and territories the proportion of women who experienced partner violence in the last 12 months was similar to the national rate (1.7%).
  • Between 2005 and 2016, the proportion of women experiencing partner violence in the last 12 months remained stable across all states and territories.
     

Experience of emotional abuse by a partner in the last 12 months (endnote 5 endnote 6)

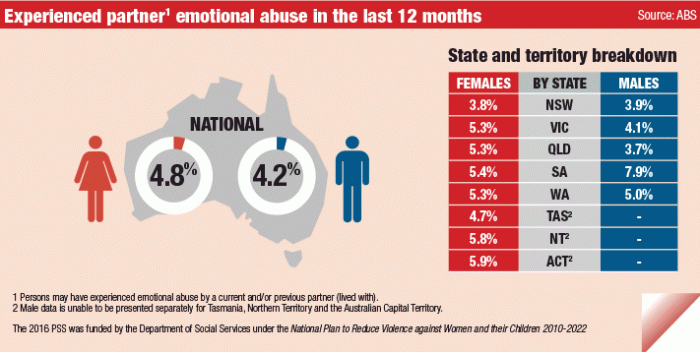
Infographic: Experienced partner emotional abuse in the last 12 months, by state/territory and sex of respondent.
In Australia, 4.8% of women and 4.2% of men experienced partner emotional abuse in the last 12 months. This included 3.8% of women and 3.9% of men in New South Wales; 5.3% of women and 4.1% of men in Victoria; 5.3% of women and 3.7% of men in Queensland; 5.4% of women and 7.9% of men in South Australia; 5.3% of women and 5.0% of men in Western Australia; 4.7% of women in Tasmania; 5.8% of women in the Northern Territory; and 5.9% of women in the Australian Capital Territory. Male data is unable to be presented separately for Tasmania, the Northern Territory, and the Australian Capital Territory.

Women’s experience of emotional abuse by a partner in the last 12 months

  • In 2016, across all states and territories, the proportion of women who experienced emotional abuse by a partner in the last 12 months was similar to the national rate (4.8%).
  • Between 2012 and 2016, the proportion of women who experienced emotional abuse by a partner in the last 12 months remained steady in most states and territories, except Western Australia, where it increased from 3.3% in 2012 to 5.3% in 2016.
     

Men’s experience of emotional abuse by a partner in the last 12 months

  • In 2016, across states where data is available, the proportion of men who experienced emotional abuse by a partner in the last 12 months was similar to the national rate (4.2%).
  • Since 2012, New South Wales saw an increase in the proportion of men who experienced emotional abuse by a partner in the last 12 months (from 2.4% in 2012 to 3.9% in 2016).
     

Experience of sexual harassment in the last 12 months (endnote 7)

Infographic: Experienced sexual harassment in the last 12 months, by state/territory and sex of respondent.
In Australia, 17% of women and 9% of men experienced sexual harassment in the last 12 months. This included 15% of women and 9% of men in New South Wales; 20% of women and 10% of men in Victoria; 17% of women and 9% of men in Queensland; 15 % of women and 13% of men in South Australia; 17% of women and 11% of men in Western Australia; 17% of women in Tasmania; 22% of women in the Northern Territory; and 19% of women in the Australian Capital Territory. Male data is unable to be presented separately for Tasmania, the Northern Territory, and the Australian Capital Territory.

Women’s experience of sexual harassment in the last 12 months

  • In 2016, the Northern Territory (22%) and Victoria (20%) had a higher proportion of women who experienced sexual harassment in the last 12 months compared to the national rate (17%). The proportion of women who experienced sexual harassment in the last 12 months was lower in South Australia (15%) compared to the national rate.
  • Since 2012, the proportion of women who experienced sexual harassment in the last 12 months remained steady across all states and territories, except for Victoria where there was an increase from 14% in 2012 to 20% in 2016. (Endnote 8)
     

Men’s experience of sexual harassment in the last 12 months

  • In 2016, across the states where data is available, the proportion of men who experienced sexual harassment in the last 12 months was similar to the national rate (9.3%).
  • Since 2012, New South Wales and South Australia saw an increase in the proportion of men experiencing sexual harassment in the last 12 months:
     
    • New South Wales (5.4% in 2012 to 8.8% in 2016)
    • South Australia (6.2% in 2012 to 13% in 2016). Endnote 9
       

Endnotes

Endnote 1

While data for men has been produced for the larger population states (New South Wales, Victoria, Queensland, South Australia and Western Australia), the reliability of this data may vary, and users should remain aware of RSEs and/or MoEs when interpreting this data.

Endnote 2

Proportions of women/men who used public transport alone after dark in the last 12 months. Public transport includes buses, trains, trams, taxis, and ferries.

Endnote 3

Proportions of all women/men.

Endnote 4

Violence includes any incident involving the occurrence, attempt or threat of either physical or sexual assault experienced by a person in the 12 months prior to the survey.

Endnote 5

The term 'partner' is used to describe a person the respondent lives with, or lived with at some point, in a married or de facto relationship.

Endnote 6

Emotional abuse occurs when a person is subjected to certain behaviours or actions that are aimed at preventing or controlling their behaviour, causing them emotional harm or fear.

Endnote 7

Sexual harassment is considered to have occurred when a person has experienced or been subjected to one or more selected behaviours which they found improper or unwanted, which made them feel uncomfortable, and were offensive due to their sexual nature.

Endnote 8

In order to accurately capture emerging trends in experiences of partner emotional abuse (such as the use of information and communication technology), new partner emotional abuse behaviours have been specifically included in the 2016 PSS. Although these behaviours have been previously collected as part of other categories, this should be considered when comparing partner emotional abuse prevalence rates between 2012 and 2016 iterations of the survey.

Endnote 9

In order to accurately capture the emerging trends in experiences of sexual harassment (such as the use of information and communications technology), new sexual harassment behaviours have been specifically included in the 2016 PSS. Although these behaviours may have previously been collected as part of other categories, this should be considered when comparing sexual harassment prevalence rates between the 2012 and 2016 iterations of the survey.

For more detailed information about the definitions used in the survey refer to the Glossary in this publication.

Experience of violence

This chapter provides an overview of men’s and women’s experience of violence in the 12 months prior to the survey and since the age of 15. This includes changes in prevalence rates over time, demographic information about persons who experienced violence, and the relationship of the respondent to the perpetrator(s).

What types of violence are included in the Personal Safety Survey?

The Personal Safety Survey defines violence as any incident involving the occurrence, attempt or threat of either physical or sexual assault experienced by a person since the age of 15.

Violence can be broken down into two main categories, physical violence and sexual violence.

Physical violence: is defined as the occurrence, attempt or threat of physical assault experienced by a person since the age of 15. There are two components of physical violence:

  • Physical assault: any incident that involved the use of physical force with the intent to harm or frighten a person.
  • Physical threat: any attempt to inflict physical harm, or a threat or suggestions of intent to inflict physical harm, which was made face-to-face and which the person believed was able and likely to be carried out.
     

Sexual violence: is defined as the occurrence, attempt or threat of sexual assault experienced by a person since the age of 15. There are two components of sexual violence:

  • Sexual assault: an act of a sexual nature carried out against a person's will through the use of physical force, intimidation or coercion, including any attempts to do this. This includes rape, attempted rape, aggravated sexual assault (assault with a weapon), indecent assault, penetration by objects, forced sexual activity that did not end in penetration and attempts to force a person into sexual activity. Incidents so defined would be an offence under state and territory criminal law.
  • Sexual threat: the threat of acts of a sexual nature that were made face-to-face where the person believed it was able to and likely to be carried out.
     

Respondents are asked if they have ever experienced physical assault, physical threat, sexual assault and sexual threat by a man and/or a woman, resulting in eight sub-categories of violence.

Breakdown of violence types collected in the PSS

PSS 2016 Tree Diagram Breakdown of violence types collected in the PSS
The types of violence shown in the diagram include physical violence and sexual violence. Physical violence is broken down into physical assault and physical threat, which are further broken down by the sex of the perpetrator, including physical assault by a male, physical assault by a female, physical threat by a male, and physical threat by a female. Similarly, sexual violence is broken down into sexual assault and sexual threat, which are further broken down by the sex of the perpetrator, including sexual assault by a male, sexual assault by a female, sexual threat by a male, and sexual threat by a female.

Additionally, the PSS asked respondents about their experiences of violence since the age of 15 by different male and female perpetrator types, including stranger, current and previous partner, boyfriend, girlfriend or date, and other known person.

Measuring multiple incidents and multiple types of violence

A key objective of the PSS is to measure the prevalence of violence in Australia. Prevalence refers to the number and proportion (rate) of persons in a given population that have experienced any type of violence within a specified timeframe.

The counting unit in the PSS is always persons and not incidents. While some basic information is collected about the frequency of partner violence, the PSS cannot determine the exact number of times a respondent has experienced violence. Instead, the PSS provides information about whether a respondent has ever experienced violence since the age of 15 by a male or female perpetrator.

Where a person has experienced more than one type of violence, they are counted separately for each type of violence they experience but are only counted once in the aggregated totals. Components therefore may not add to the totals. For example, if a person has experienced both physical assault by a stranger and an incident of physical assault by their current partner, they would be counted against each type of violence by type of perpetrator (i.e. physical assault by a stranger and physical assault by a current partner) but they would only be counted once in the total for those who had experienced physical assault.

In addition, where a single incident of violence involved more than one of the different types of violence the incident of violence is only counted once. For example, if a person is physically assaulted during or as part of a sexual assault, this would be counted once only as a sexual assault. The primary type of violence for the incident is based on the ordering of the questionnaire and the perception of the respondent. Incidents of sexual assault and threat were asked before physical assault and threat with the latter questions asking respondents not to re-report any incidents already mentioned.

For more details, refer to the Violence - Prevalence page in the Personal Safety Survey, Australia: User Guide, 2016 (cat. no. 4906.0.55.003).

Prevalence of violence in the last 12 months

In 2016, an estimated 5.4% of persons aged 18 years and over (989,500) experienced violence in the 12 months prior to the survey. Men were more likely than women to experience violence. An estimated 6% of men (543,900) reported experiencing violence in the 12 months prior to the survey, compared to 4.7% of women (444,700). Refer to Table 1.

Men's experience of violence, in the last 12 months

PSS 2016 tree diagram men's experience of violence, in the last 12 months
All men = 9,027,600 (100%). Men who did not experience violence = 8,483,600 (94.0%). Men who experienced violence = 543,900 (6.0%). Physical violence = 485,400 (5.4%). Sexual violence = *62,700 (0.7%). Physical assault = 309,400 (3.4%). Physical threat = 256,600 (2.8%). Sexual assault = 57,200 (0.6%). Sexual threat = **15,100 (0.2%).

* Estimate has a relative standard error of 25% to 50% and should be used with caution.
** Estimate has a relative standard error of greater than 50% and is considered too unreliable for general use.

  1. Due to rounding and the effect of perturbation the sum of components may not add to the total. For more details, refer to Endnote 1.
  2. People may have experienced multiple types of violence. Components therefore may not add to the totals.

Women's experience of violence, in the last 12 months

PSS 2016 tree diagram women's experience of violence, in the last 12 months
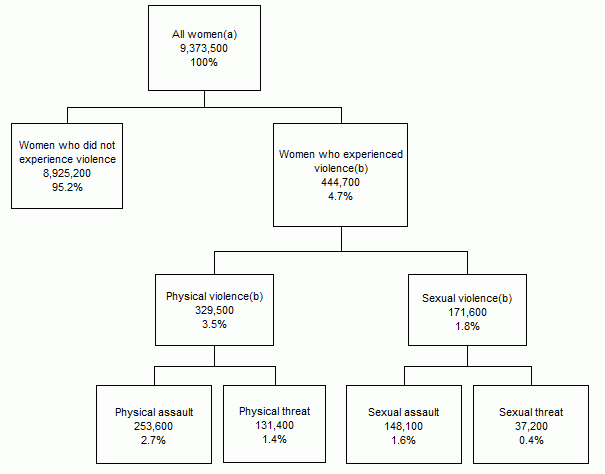
All women = 9,373,500 (1005). Women who did not experience violence = 8,925,200 (95.2%). Women who experienced violence = 444,700 (4.7%). Physical violence = 329,500 (3.5%). Sexual violence = 171,600 (1.8%). Physical assault = 253,600 (2.7%). Physical threat = 131,400 (1.4%). Sexual assault = 148,100 (1.6%). Sexual threat = 37,200 (0.4%).
  1. Due to rounding and the effect of perturbation the sum of sub-totals may not add to the total. For more details, refer to Endnote 1.
  2. People may have experienced multiple types of violence. Components therefore may not add to the totals.

For both men and women who experienced violence in the 12 months prior to the survey, physical violence was more common than sexual violence. However the likelihood of experiencing these types of violence differed by sex:

  • Men were more likely to experience physical violence than women. In 2016 it was estimated that 5.4% of men (485,400) experienced physical violence in the 12 months prior to the survey compared to 3.5% of women (329,500).
  • Women were more likely to experience sexual violence than men. In 2016 it was estimated that 1.8% of women (171,600) experienced sexual violence in the 12 months prior to the survey compared to less than 1% of men (*62,700).

    * Estimate has a relative standard error of 25% to 50% and should be used with caution.
  1. Includes physical assault and/or physical threat.
  2. Includes sexual assault and/or sexual threat.
  3. Includes physical violence and/or sexual violence.
  4. People may have experienced multiple types of violence. Components therefore may not add to the totals.

Endnotes

Endnote 1

To minimise the risk of identifying individuals in aggregate statistics, perturbation has been applied. Perturbation involves a small random adjustment of the statistics and is considered the most satisfactory technique for avoiding the release of identifiable statistics while maximising the range of information that can be released. However as a result, these random adjustments of estimates may result in the sum of components not equalling the total or subtotal. For more details, refer to the Methodology page of this publication.

Prevalence of violence since the age of 15

It was estimated that nearly two in five people (39% or 7.2 million) aged 18 years and over had experienced violence since the age of 15. This included 42% of men (3.8 million) and 37% of women (3.4 million). Refer to Table 3.

Men's experience of violence, since the age of 15

PSS 2016 tree diagram men's experience of violence, since the age of 15
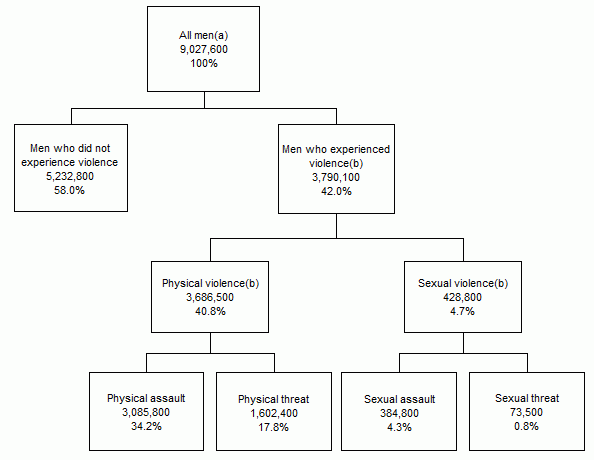
All men = 9,027,600 (100%). Men who did not experience violence = 5,232,800 (58.0%). Men who experienced violence = 3,790,100 (42.0%). Physical violence = 3,686,500 (40.8%). Sexual violence = 428,800 (4.7%). Physical assault = 3,085,800 (34.2%). Physical threat = 1,602,400 (17.8%). Sexual assault = 384,800 (4.3%). Sexual threat = 73,500 (0.8%).
  1. Due to rounding and the effect of perturbation the sum of sub-totals may not add to the total. For more details, refer to Endnote 1.
  2. People may have experienced multiple types of violence. Components therefore may not add to the totals.

Women's experience of violence, since the age of 15

PSS 2016 tree diagram women's experience of violence, since the age of 15
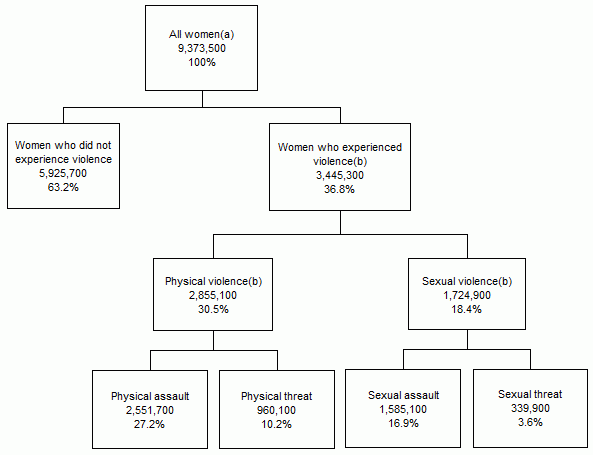
All women = 9,373,500 (100%). Women who did not experience violence = 5,925,700 (63.2%). Women who experienced violence = 3,445,300 (36.8%). Physical violence = 2,855,100 (30.5%). Sexual violence = 1,724,900 (18.4%). Physical assault = 2,551,700 (27.2%). Physical threat = 960,100 (10.2%). Sexual assault = 1,585,100 (16.9%). Sexual threat = 339,900 (3.6%).
  1. Due to rounding and the effect of perturbation the sum of sub-totals may not add to the total. For more details, refer to Endnote 1.
  2. People may have experienced multiple types of violence. Components therefore may not add to the totals.
     

Both men and women were more likely to have experienced physical violence since the age of 15 than sexual violence. However the likelihood of experiencing these types of violence differed by sex.

Men were more likely than women to have experienced physical violence since the age of 15:

  • Four in ten men (41% or 3.7 million) had experienced physical violence, with physical assault experienced by over a third of men (34% or 3.1 million) and physical threat experienced by 18% (1.6 million).
  • Three in ten women (31% or 2.9 million) had experienced physical violence, with physical assault experienced by over a quarter of women (27% or 2.6 million) and physical threat experienced by 10% (960,100).
     

Women were more likely than men to have experienced sexual violence since the age of 15:

  • Almost one in five women had experienced sexual violence (18% or 1.7 million), with sexual assault experienced by 17% (1.6 million) and sexual threat experienced by 4% (339,900).
  • Almost one in twenty men experienced sexual violence (4.7% or 428,800), with sexual assault experienced by 4.3% (384,800) and sexual threat experienced by less than 1% (73,500).
     
  1. Includes physical assault and/or physical threat.
  2. Includes sexual assault and/or sexual threat.
  3. Includes physical violence and/or sexual violence.
  4. People may have experienced multiple types of violence. Components therefore may not add to the totals.

Endnotes

Endnote 1

To minimise the risk of identifying individuals in aggregate statistics, perturbation has been applied. Perturbation involves a small random adjustment of the statistics and is considered the most satisfactory technique for avoiding the release of identifiable statistics while maximising the range of information that can be released. However as a result, these random adjustments of estimates may result in the sum of components not equalling the total or subtotal. For more details, refer to the Methodology of this publication.

Prevalence of violence over time

The PSS has previously been conducted in 2012 and 2005. For more information on comparability of prevalence of violence data over time, refer to the Violence - Prevalence page in the Personal Safety Survey, Australia: User Guide, 2016 (cat. no. 4906.0.55.003).

Changes between 2005 and 2016

The proportion of Australians experiencing violence in the 12 months prior to interview has declined over the last decade, decreasing from 8.3% in 2005 to 5.4% in 2016. This decline was driven by a drop in experiences of physical violence, falling from 7.5% in 2005 to 4.5% in 2016.

For men, the proportion experiencing physical violence in the last 12 months has almost halved since 2005, decreasing from 10% in 2005 to 5.4% in 2016. For women, the proportion has fallen from 4.7% in 2005 to 3.5% in 2016.

Between 2005 and 2016, the proportion of Australians experiencing sexual violence in the last 12 months has remained steady. In 2005, an estimated 1.6% of women experienced sexual violence, compared to 1.8% in 2016. For men, the proportion experiencing sexual violence over this time period was also steady (0.6% in 2005 compared to 0.7% in 2016).

Refer to Table 2.

Changes between 2012 and 2016

Between 2012 and 2016, there was a significant decrease in the proportion of men who experienced violence in the 12 months prior to interview. In 2012, an estimated 8.7% of men experienced violence in the 12 months prior to interview, compared to 6% in 2016. This decrease was driven by a decline in the proportion of men who experienced physical violence, from 8.5% in 2012 to 5.4% in 2016. The proportion of men who experienced sexual violence was steady over the same time period (0.5% in 2012 compared to 0.7% in 2016). Refer to Table 2.

  1. Includes physical assault and/or physical threat.
  2. Includes sexual assault and/or sexual threat.
  3. Includes physical violence and/or sexual violence.
  4. People may have experienced multiple types of violence. Components therefore may not add to the totals.

Between 2012 and 2016 the proportion of women who experienced violence in the 12 months prior to interview remained steady. In 2012, an estimated 5.3% of women experienced violence in the 12 months prior to the survey compared to 4.7% in 2016.

For physical violence, the proportion of women fell from 4.6% in 2012 to 3.5% in 2016. Between 2012 and 2016 there was an increase in the proportion of women who experienced sexual violence in the 12 months prior to the survey. In 2012, an estimated 1.2% of women experienced sexual violence, compared to 1.8% in 2016.

  1. Includes physical assault and/or physical threat.
  2. Includes sexual assault and/or sexual threat.
  3. Includes physical violence and/or sexual violence.
  4. People may have experienced multiple types of violence. Components therefore may not add to the totals.

Women's experience of violence over time - current state or territory of residence

The PSS has previously been conducted in 2012 and 2005. For more information on comparability of prevalence of violence data over time, refer to the Violence Prevalence page in the Personal Safety Survey, Australia: User Guide, 2016 (cat. no. 4906.0.55.003).

This section discusses comparisons of change in key violence estimates from previous survey periods for each state and territory. The reference period presented for all state and territory estimates is experiences of violence in the 12 months prior to the survey.

The PSS collects information about a person’s state or territory of usual residence at the time of the survey although this is not necessarily the state or territory in which the violence took place.

Prevalence of violence over time

Between 2005 and 2016, the proportion of women experiencing violence in the last 12 months remained steady across all states and territories, except in Victoria where there was a decline from 6.5% in 2005 to 4.6% in 2016. Refer to Table 2 of the State and Territory Tables.

Between 2012 and 2016, the proportion of women experiencing violence in the last 12 months also remained stable across all states and territories, except in the Australian Capital Territory where there was a decline from 6.3% in 2012 to 4.5% in 2016.

  1. Violence includes sexual violence and/or physical violence.

Prevalence of physical violence over time

Over the last decade, the proportion of women who experienced physical violence in the last 12 months remained steady across most states and territories, except in Victoria where there was a decline from 5.3% in 2005 to 3.3% in 2016. Refer to Table 2 of the State and Territory Tables.

Between 2012 and 2016, the proportion of women who experienced physical violence in the last 12 months remained stable in most states and territories except Western Australia and the Northern Territory where there were decreases:

  • Western Australia ( 6.2% in 2012 to 4.2% in 2016)
  • Northern Territory (7.3% in 2012 to 4.9% in 2016).
     
  1. Physical violence includes physical assault and/or physical threat.

Prevalence of sexual violence over time

Between 2005 and 2016, the proportion of women experiencing sexual violence in the last 12 months remained steady across all states and territories. Refer to Table 2 of the State and Territory Tables.

Between 2012 and 2016, the proportion of women experiencing sexual violence in the last 12 months also remained steady for most states and territories, except in Victoria and the Australian Capital Territory:

  • Victoria increased from 0.8% in 2012 to 2.2% in 2016
  • Australian Capital Territory decreased from 2.3% in 2012 to 1.2% in 2016.
     

Men's experience of violence over time - current state or territory of residence

The PSS collects information about a person’s state or territory of usual residence at the time of interview although this is not necessarily the state or territory in which the violence took place.

The PSS was not designed to produce violence prevalence data at the state and territory level for men, however, some data was able to be produced for the larger population states (New South Wales, Victoria, Queensland, South Australia and Western Australia). Care should still be used when interpreting this data. Endnote 1 For more information on Sample Design, refer to the Methodology page in the Personal Safety Survey, Australia: User Guide, 2016(cat. no. 4906.0.55.003).

This section discusses comparisons of change in key violence estimates from previous survey periods for selected states. The reference period presented for all state and territory estimates is experiences in the 12 months prior to interview.

Prevalence of violence over time

Over the last decade, where state data is available, all states except South Australia saw a decline in the proportion of men experiencing violence in the 12 months prior to interview:

  • New South Wales (10% in 2005 to 6.9% in 2016)
  • Victoria (11% in 2005 to 5.7% in 2016)
  • Queensland (12% in 2005 to 4.7% in 2016)
  • Western Australia (11% in 2005 to 3.2% in 2016).
     

Between 2012 and 2016, the following states also saw a significant decline in men experiencing violence in the last 12 months:

  • Victoria (9.1% in 2012 to 5.7% in 2016)
  • Queensland (11% in 2012 to 4.7% in 2016)
  • Western Australia (8.6% in 2012 to 3.2% in 2016).
     

Refer to Table 2 of the State and Territory Tables.

  1. Violence includes sexual violence and/or physical violence.
  2. Whilst the PSS was not designed to produce prevalence data at the state and territory level for men, some data was able to be produced for the larger population states (New South Wales, Victoria, Queensland, South Australia and Western Australia).

Prevalence of physical violence over time

Between 2005 and 2016, where data is available, all states except South Australia had a decline in the proportion of men experiencing physical violence in the last 12 months:

  • New South Wales (10% in 2005 to 6.4% in 2016)
  • Victoria (10% in 2005 to 5.0% in 2016)
  • Queensland (12% in 2005 to 4.6% in 2016)
  • Western Australia (10% in 2005 to 2.9% in 2016).
     

Between 2012 and 2016, the proportion of men experiencing physical violence in the last 12 months decreased in the following states:

  • Victoria declined from 9.0% in 2012 to 5.0% in 2016
  • Queensland declined from 11% in 2012 to 4.6% in 2016
  • Western Australia declined from 8.6% in 2012 to 2.9% 2016.
     

Refer to Table 2 of the State and Territory Tables.

  1. Physical violence includes physical assault and/or physical threat.
  2. Whilst the PSS was not designed to produce prevalence data at the state and territory level for men, some data was able to be produced for the larger population states (New South Wales, Victoria, Queensland, South Australia and Western Australia).

Endnotes

Endnote 1

While data for men has been produced for the larger population states (New South Wales, Victoria, Queensland, South Australia and Western Australia), the reliability of this data may vary, and users should remain aware of RSEs and/or MoEs when interpreting this data.

Demographics of those who experienced violence in the last 12 months

In addition to collecting information for men and women aged 18 years and over about their experience of violence over the 12 months prior to the survey, the 2016 PSS also collected a range of information about their demographics. This included age, language, education, country of birth, disability status, and State or Territory of usual residence. The following selection of characteristics are analysed here:

  • Broad age groups
  • Disability Status, and
  • State or Territory of usual residence.
     

Refer to Tables 6 and 7.

Prevalence of violence in the last 12 months – broad age groups

For both men and women, the experience of violence in the 12 months prior to the survey differed by age group.

Compared to the overall male violence prevalence rate of 6% (543,900):

  • Men in the 18-24 years and 25-34 years age groups were more likely to have experienced violence. In 2016, an estimated 11% of men aged 18-24 years (120,400) and 9.3% of men aged 25-34 years (163,000) experienced violence in the 12 months prior to the survey.
  • Men aged 55-64 years and 65 years and over were less likely to have experienced violence. In 2016, an estimated 2.8% of men aged 55-64 years (38,600) and 1.4% of men aged 65 years and over (23,800) experienced violence in the 12 months prior to the survey.
     

Compared to the overall female violence prevalence rate of 4.7% (444,700):

  • Women in the 18-24 year age groups were the most likely to have experienced violence. In 2016, an estimated 12% of women aged 18-24 years (129,100) experienced violence in the 12 months prior to interview.
  • Women aged 65 years and over were the least likely to have experienced violence. In 2016, an estimated 1.2% of women aged 65 years and over (21,200) experienced violence in the 12 months prior to interview.
     
  1. Refers to age at time of the survey.
  2. Includes any physical and/or sexual violence experienced in the 12 months prior to the survey.

Prevalence of violence in the last 12 months by disability status

The 2016 PSS collected information to determine whether or not someone had a disability or long-term health condition at the time of the survey. For more information about how disability was defined and potential under-representation of persons with a disability in the sample, refer to the Disability page in the Personal Safety Survey, Australia: User Guide, 2016 (cat. no. 4906.0.55.003).

Women with a disability or long-term health condition were more likely to have experienced violence than women without a disability or long-term health condition. In 2016, an estimated 5.9% (172,800) of women with a disability or long-term health condition experienced violence in the 12 months prior to the survey, compared to 4.3% (274,400) of those with no disability or long-term health condition.

The proportion of men who experienced violence in the 12 months prior to the survey was similar for men with a disability or long-term health condition (5.6% or 158,100) and men without a disability or long-term health condition (6.2% or 383,200).

  1. Refers to disability status at the time of the survey.
  2. Includes any physical and/or sexual violence experienced in the 12 months prior to the survey.
  3. A person was defined as having a disability or long-term health condition if they had one or more conditions which had lasted, or were likely to last, for six months or more, and that restricted every day activities. For further information, refer to the Glossary.

Prevalence of violence in the last 12 months - current state or territory of residence

The PSS collects information about a person’s state or territory of usual residence. Note that this is not necessarily the state or territory in which the violence took place.

For women, the Northern Territory was the only jurisdiction where the proportion of women who had experienced violence during the last 12 months differed from the national estimate. In 2016, an estimated 6.3% of women in the Northern Territory (4,300) experienced violence in the 12 months prior to the survey, compared to the national estimate for women of 4.7% (444,700). Refer to Table 6.

Although the PSS was not designed to produce violence prevalence data at the state/territory level for men, some data was able to be produced for the larger states (for more information on Sample Design refer to the Methodology page in the Personal Safety Survey, Australia: User Guide, 2016 (cat. no. 4906.0.55.003)). There was no statistically significant difference in the prevalence of violence for men in New South Wales (6.9%), Victoria (5.7%) and Queensland (4.7%), when compared to the national estimate (6%). Endnote 1 Refer to Table 7.

Endnotes

Endnote 1

All comparisons made in this publication are tested to see whether or not the differences are statistically significant. For more information on significance testing, refer to the Technical Note page of this publication.

Perpetrators of violence (since the age of 15)

The 2016 PSS collected information from men and women aged 18 years and over about their experience of violence since the age of 15 by different types of male and female perpetrators.

Perpetrator types include current partner, previous partner, boyfriend/girlfriend or date, other known man/woman and stranger. Refer to the Glossary for definitions of perpetrator types.

This section analyses men’s and women’s experience of physical, sexual and total violence since the age of 15 by main perpetrator types. For more detailed information refer to Tables 3 and 4.

For more detailed information about current and previous partner violence refer to the Experience of Partner Violence page of this publication.

Prevalence of violence since the age of 15 – relationship to perpetrator

Violence by a stranger since the age of 15

Men were approximately three times as likely as women to have experienced violence by a stranger. Over one in four men (27% or 2.5 million) experienced violence by a stranger, compared to almost one in ten women (9.4% or 880,800).

Violence by a current partner since the age of 15

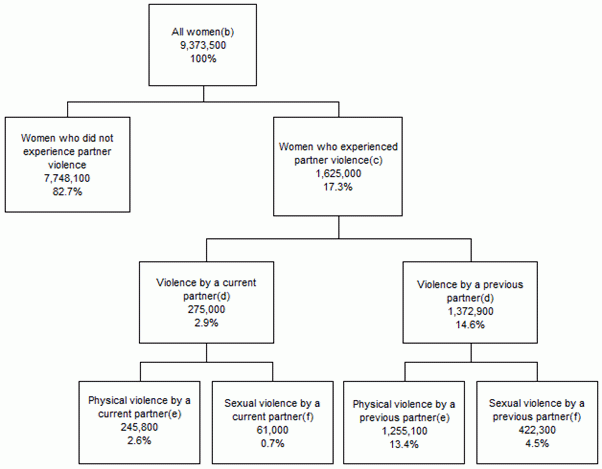
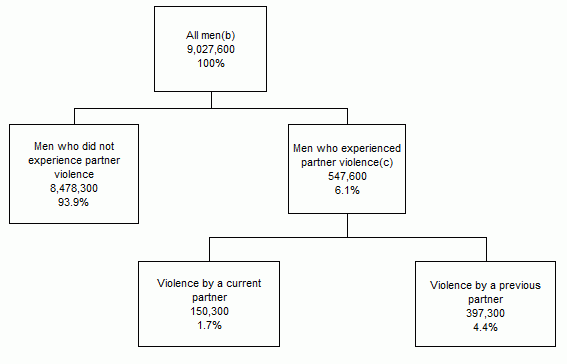
Women were more likely than men to have experienced violence by a current partner. An estimated 2.9% of women (275,000) experienced violence by a current partner, compared to 1.7% of men (150,300).

Violence by a previous partner since the age of 15

Women were more than three times as likely as men to have experienced violence by a previous partner. Just over one in seven women (15% or 1.4 million) experienced violence by a previous partner, compared to almost one in twenty men (4.4% or 397,300).

Violence by a boyfriend/girlfriend/date since the age of 15

Women were nearly four times as likely as men to have experienced violence by a boyfriend, girlfriend or date. About 7.4% of women (694,200) experienced violence by a boyfriend/girlfriend/date, compared to 1.9% of men (174,000).

Violence by other known person(s) since the age of 15

Men and women were equally likely to have experienced violence by an other known person (20% or 1.8 million for both males and females). The most common perpetrator type in this category was acquaintance or neighbour, for both men (7.4% or 666,900) and women (7% or 653,800).

Prevalence of violence since the age of 15 - relationship to perpetrator by type of violence

Note: Where a person has experienced violence by more than one perpetrator type or experienced violence by the same perpetrator type for more than one type of violence (e.g. physical assault and sexual assault), they are counted separately for each type of perpetrator or violence but are only counted once in the aggregated totals. Components therefore may not add to the totals and cannot be summed to produce totals where they are not presented. For more detailed information refer to Tables 3 and 4.

For example:

  • if a person has experienced physical violence by an intimate partner and an other known person, they would be counted against each perpetrator (ie. physical violence by an intimate partner and physical violence by an other known person) but they would only be counted once in the total for those who had experienced physical violence.
  • if a person has experienced physical violence by stranger and sexual violence by a stranger, they would be counted against each type of violence by perpetrator (ie. physical violence by a stranger and sexual violence by a stranger) but they would only be counted once for those who had experienced violence by a stranger.
     

Men's experience of violence since the age of 15 by type of violence and relationship to perpetrator

Physical violence

Men were more likely to have experienced physical violence by a stranger than a known person. An estimated 27% of men (2.4 million) experienced physical violence by a stranger compared with 23% of men (2.1 million) who experienced physical violence by a known person. Men who experienced physical violence by a known person most commonly reported that the perpetrator was an acquaintance or neighbour (6.9% or 627,100), followed by a previous partner (4.2% or 383,000), and friend or housemate (4.2% or 380,500).

Sexual violence

Men were more likely to have experienced sexual violence since the age of 15 by a known person than a stranger. An estimated 3.7% of men (330,300) had experienced sexual violence by a known person, compared to 1.4% (128,300) who had experienced sexual violence by a stranger.

  1. Types of violence experienced since the age of 15.
  2. People may have experienced violence by more than one perpetrator type or more than one type of violence by the same perpetrator type. Therefore components cannot be summed to obtain totals.
  3. Includes physical assault and/or physical threat.
  4. Includes sexual assault and/or sexual threat.
  5. Includes current partner, previous partner (lived with), boyfriend/girlfriend or date and ex-boyfriend/girlfriend.

Women's experience of violence since the age of 15 by type of violence and relationship of perpetrator

Physical violence

Women were more likely to have experienced physical violence by a known person than a stranger. More than one in four women (27% or 2.6 million) had experienced physical violence by a known person, compared to 6% of women (561,700) who experienced physical violence by a stranger.

Nearly one in five women (19% or 1.8 million) had experienced physical violence by an intimate partner, with the most commonly reported perpetrator being a previous partner (13% or 1.3 million).

Sexual violence

Women were also more likely to have experienced sexual violence since the age of 15 by a known person than a stranger. Approximately one in six women (16% or 1.5 million) had experienced sexual violence by a known person, compared to 4.6% (433,300) who had experienced sexual violence by a stranger.

An estimated 9.2% of women (864,000) had experienced sexual violence by an intimate partner, the most commonly reported being a previous partner (4.5% or 422,300), and a boyfriend/girlfriend or date (4.3% or 399,000).

  1. Types of violence experienced since the age of 15.
  2. People may have experienced violence by more than one perpetrator type or more than one type of violence by the same perpetrator type. Therefore components cannot be summed to obtain totals.
  3. Includes physical assault and/or physical threat.
  4. Includes sexual assault and/or sexual threat.
  5. Includes current partner, previous partner (lived with), boyfriend/girlfriend or date and ex-boyfriend/girlfriend.

Prevalence of violence since the age of 15 - relationship to perpetrator by sex of perpetrator

Both men and women were more likely to have experienced violence since the age of 15 by a male perpetrator than a female perpetrator:

  • Nearly two in five men (39% or 3.5 million) experienced violence by a male perpetrator, compared to around one in eight (12% or 1.1 million) who experienced violence by a female perpetrator.
  • Just over one in three women (34% or 3.2 million) experienced violence by a male perpetrator, compared to almost one in ten (9.2% or 866,500) who experienced violence by a female perpetrator.
     

Note: Where a person has experienced violence by more than one type of perpetrator of the same sex (e.g. female stranger and female known person), or experienced violence by the same type of perpetrator for each sex (e.g. female known person and male known person), they are counted separately for each type of perpetrator but are only counted once in the aggregated totals. Components therefore may not add to the totals and cannot be summed to produce totals where they are not presented. For more detailed information refer to Tables 3 and 4.

For example:

  • if a person has experienced physical violence by a male stranger and a male known person, they would be counted against each perpetrator (ie. physical violence by a male stranger and physical violence by a male known person) but they would only be counted once in the total for those who had experienced physical violence by a male
  • if a person has experienced physical violence by male stranger and sexual violence by a female stranger, they would be counted against each type of violence by perpetrator (ie. physical violence by a male stranger and sexual violence by a female stranger) but they would only be counted once for those who had experienced violence by a stranger.
     

Men’s experience of violence since the age of 15 by type of violence and relationship to and sex of perpetrator

Physical violence

Men were most likely to have experienced physical violence by a male stranger. Over a quarter of men (26% or 2.4 million) had experienced physical violence by a male stranger, compared to 2.3% (205,500) who experienced physical violence by a female stranger.

Men were approximately twice as likely to have experienced physical violence by a male known person (18% or 1.6 million) as by a female known person (9.4% or 849,600). An estimated 6.5% (587,900) of men experienced physical violence by a male acquaintance or neighbour. Approximately 4% (361,200) of men experienced physical violence by a female previous partner.

Sexual violence

Men were as likely to have experienced sexual violence by a male (2.4% or 219,000) as by a female (2.6% or 236,700). Men were more likely to have experienced sexual violence by a known female (2.3% or 206,000) than a known male (1.6% or 142,500). However, men were more likely to have experienced sexual violence by a male stranger (1% or 89,000) than a female stranger (less than 1% or 40,800).

  1. Types of violence experienced since the age of 15.
  2. Men may have experienced violence by more than one type of perpetrator (e.g. male and female, or known person and stranger). Men may also have experienced both physical and sexual violence. Therefore components cannot be summed to produce totals.
  3. Includes physical assault and/or physical threat.
  4. Includes sexual assault and/or sexual threat.

Women’s experience of violence since the age of 15 by type of violence and relationship to and sex of perpetrator

Physical violence

A quarter of women (25% or 2.3 million) had experienced physical violence by a male known person, compared to 6.9% (642,400) who had experienced physical violence by a female known person. Women were most likely to have experienced physical violence by a male previous partner (13% or 1.2 million).

Women were also more likely to have experienced physical violence by a male stranger than a female stranger. An estimated 4.2% of women (397,800) had experienced physical violence by a male stranger, compared to 2.4% (228,800) who experienced physical violence by a female stranger.

Sexual violence

Approximately one in six women (16% or 1.5 million) had experienced sexual violence by a male known person, compared to less than 1% (57,400) who had experienced sexual violence by a female known person. An estimated 4.5% of women (418,900) had experienced sexual violence by a male previous partner, and 4.3% (398,700) had experienced sexual violence by a boyfriend/date.

  1. Types of violence experienced since the age of 15.
  2. People may have experienced violence by more than one perpetrator type or more than one type of violence by the same perpetrator type. Therefore components cannot be summed to obtain totals.
  3. Includes physical assault and/or physical threat
  4. Includes sexual assault and/or sexual threat.

Experience of violence - most recent incident

The 2016 Personal Safety Survey (PSS) collected information from men and women aged 18 years and over on some characteristics of the most recent incident (MRI) of violence experienced since the age of 15, for each of the following eight types of violence:

  1. Physical assault by a male perpetrator
  2. Physical threat by a male perpetrator
  3. Sexual assault by a male perpetrator
  4. Sexual threat by a male perpetrator
  5. Physical assault by a female perpetrator
  6. Physical threat by a female perpetrator
  7. Sexual assault by a female perpetrator
  8. Sexual threat by a female perpetrator
     

Detailed information about the MRI was collected, but only if the incident occurred less than 10 years prior to the survey. This detailed information included:

  • The characteristics of the violent incident e.g. information about the perpetrator, the violent behaviours involved, the location, whether alcohol or any other substance was involved, and whether physical injuries were sustained.
  • The actions taken in response to the violent incident e.g. whether the incident was reported to police and whether advice or support was sought after the incident.
  • The longer-term impacts of the violent incident e.g. whether anxiety or fear was experienced following the incident, whether time was taken off work, and whether changes were made to their usual routine as a result of the incident.
     

Note: the level of detail collected for each type of violence varied, and not all of the data collected is able to be published due to higher levels of error associated with lower prevalence types of violence, such as sexual assault by a female perpetrator. The availability and detail of most recent incident data will therefore vary across the different types of violence, as well as between men and women. Only data considered sufficiently reliable enough for general use has been published. For more information on the data collected for each type of violence and data quality, refer to the Violence – Most Recent Incident and Data Quality and Technical Notes pages of the Personal Safety Survey, Australia: User Guide, 2016 (cat. no. 4906.0.55.003).

Note: MRI data cannot be summed across the different types of violence to produce an aggregated total for any of the data items. Persons may have experienced more than one of the different types of violence and are included separately for each type.

Most recent incident of physical assault by a male

Details below refer to the most recent incident that occurred since the age 15 and less than 10 years prior to the survey.

Relationship to perpetrator in most recent incident of physical assault by a male

For the most recent incident of physical assault by a male, men were more likely to experience physical assault by a stranger. In contrast, women were more likely to experience physical assault by a male that they knew. Refer to Tables 8 and 9.

  1. Since the age of 15. Excludes incidents that occurred 10 years ago or more.
  2. In their most recent incident of physical assault by a male.

Men who experienced physical assault by a male

  • Approximately two-thirds of men who experienced physical assault by a male were assaulted by a stranger in their most recent incident (66% or 873,100).
     

Women who experienced physical assault by a male

  • About nine out of ten women who experienced physical assault by a male were assaulted by someone that they knew in their most recent incident (92% or 977,600).
  • The most common known perpetrator type was a previous partner (41% or 437,600).
     

Location of most recent incident of physical assault by a male

Men were more likely than women to have experienced physical assault by a male at a place of entertainment or recreation or at an outside location. Refer to Tables 8 and 9.

  • An estimated 28% of men, who experienced physical assault by a male, experienced their most recent incident at a place of entertainment or recreation venue (370,700) compared to 5% of females (55,800).
  • Similarly, an estimated 28% of men who experienced physical assault by a male, experienced their most recent incident at an outside location (370,500) compared with 5% of women (47,900).
     

Women were more likely than men to have experienced physical assault by a male in their home.

  • Approximately 65% of women, who experienced physical assault by a male (689,800), experienced their most recent incident in their home, compared with 11% of men (138,900).
     
  1. Since the age of 15. Excludes incidents that occurred 10 years ago or more.
  2. Location of their most recent incident of physical assault by a male.
  3. Not all locations are shown.
  4. Respondents were provided examples of "pub, nightclub, sporting venue, etc.”.
  5. Respondents were provided examples of "street, laneway, park, carpark".

Physical assault behaviours experienced during most recent incident of physical assault by a male

Men and women, who experienced physical assault by a male, reported being pushed, grabbed or shoved as the predominant physical assault behaviour during the most recent incident. Refer to Tables 8 and 9.

Women, who experienced physical assault by a male, experienced the following assault behaviours during their most recent incident:

  • pushed, grabbed or shoved (71% or 761,000)
  • had something thrown at them (36% or 380,800)
  • kicked, bitten or hit with a fist (23% or 248,400).
     

Men, who experienced physical assault by a male, experienced the following assault behaviours during their most recent incident:

  • pushed, grabbed or shoved (56% or 738,100)
  • kicked, bitten or hit with a fist (43% or 572,000).
     
  1. Since the age of 15. Excludes incidents that occurred 10 years ago or more.
  2. In their most recent incident of physical assault by a male.
  3. More than one response may have been reported so proportions may sum to more than 100%.
  4. Not all physical assault behaviours are shown.

Whether perceived alcohol or other substance contributed to the most recent incident of physical assault by a male

Men who experienced physical assault by a male were more likely than women to perceive alcohol or another substance as a contributing factor to the most recent incident. Refer to Tables 8 and 9.

  1. Since the age of 15. Excludes incidents that occurred 10 years ago or more.
  2. About their most recent incident of physical assault by a male.
  3. Persons who could not provide an answer to whether they thought alcohol or other substances contributed to the incident are not included in this graph.
  4. Based on the respondent's perception of whether alcohol or drugs contributed.

Men who experienced physical assault by a male

Just under two-thirds of men who experienced physical assault by a male perceived alcohol or another substance to be a contributing factor to the most recent incident (61% or 804,000).

Women who experienced physical assault by a male

Approximately half of all women who experienced physical assault by a male perceived alcohol or another substance to be a contributing factor to the most recent incident (49% or 519,700).

Whether police contacted about the most recent incident of physical assault by a male

The majority of men and women who experienced physical assault by a male did not contact the police about the most recent incident. There was no difference between men and women in the likelihood of contacting the police. Refer to Tables 10 and 11.

  1. Since the age of 15. Excludes incidents that occurred 10 years ago or more.
  2. About their most recent incident of physical assault by a male.
  3. Includes where the respondent contacted the police or where someone else contacted the police.
  4. Due to the effect of perturbation the sum of components may add to greater than 100%. For more details, refer to Endnote 1.

​​​​​​​Men who experienced physical assault by a male

Approximately two-thirds of men who experienced physical assault by a male did not contact the police (69% or 908,100). Common reasons for not contacting the police included not regarding the incident as a serious offence (41% or 369,600), and feeling they could deal with it themselves (39% or 353,900).

Of those that contacted the police (32% or 428,600), 31% advised that the perpetrator was charged by the police (131,500).

Police reporting changes between 2012 and 2016 - incidents in last 12 months only (endnote 2)

Between 2012 and 2016, there was no significant change in men reporting the most recent incident to police, where the incident occurred in the 12 months prior to the survey. In 2012, an estimated 33% of men reported their most recent incident of physical assault by a male to police, compared to 42% in 2016. Refer to Table 12.

Women who experienced physical assault by a male

An estimated two out of three women who experienced physical assault by a male (69% or 734,500) did not contact the police. Common reasons for not contacting the police included feeling they could deal with it themselves (38% or 278,600), and did not regard the incident as a serious offence (32% or 233,200).

Of those that contacted the police (31% or 328,400), 43% advised that the perpetrator was charged by the police (140,200).

Police reporting changes between 2012 and 2016 - incidents in last 12 months only (endnote 2)

Between 2012 and 2016, there was no change in women reporting the most recent incident to police, where the incident occurred in the 12 months prior to the survey. In 2012, an estimated 28% of women reported their most recent incident of physical assault by a male to police, compared to 29% in 2016. Refer to Table 12.

Whether perceived the most recent incident of physical assault by a male as a crime at the time

Less than half of men and women who experienced physical assault by a male perceived the most recent incident as a crime at the time that the incident occurred. Refer to Tables 13 and 14.

  1. Since the age of 15. Excludes incidents that occurred 10 years ago or more.
  2. About their most recent incident of physical assault by a male.
  3. Persons who could not provide an answer to whether they thought the incident was a crime at the time are not included in this graph.

Of persons who experienced physical assault by a male, the proportion who perceived the most recent incident as a crime was similar for both men (37% or 495,700) and women (40% or 425,400). However, women were more likely than men to perceive the incident as something that was wrong but not a crime (40% or 425,000 women compared with 26% or 347,700 men) and men were more likely than women to perceive the incident as something that just happens (31% or 405,000 men compared with 13% or 133,100 women).

Whether sought advice or support about the most recent incident of physical assault by a male

Women who experienced physical assault by a male were more likely than men to have sought advice or support about the most recent incident. Refer to Tables 15 and 16.

  1. Since the age of 15. Excludes incidents that occurred 10 years ago or more.
  2. About their most recent incident of physical assault by a male.
  3. Includes formal and informal sources of advice or support. For further information refer to Glossary.

Men who experienced physical assault by a male

The majority of men did not seek advice or support about the most recent incident.

  • Approximately two out of three men, who experienced physical assault by a male (63% or 840,100), did not seek advice.
  • Of the estimated 486,400 men who had sought advice or support, just under half sought advice or support from a friend or family member (47% or 228,800).
     

Women who experienced physical assault by a male

The majority of women did seek advice or support about the most recent incident.

  • An estimated 62% of women who experienced physical assault by a male had sought advice or support (659,000).
  • Of these women, approximately 63% sought advice or support from a friend or family member (417,500).
     

Whether experienced anxiety or fear for personal safety in the 12 months after the most recent incident of physical assault by a male

Women who experienced physical assault by a male were twice as likely as men to have experienced anxiety or fear for their personal safety in the 12 months after the most recent incident. Refer to Tables 8 and 9.

An estimated three in five women who experienced physical assault by a male (59% or 623,600) had experienced anxiety or fear in the 12 months after the most recent incident.

Approximately one in four men who experienced physical assault by a male (24% or 316,600) had experienced anxiety or fear after their most recent incident.

  1. Since the age of 15. Excludes incidents that occurred 10 years ago or more.
  2. In the 12 months after their most recent incident of physical assault by a male.

Endnotes

Endnote 1

To minimise the risk of identifying individuals in aggregate statistics, perturbation has been applied. Perturbation involves a small random adjustment of the statistics and is considered the most satisfactory technique for avoiding the release of identifiable statistics while maximising the range of information that can be released. However as a result, these random adjustments of estimates may result in the sum of components not equalling the total or subtotal. For more details, refer to the Methodology page of this publication.

Endnote 2

For more information on significance testing, refer to the Technical Note of this publication.

Most recent incident of physical assault by a female

Details below refer to the most recent incident that occurred since the age 15 and less than 10 years prior to the survey.

Relationship to perpetrator in most recent incident of physical assault by a female

In the most recent incident of physical assault by a female, both men and women were most likely to experience physical assault by a known person. However women were more likely than men to experience physical assault by a female stranger. Refer to Tables 8 and 9.

Men who experienced physical assault by a female

Approximately five in six men who experienced physical assault by a female were assaulted by someone that they knew in their most recent incident (84% or 438,600). The most common known perpetrator type was a previous partner, with three in ten men being physically assaulted by a previous partner in their most recent incident (30% or 156,200).

Women who experienced physical assault by a female

Approximately three-quarters of women who were physically assaulted by a female were assaulted by someone they knew in the most recent incident (74% or 240,900). The most common known perpetrator type was an acquaintance or neighbour, with one in five women being physically assaulted by an acquaintance or neighbour in their most recent incident (20% or 65,300).

  1. Since the age of 15. Excludes incidents that occurred 10 years ago or more.
  2. In their most recent incident of physical assault by a female.

Location of most recent incident of physical assault by a female

For both men and women who were physically assaulted by a female, the most common location where the most recent incident occurred was in their home. Refer to Tables 8 and 9.

Over half of men who were physically assaulted by a female experienced the most recent incident in their home (55% or 286,200), compared to 30% of women (98,700).

Approximately one in six women who experienced physical assault by a female experienced their most recent incident at a place of entertainment or recreation (16% or 53,200), compared to less than one in 10 men (9.4% or 49,300).

  1. Since the age of 15. Excludes incidents that occurred 10 years ago or more.
  2. Location of the most recent incident of physical assault by a female.
  3. Not all locations are shown.
  4. Respondents were provided examples of "pub, nightclub, sporting venue etc.”.

Physical assault behaviours experienced during most recent incident of physical assault by a female

The majority of both men and women, who experienced physical assault by a female, were pushed, grabbed or shoved during the most recent incident (53% or 275,600 and 63% or 204,000 respectively). Refer to Tables 8 and 9.

  1. Since the age of 15. Excludes incidents that occurred 10 years ago or more.
  2. In their most recent incident of physical assault by a female.
  3. More than one response may have been reported so proportions may sum to more than 100%.
  4. Not all physical assault behaviours are shown.

Whether perceived alcohol or other substance contributed to the most recent incident of physical assault by a female

Men and women were equally likely to perceive alcohol or another substance as contributing to the most recent incident of physical assault by a female, with just under a half of men (46% or 240,900) and women (45% or 144,600). Refer to Tables 8 and 9.

Whether police contacted about the most recent incident of physical assault by a female

The majority of men and women who experienced physical assault by a female did not contact the police about their most recent incident. There was no difference between men and women in the likelihood of contacting the police. Refer to Tables 10 and 11.

Men who experienced physical assault by a female

  • Four in five men who experienced physical assault by a female did not contact the police about their most recent incident (80% or 415,800).
  • Of those that did not contact police, the most common reasons included feeling like they could deal with the incident themselves (42% or 173,000), and not regarding the incident as a serious offence (38% or 158,600).
     

Women who experienced physical assault by a female

  • Three-quarters of women who experienced physical assault by a female did not contact the police about their most recent incident (75% or 243,800).
  • Of those that did not contact police, the most common reasons included feeling like they could deal with the incident themselves (37% or 90,000), and not regarding the incident as a serious offence (31% or 74,300).
     
  1. Since the age of 15. Excludes incidents that occurred 10 years ago or more.
  2. About their most recent incident of physical assault by a female.
  3. Includes where the respondent contacted the police or where someone else contacted the police.
  4. Due to the effect of perturbation the sum of components may add to greater than 100%. For more details, refer to Endnote 1.

Whether perceived the most recent incident of physical assault by a female as a crime at the time

Less than half of men and women who were physically assaulted by a female perceived the most recent incident as a crime at the time the incident occurred. Refer to Tables 13 and 14.

Of persons who experienced physical assault by a female, the proportion who perceived the most recent incident as a crime was similar for both men (22% or 113,900) and women (27% or 87,400). The proportion who perceived the incident as wrong but not a crime was also similar for men (46% or 240,900) and women (42% or 137,500).

  1. Since the age of 15. Excludes incidents that occurred 10 years ago or more.
  2. About their most recent incident of physical assault by a female.
  3. Persons who could not provide an answer to whether they thought the incident was a crime at the time are not included in this graph.

Whether sought advice or support about the most recent incident of physical assault by a female

Women who experienced physical assault by a female were more likely than men to have sought advice or support about the most recent incident. Refer to Tables 15 and 16.

  1. Since the age of 15. Excludes incidents that occurred 10 years ago or more.
  2. About their most recent incident of physical assault by a female.
  3. Includes formal and informal sources of advice or support. For further information refer to Glossary.
  4. Due to the effect of perturbation the sum of components may not add to 100%. For more details, refer to Endnote 1.

Men who experienced physical assault by a female

  • Approximately two in three men who experienced physical assault by a female did not seek advice or support about the most recent incident (67% or 352,700).
  • Of those men who had sought advice or support, the most common source of support was a friend or family member (39% or 66,500).
     

Women who experienced physical assault by a female

  • Just over half of women who experienced physical assault by a female had sought advice or support about the most recent incident (54% or 174,400).
  • Of those women who had sought advice or support, just over half (54% or 93,700) had sought advice or support from a friend or family member.
     

Whether experienced anxiety or fear for personal safety in the 12 months after the most recent incident of physical assault by a female

The majority of men and women who experienced physical assault by a female did not experience anxiety or fear for their personal safety in the 12 months after the most recent incident. However, women were still more likely than men to experience anxiety or fear. Refer to Tables 8 and 9.

Approximately one in five men who were physically assaulted by a female experienced anxiety or fear in the 12 months after their most recent incident (20% or 102,000). For women, about one-third experienced anxiety or fear following their most recent incident of physical assault by a female (36% or 116,100).

  1. Since the age of 15. Excludes incidents that occurred 10 years ago or more.
  2. In the 12 months after their most recent incident of physical assault by a female.
  3. Due to the effect of perturbation the sum of components may add to greater than 100%. For more details, refer to Endnote 1.

Endnotes

Endnote 1

To minimise the risk of identifying individuals in aggregate statistics, perturbation has been applied. Perturbation involves a small random adjustment of the statistics and is considered the most satisfactory technique for avoiding the release of identifiable statistics while maximising the range of information that can be released. However as a result, these random adjustments of estimates may result in the sum of components not equalling the total or subtotal. For more details, refer to the Methodology page of this publication.

Most recent incident of sexual assault by a male

Details below refer to the most recent incident that occurred since the age 15 and less than 10 years prior to the survey.

Due to the relatively small numbers of men who have experienced sexual assault by a male, estimates for males experience of sexual assault are subject to very high sampling error (for further details on sampling error refer to the Technical Note of this publication). For this reason, only information on women’s experience of sexual assault by a male are included here.

Relationship to perpetrator in most recent incident of sexual assault by a male

The 2016 PSS found that the majority of women who experienced sexual assault by a male were sexually assaulted by a known person in the most recent incident. Refer to Table 8.

Just under nine out of ten women who experienced sexual assault by a male (87% or 553,700) were sexually assaulted by a known person in the most recent incident. The most common known perpetrator type was a previous partner (26% or 163,100) in the most recent incident of sexual assault by a male.

  1. Since the age of 15. Excludes incidents that occurred 10 years ago or more.
  2. In their most recent incident of sexual assault by a male.

Location of most recent incident of sexual assault by a male

The majority of women who experienced sexual assault by a male were assaulted in a home (either their own or someone else’s) in the most recent incident. Refer to Table 8.

An estimated 40% of women who experienced sexual assault by a male were assaulted in their own home in the most recent incident (252,400). A further 17% were sexually assaulted in the perpetrator’s home (109,400) and a further 13% were assaulted in another person’s home (84,600).

  1. Since the age of 15. Excludes incidents that occurred 10 years ago or more.
  2. Location of their most recent incident of sexual assault by a male.
  3. Not all locations are shown.
  4. Respondents were provided examples of "pub, nightclub, sporting venue etc.”.
  5. Respondents were provided examples of "street, laneway, park, carpark".

Whether police contacted about the most recent incident of sexual assault by a male

The majority of women, who experienced sexual assault by a male, did not contact the police, about the most recent incident. Refer to Table 10.

  1. Since the age of 15. Excludes incidents that occurred 10 years ago or more.
  2. About their most recent incident of sexual assault by a male.
  3. Includes where the respondent contacted the police or where someone else contacted the police.

Approximately nine out of ten women who experienced sexual assault by a male (87% or 553,900) did not contact the police about the most recent incident. Reasons for not contacting the police included feeling like they could deal with it themselves (34% or 189,400) and not regarding the incident as a serious offence (34% or 187,400).

Of the 85,700 women, who did contact the police, approximately one quarter advised that the perpetrator was charged (27% or 23,500).

Police reporting changes between 2012 and 2016 – incidents in last 12 months only (endnote 1)

Between 2012 and 2016, there was no significant change in women reporting the most recent incident to police, where the incident occurred in the 12 months prior to the survey. In 2012, an estimated 17% of women reported their most recent incident of sexual assault by a male to police, compared to 15% in 2016. Refer to Table 12.

Whether perceived the most recent incident of sexual assault by a male as a crime at the time

Less than half of all women who experienced sexual assault by a male perceived the most recent incident as a crime at the time that the incident occurred. Refer to Table 13.

Women who experienced sexual assault by a male were more likely to perceive the most recent incident as wrong but not a crime (42% or 268,000), compared with something that just happens (22% or 138,900) or as a crime (26% 165,600).

  1. Since the age of 15. Excludes incidents that occurred 10 years ago or more.
  2. About their most recent incident of sexual assault by a male
  3. Persons who could not provide an answer to whether they thought the incident was a crime at the time are not included in this graph.

Whether sought advice or support about the most recent incident of sexual assault by a male

Half of all women who experienced sexual assault by a male sought advice or support about the most recent incident (50% or 316,900). Of these women, 71% sought advice or support from a friend or family member (224,500). Refer to Table 15.

Whether experienced anxiety or fear for personal safety in the 12 months after the most recent incident of sexual assault by a male

Over half of women who experienced sexual assault by a male felt anxiety or fear for their personal safety in the 12 months after the most recent incident (57% or 365,700). Refer to Table 8.

Endnotes

Endnote 1

For more information on significance testing, refer to the Technical Note page of this publication.

Experience of partner violence

The 2016 Personal Safety Survey (PSS) collected in-depth information about men's and women's experience of violence by a partner, including both physical and sexual violence experienced since the age of 15.

'Violence' is defined as any incident involving the occurrence, attempt or threat of either physical or sexual assault experienced by a person since the age of 15. 'Physical violence' includes physical assault and/or physical threat. 'Sexual violence' includes sexual assault and/or sexual threat. Refer to Experience of Violence chapter in this publication for more details.

In this chapter the term 'partner' is used to describe a person the respondent currently lives with, or has lived with at some point, in a married or de facto relationship. This relationship is referred to in relevant tables as co-habiting partner. Data collected as part of the partner violence topic reported in this chapter do not include violence by a boyfriend/girlfriend or date or ex-boyfriend/girlfriend (although both are included in some tables as part of the definition of intimate partner).

This chapter includes information about respondents' experiences of violence by a current partner and/or a previous partner.

A 'current partner' is a person who, at the time of the survey, was living with the respondent in a marriage or de-facto relationship.

A 'previous partner' is a person who lived with the respondent at some point in a marriage or de facto relationship, but who was no longer living with the respondent at the time of the survey. This includes:

  • A partner who was violent during the relationship, but the relationship has now ended.
  • A partner who was not violent during the relationship, but has been violent since the relationship ended.
  • A partner who was violent both during and after the relationship.
     

Note: The definitions of current and previous partner for the PSS are based on the living arrangements at the time of the survey. This is irrespective of whether the respondent considers their partner to be a current or previous partner, or what the living arrangements may have been at the time of any incident.

Note: Many of the estimates of men's experiences of violence by a partner are subject to very high sampling error (for further details regarding sampling error, refer to the Data Quality and Technical Notes page of the Personal Safety Survey, Australia: User Guide, 2016 (cat. no. 4906.0.55.003)). For this reason only limited information on men's experience of violence by a partner are included in the tables and commentary.

Prevalence of partner violence

Refer to Table 3.

Experience of partner violence since the age of 15

Women aged 18 years and over were more likely than men to have experienced either physical violence and/or sexual violence, by a partner since the age of 15.

  • An estimated 17% of women (1.6 million) and 6.1% of men (547,600) had experienced violence by a partner since the age of 15.
  • Around one in six women (16% or 1.5 million) experienced physical violence by a partner, compared with one in seventeen men (5.9% or 528,800).
  • Women were eight times more likely to experience sexual violence by a partner than men. Approximately 5.1% of women (480,200) experienced sexual violence by a partner, compared with approximately 0.6% of men (53,000).
     
  1. Includes physical assault and/or physical threat.
  2. Includes sexual assault and/or sexual threat.
  3. Includes physical violence and/or sexual violence.
  4. People may have experienced multiple types of violence. Components therefore may not add to total.

Women's experience of partner violence since the age of 15

Women were more likely to have experienced violence by a previous partner than a current partner.

  • An estimated 2.9% of women (275,000) experienced violence by a current partner.
  • Approximately 14.6% of women (1.4 million) experienced violence by a previous partner.
     

Women were also more likely to have experienced physical violence than sexual violence by either a current or previous partner.

  • An estimated 2.6% of women (245,800) experienced physical violence by a current partner compared to 0.7% (61,000) who experienced sexual violence.
  • Approximately 13.4% of women (1.3 million) experienced physical violence by a previous partner compared to 4.5% (422,300) who experienced sexual violence.
     

Women's experience of partner violence (a), since the age of 15

PSS2016 tree diagram female partner violence
All women = 9,373,500 (100%). Women who did not experience partner violence = 7,748,100 (82.7%). Women who experienced partner violence = 1,625,000 (17.3%). Violence by a current partner = 275,000 (2.9%). Violence by a previous partner = 1,372,900 (14.6%). Physical violence by a current partner = 245,800 (2.6%). Sexual violence by a current partner = 61,000 (0.7%). Physical violence by a previous partner = 1,255,100 (13.4%). Sexual violence by a previous partner = 422,300 (4.5%).
  1. Definitions of current and previous partner are based on the living arrangements at the time of the survey.
  2. Due to rounding and the effect of perturbation, components may not add to totals. For more details, refer to Endnote1.
  3. People may have experienced violence by both a current and previous partner. Components therefore may not add to the totals.
  4. People may have experienced multiple types of violence. Components therefore may not add to the totals.
  5. Includes physical assault and/or physical threat.
  6. Includes sexual assault and/or sexual threat.

Men's experience of partner violence since the age of 15

Men were more likely to have experienced violence by a previous partner than a current partner.

  • An estimated 1.7% of men (150,300) experienced violence by a current partner.
  • Approximately 4.4% of men (397,300) experienced violence by a previous partner.
     

Men's experience of partner violence since the age of 15

PSS2016 tree diagram male partner violence
All men = 9,027,600 (100%). Men who did not experience partner violence = 8,478,300 (93.9%). Men who experienced partner violence = 547,600 (6.1%). Violence by a current partner = 150,300 (1.7%). Violence by a previous partner = 397,300 (4.4%).
  1. Definitions of current and previous partner are based on the living arrangements at the time of the survey.
  2. Due to rounding and the effect of perturbation, components may not add to totals. For more details, refer to Endnote1.
  3. People may have experienced violence by both a current and previous partner. Components therefore may not add to the totals.


Endnotes

Endnote 1

To minimise the risk of identifying individuals in aggregate statistics, perturbation has been applied. Perturbation involves a small random adjustment of the statistics and is considered the most satisfactory technique for avoiding the release of identifiable statistics while maximising the range of information that can be released. However as a result, these random adjustments of estimates may result in the sum of components not equalling the total or subtotal. For more details, refer to the Methodology page of this publication.

Prevalence of partner violence over time

The PSS has previously been conducted in 2005 and 2012. For more information on comparability of prevalence of partner violence over time, refer to the Partner Violence chapter of the Personal Safety Survey, Australia: User Guide, 2016 (cat. no. 4906.0.55.003).

Between 2005 and 2016, the proportion of women who experienced partner violence in the previous 12 months has remained relatively stable. In 2005, approximately 1.5% of women aged 18 years and over experienced partner violence in the previous 12 months, whilst in 2016 the figure was 1.7%. Since the survey was last conducted in 2012, there was also no significant difference in the proportion of women who experienced partner violence (1.5%).

The proportion of men who experienced partner violence in the previous 12 months increased between 2005 and 2016. In 2005, approximately 0.4% of men aged 18 years and over experienced partner violence in the previous 12 months, whilst in 2016 the figure was 0.8%. However since the survey was last conducted in 2012, there was no significant change in the proportion of men who experienced partner violence (0.6%). Refer to Table 2.

Characteristics of partner violence

Where a person reported experiencing any type of violence by a partner since the age of 15, additional information was collected about the actions taken and consequences of violence over the course of the relationship. This provides a detailed dataset with comprehensive information for what happens when a person experiences:

  • Violence by a current partner who the respondent was living with at the time of the interview.
  • Violence by a previous partner the respondent was no longer living with or no longer in a relationship with at the time of interview. Where a person experienced violence by more than one previous partner, they were asked to focus on their most recently violent previous partner and what happened during and after that relationship.
     

Note: If a respondent experienced violence by more than one previous partner, detailed information was only collected for their most recently violent previous partner.

Note: The characteristics of current partner and previous partner violence cannot be added together to produce a total for characteristics of "partner violence". This is because persons may have experienced violence by both a current partner and a previous partner and therefore could be double counted if the data are combined. For more details, refer to the Partner Violence page of the Personal Safety Survey, Australia: User Guide, 2016 (cat. no. 4906.0.55.003).

Frequency of partner violence

Whether experienced a single incident of violence or multiple incidents

Current partner

Men and women who experienced violence by a current partner were equally likely to experience multiple incidents of violence. Refer to Table 17.

  • An estimated 54% of women (149,600) who experienced violence by a current partner experienced more than one incident of violence by that partner.
  • An estimated 65% of men (97,600) who experienced violence by a current partner experienced more than one incident by that partner.
     

Note: Whilst it may appear that men were more likely than women to experience multiple incidents of current partner violence, when the sampling error of these estimates is taken into consideration, the differences in these estimates are not statistically significantly. For more details regarding significance testing, refer to the Data Quality and Technical Notes page of the Personal Safety Survey, Australia: User Guide, 2016 (cat. no. 4906.0.55.003).

Previous partner

Both men and women who experienced previous partner violence were more likely to experience multiple incidents of violence than a single incident. Refer to Table 18.

  • An estimated 68% of women (931,800) who experienced violence by a previous partner experienced more than one incident of violence by that partner.
  • An estimated 61% of men (241,600) who experienced violence by a previous partner experienced more than one incident by that partner.
     

Experience of anxiety or fear due to partner violence

Men were less likely than women to experience fear or anxiety due to violence by both a current partner and a previous partner. Refer to Tables 20 and 21.

  1. Experienced partner violence since the age of 15.

Women's experience of anxiety or fear due to partner violence

Current partner

Nearly half of all women who experienced current partner violence, experienced anxiety or fear due to the violence (46% or 126,100).

Previous partner

Approximately two in three women who experienced previous partner violence felt anxiety or fear due to the violence (65% or 887,900). Half of these reported feeling anxiety or fear most or all of the time (50% or 446,900) Endnote 1.

Men's experience of anxiety or fear due to partner violence

Refer to Table 21.

Current partner

An estimated 32% of men (*47,300) who experienced current partner violence felt anxiety or fear due to the violence. * This estimate has a Relative Standard Error of 25% to 50% and should be used with caution.

Previous partner

One in three men (29% or 116,000) who experienced previous partner violence felt anxiety or fear due to the violence.

Endnotes

Endnote 1

Frequency of anxiety or fear proportions provided in this section are produced from published figures in Table 21.

Actions taken in response to partner violence

Note: this data refers to the respondent's help-seeking behaviours over the whole relationship with their current partner and/or most recent violent previous partner.

Whether sought advice or support about partner violence (endnote 1)

Women were more likely than men to seek advice or support about the violence which they experienced by either a current or previous partner (for definition of ‘advice or support’, refer to the Glossary). Refer to Tables 17 and 18.

  1. Experienced partner violence since the age of 15.

Whether women sought advice or support about partner violence

Current partner

  • Just over half of women (54% or 149,700) who experienced current partner violence had sought advice or support about the violence they experienced. Of these women, approximately two thirds sought advice or support from a friend or family member (67% or 100,100).
  • Of the women who did not seek advice or support (46% or 126,900) approximately half reported that one of the reasons for not seeking advice or support was because they felt they could deal with it themselves (50% or 63,100).
     

Previous partner

  • An estimated 63% of women (864,100) who experienced previous partner violence, had sought advice or support about the violence they experienced. Of these women, approximately two thirds sought advice or support from a friend or family member (65% or 560,600).
  • Approximately one third of women (37% or 506,800) who experienced previous partner violence had not sought advice or support about the violence they experienced. The most common reason for these women not seeking advice or support was because they felt they could deal with it themselves (47% or 238,400).
     

Whether men sought advice or support about partner violence

Current partner

  • Approximately 68% of men (102,400) who experienced current partner violence had not sought advice or support about the violence they experienced.
     

Previous partner

  • Approximately two out of three men (59% or 235,300) who experienced previous partner violence had not sought advice or support about the violence they experienced. The most common reason for these men not seeking advice or support was because they felt they could deal with it themselves (60% or 141,800).
  • Of those that sought advice or support (41% or 161,900), over half sought advice or support from a friend or family member (54% or 87,500).
     

Whether police contacted about partner violence

A large proportion of men and women that experienced current or previous partner violence never contacted police. Refer to Table 19.

  1. Experienced partner violence since the age of 15.
  2. Contacting the police includes where the police were contacted by the respondent or by someone else.

Police involvement in men's experience of partner violence

Current partner

  • An estimated 97% of men (146,100) who experienced current partner violence never contacted the police.
     

Previous partner

  • An estimated 76% of men (299,900) who experienced previous partner violence never contacted the police.
  • Of the estimated 99,100 men who had contacted the police approximately three quarters (73% or 72,300) reported that their partner was not charged.
     

Police involvement in women's experience of partner violence

Current partner

  • An estimated 82% of women (225,700) who experienced current partner violence never contacted the police.
  • Of the estimated 47,900 women who had contacted the police, approximately half (55% or 26,200) reported that their partner was not charged.
     

​​​​​​​Previous partner

  • An estimated 65% of women (888,100) who experienced previous partner violence never contacted the police.
  • Of the estimated 485,800 women who had contacted the police approximately half (56% or 271,900) reported that their partner was not charged.
  • Of the estimated 189,300 women whose violent partner was charged, approximately 86% (162,200) reported that their partner went to court.
     

Whether a restraining order was ever issued against a violent previous partner (endnote 2)

A small proportion of men and women had a restraining order issued against their violent previous partner. Refer to Tables 25 and 26. Women were more likely than men to have a restraining order issued against their violent previous partner.

  • Approximately one in four women who experienced previous partner violence had a restraining order issued against their partner (24% or 329,500).
  • Approximately one in ten men who experienced previous partner violence had a restraining order issued against their partner (10% of 41,100).
     

Endnotes

Endnote 1

To minimise the risk of identifying individuals in aggregate statistics, perturbation has been applied. Perturbation involves a small random adjustment of the statistics and is considered the most satisfactory technique for avoiding the release of identifiable statistics while maximising the range of information that can be released. However as a result, these random adjustments of estimates may result in the sum of components not equalling the total or subtotal. For more details, refer to the Methodology page of this publication.

Endnote 2

Different terminology is used across different states of Australia to label violence orders including apprehended violence orders, domestic violence orders, intervention orders (etc.). Information collected in the survey is based on respondent’s reporting of whether any of these types of orders, including interim orders, were issued by a court.

Impacts of partner violence - children witnessing or during pregnancy

Note: the definition of partner violence for this section is restricted to only those who experienced violence by a partner while they were living together. A partner who was not violent during the relationship, but has been violent since the relationship ended is not included.

Whether violence seen or heard by children

Men and women were equally likely to have children in their care at the time of experiencing partner violence.

  1. Experienced partner violence since the age of 15.
  2. Previous partner living with at the time that the violence occurred.

Whether children had seen or heard women's experience of partner violence (endnote 1)

Current partner

An estimated 50% of women (60,300) who had children in their care when they experienced violence by a current partner reported that the children had seen or heard the violence.

Previous partner

An estimated 68% of women (418,200) who had children in their care when they experienced violence by a previous partner reported that the children had seen or heard the violence.

Whether children had seen or heard men's experience of partner violence

Previous partner

An estimated 60% of men (92,200) who had children in their care when they experienced violence by a previous partner reported that the children had seen or heard the violence.

Whether violence occurred during pregnancy

The 2016 PSS collected information about whether women who experienced violence by a partner were ever pregnant during the relationship, and if so, whether violence occurred during their pregnancy. Refer to Table 19.

Current partner

An estimated 187,800 women who experienced violence by a current partner were pregnant at some point during the relationship. Of these women, nearly one in five (18% or 34,500) experienced violence during their pregnancy.

Previous partner

An estimated 686,400 women who experienced violence by a previous partner were pregnant at some point during the relationship. Of these women, nearly half (48% or 325,900) experienced violence during their pregnancy.

Endnotes

Endnote 1

Whether children had seen or heard violence proportions provided in this section are produced from published figures in Tables 17 and 18.

Impacts of partner violence - temporary separation

Note: the definition of partner violence for this section is restricted to only those who experienced violence by a partner while they were living together. A partner who was not violent during the relationship, but has been violent since the relationship ended is not included.

Whether ever temporarily separated from violent partner

Refer to Table 23.

Whether men temporarily separated from violent partner

Men who experienced current or previous partner violence were less likely than women to temporarily separate from their partner.

Current partner

An estimated 82% of men (123,400) who experienced violence by a current partner had never temporarily separated from their partner.

Previous partner

An estimated 38% of men (141,600) who experienced violence by a previous partner temporarily separated from their partner during the relationship. Of these men, around one in four separated from their partner just once (27% or 38,700), with the remaining separating more than once.

  1. Experienced partner violence since the age of 15.
  2. Previous partner living with at the time that the violence occurred.
  3. Estimate for men who experienced previous partner violence and temporarily separated three times has an RSE between 25% and 50% and should be used with caution.
  4. Estimate for men who experienced previous partner violence and temporarily separated more than three times has an RSE between 25% and 50% and should be used with caution.

Whether women temporarily separated from violent partner

Refer to Table 22.

Current partner

An estimated 70% of women (193,400) who experienced violence by a current partner had never temporarily separated from their partner.

Previous partner

An estimated 49% of all women (617,900) who experienced violence by a previous partner temporarily separated during the relationship. Of these women, 35% separated from their partner just once (218,400).

  1. Experienced partner violence since the age of 15.
  2. Previous partner living with at the time that the violence occurred.

Experience of partner emotional abuse

The 2016 Personal Safety Survey (PSS) collected information about men’s and women’s experiences of emotional abuse by a current and/or previous partner since the age of 15.

Emotional abuse occurs when a person is subjected to certain behaviours or actions that are aimed at preventing or controlling their behaviour, causing them emotional harm or fear. These behaviours are characterised in nature by their intent to manipulate, control, isolate or intimidate the person they are aimed at. They are generally repeated behaviours and include psychological, social, economic and verbal abuse.

Some examples of behaviours used to define the concept of emotional abuse in the 2016 PSS include:

  • Controlling or trying to control a person from contacting family, friends or community.
  • Constantly insulting a person to make them feel ashamed, belittled or humiliated (e.g. put downs).
  • Shouting, yelling or verbally abusing a person to intimidate them.
  • Lying to a person’s child/children with the intent of turning their children against them.
  • Threatening to take a person’s child/children away from them.
     

For a full list of behaviours collected in the 2016 PSS used for the PSS definition of emotional abuse and further information on emotional abuse, refer to the Partner Emotional Abuse page in the Personal Safety Survey, Australia: User Guide, 2016 (cat. no. 4906.0.55.003).

The term 'partner' is used to describe a person the respondent currently lives with, or has lived with at some point, in a married or de facto relationship. This relationship is referred to in some tables as co-habiting partner. Data reported about emotional abuse by a partner does not include emotional abuse by a boyfriend/girlfriend or date or ex-boyfriend/girlfriend.

Respondents were asked about any experiences of emotional abuse by both a current partner and a previous partner.

A ‘current partner’ is a person who, at the time of the survey, was living with the respondent in a marriage or de-facto relationship.

A ‘previous partner’ is a person who lived with the respondent at some point in a marriage or de facto relationship, but who was no longer living with the respondent at the time of the survey. This includes:

  • a partner who was emotionally abusive during the relationship, but the relationship has now ended
  • a partner who was not emotionally abusive during the relationship, but has been since the relationship ended
  • a partner who was emotionally abusive both during and after the relationship.
     

If a respondent had more than one emotionally abusive previous partner, the PSS only asked them for detailed information about their most recently emotionally abusive previous partner.

Note: The definitions of current and previous partner for the PSS are based on the living arrangements at the time of the survey. This is irrespective of whether the respondent considers their partner to be a current or previous partner, or what the living arrangements may have been at the time of any incident.

Experience of emotional abuse by a partner since the age of 15

Almost one in four women (23% or 2.2 million) experienced emotional abuse by a current and/or previous partner since the age of 15, compared to just over one in six men (16% or 1.4 million). Refer to Table 27.

Since the age of 15:

  • women and men reported experiencing similar rates of emotional abuse by a current partner (6.1% or 575,400 women and 5.2% or 473,600 men)
  • about one in five women (18% or 1.7 million) reported experiencing emotional abuse by a previous partner, compared to around one in eight men (12% or 1 million).
     
  1. Experience of emotional abuse since the age of 15.
  2. People may experience emotional abuse by a current and a previous partner. Components therefore may not add to the total.

Experience of emotional abuse by a partner in the last 12 months

In the 12 months prior to the survey, women and men were just as likely to report experiencing emotional abuse by a current and/or previous partner (4.8% or 451,500 women and 4.2% or 381,200 men). Refer to Table 1.

In the 12 months prior to the survey:

  • 3.2% of women (298,700) and 2.9% of men (265,800) reported experiencing emotional abuse by a current partner
  • 1.7% of women (161,200) and 1.4% of men (125,400) reported experiencing emotional abuse by a previous partner.
     

Types of emotionally abusive behaviours experienced

Note: In addition to current partner, only data for the most recently emotionally abusive previous partner was collected. Therefore the data may not be representative of all experiences related to emotionally abusive previous partners.

Refer to Table 28.

Current partner (endnote 1)

Women who had experienced emotional abuse by a current partner since the age 15 were more likely than men to experience:

  • Being shouted at, yelled at or verbally abused with the intent to intimidate them (58% or 334,600 women, and 37% or 177,100 men)
  • Being constantly insulted in order to make them feel ashamed, belittled or humiliated (32% or 181,800 women, and 22% or 105,600 men).
     

A similar proportion of men (21% or 97,100) and women (23% or 131,300) reported that their partner had controlled or tried to control them from contacting family, friends or community.

  1. Persons who experienced emotional abuse by their current partner since the age of 15.
  2. Not all types of emotional abuse behaviours shown.
  3. More than one emotional abuse behaviour may be reported. Therefore components may sum to more than 100% and cannot be summed to produce totals.
  4. Shouted, yelled or verbally abused them to intimidate them.
  5. Constantly insulted them to make them feel ashamed, belittled or humiliated.
  6. Controlled or tried to control them from contacting family, friends or community.

Previous partner (endnote 1)

Of the estimated 1.7 million women who had experienced emotional abuse by a previous partner since the age of 15, 63% (1.1 million) reported that their most recently emotionally abusive previous partner shouted, yelled or verbally abused them to intimidate them. In comparison, of the estimated 1 million men who had experienced emotional abuse by a previous partner, 46% (484,200) reported that their previous partner shouted, yelled or verbally abused them to intimidate them.

Women were also more likely than men to have experienced their previous partner constantly insulting them to make them feel ashamed, belittled or humiliated. An estimated 59% of women (1 million) who had experienced emotional abuse by a previous partner reported this behaviour compared to 36% of men (373,300).

Women were more likely than men to have experienced their previous partner threatening or trying to commit suicide. An estimated 25% of women (414,600) who experienced emotional abuse by a previous partner reported this behaviour compared to 16% of men (169,700).

Men and women who experienced emotional abuse by a previous partner reported at similar rates that their previous partner threatened to take their children away from them (27% or 287,500 men and 24% or 406,400 women).

Men were more likely than women to have experienced their previous partner lying to their children with the intent of turning the children against them, with an estimated 39% of men (403,100) and 25% of women (425,000).

  1. Most recently emotionally abusive previous partner since the age of 15.
  2. Not all types of emotional abuse behaviours shown.
  3. More than one emotional abuse behaviour may be reported. Therefore components may sum to more than 100% and cannot be summed to produce totals.
  4. Shouted, yelled or verbally abused them to intimidate them.
  5. Constantly insulted them to make them feel ashamed, belittled or humiliated.
  6. Lied to their child/ren with the intent of turning them against them.
  7. Threatened or tried to commit suicide.
  8. Threatened to take their children away from them.

Women were more likely than men to experience controlling behaviours by their most recently emotionally abusive previous partner. This includes:

  • controlling their contact with family, friends or community (50% of women (838,500) compared to 42% of men (435,100))
  • controlling or trying to control where they went or who they saw (46% of women (783,000) compared to 32% of men (330,500))
  • controlling them knowing about, having access to or making decisions about household money (38% of women (635,000) compared to 22% of men (233,600))
  • controlling or trying to control them from working or earning money (22% of women (372,700) compared to 11% of men (116,200)).
     

A similar proportion of women and men reported that their previous partner controlled or tried to control their income or assets (27% or 499,600 women and 22% or 231,700 men).

  1. Most recently emotionally abusive previous partner since the age of 15.
  2. Not all types of controlling emotional abuse behaviours shown.
  3. More than one emotional abuse behaviour may be reported. Therefore components may sum to more than 100% and cannot be summed to produce totals.
  4. Controlled or tried to control them from contacting family, friends or community.
  5. Controlled or tried to control where they went or who they saw.
  6.  Controlled or tried to control them from knowing about, having access to or making decisions about household money.
  7. Controlled or tried to control them from working or earning money.

Experience of anxiety or fear due to emotional abuse by a partner since the age of 15

Women were more likely than men to experience fear or anxiety due to emotional abuse by both a current partner and a previous partner. Refer to Table 29.

Women’s experience of anxiety or fear due to emotional abuse by a partner

  • Almost six in ten women (59% or 338,100) who experienced emotional abuse by a current partner experienced anxiety or fear due to the emotional abuse.
  • Just over seven in ten women (72% or 1.2 million) who experienced emotional abuse by a previous partner experienced anxiety or fear due to the emotional abuse.
     

​​​​​​​Men’s experience of anxiety or fear due to emotional abuse by a partner

  • Just over two in five men (41% or 196,200) who experienced emotional abuse by a current partner experienced anxiety or fear due to the emotional abuse.
  • Similarly, just over two in five men (43% or 452,200) who experienced emotional abuse by a previous partner experienced anxiety or fear due to the emotional abuse.
     

Endnotes

Endnote 1

People may have experienced more than one type of emotionally abusive behaviour by a partner. Therefore behaviours may sum to more than 100% and cannot be summed to produce totals.

Experience of partner emotional abuse – current state or territory of residence

The Personal Safety Survey (PSS) collects information about a person’s state or territory of usual residence, although this is not necessarily the state or territory in which the emotional abuse took place. The reference period presented for all state and territory estimates is experiences of emotional abuse by a current and/or previous partner in the 12 months prior to interview.

The PSS was not designed to produce data at the state and territory level for men, however, some data was able to be produced for the larger population states (New South Wales, Victoria, Queensland, South Australia and Western Australia). Care should still be used when interpreting this data. Endnote 1 For more information on Sample Design, refer to the Methodology page in the Personal Safety Survey, Australia: User Guide, 2016 (cat. no. 4906.0.55.003).

A ‘current partner’ is a person who, at the time of the survey, was living with the respondent in a marriage or de facto relationship.

A ‘previous partner’ is a person who lived with the respondent at some point in a marriage or de facto relationship, but who was no longer living with the respondent at the time of the survey.

Experience of emotional abuse by a partner in the last 12 months

In 2016, across all states and territories, the proportion of women who had experienced current and/or previous partner emotional abuse in the last 12 months was similar to the national prevalence rate for women (4.8%). Refer to Table 1 of the State and Territory Tables.

Similarly, in states where data is available, the proportion of males who had experienced emotional abuse by a current and/or previous partner in the last 12 months was also similar to the national prevalence rate for men (4.2%).

Prevalence of partner emotional abuse since 2012 (endnote 2)

Between 2012 and 2016, the proportion of women experiencing emotional abuse by a current and/or previous partner in the last 12 months remained stable for the majority of states and territories, except for Western Australia which increased from 3.3% in 2012 to 5.3% in 2016. Refer to Table 2 of the State and Territory Tables.

For the same period, in states where data is available, the proportion of men experiencing emotional abuse by a current and/or previous partner in the last 12 months remained stable in Victoria, Queensland, South Australia and Western Australia. However, there was an increase in the proportion of men who experienced emotional abuse by a current and/or previous partner in New South Wales (2.4% in 2012 to 3.9% in 2016).

Prevalence of women’s experience of current partner emotional abuse since 2012

Between 2012 and 2016, there was an increase in women experiencing current partner emotional abuse in South Australia (from 2.1% to 3.5%) and Western Australia (from 1.7% to 3.6%). Refer to Table 2 of the State and Territory Tables

  1. In the 12 months prior to the survey.
  2. In order to accurately capture the emerging trends in experiences of partner emotional abuse, new partner emotional abuse behaviours have been specifically included in the 2016 PSS. Although these behaviours may have previously been collected as part of other categories, this should be considered when comparing partner emotional abuse prevalence rates between the 2012 and 2016 iterations of the survey. Refer to the Partner Emotional Abuse chapter of the Personal Safety Survey, Australia: User Guide, 2016 (cat. no. 4906.0.55.003).

Endnotes

Endnote 1

While data for men has been produced for some of the larger population states (New South Wales, Victoria, Queensland, South Australia and Western Australia), the reliability of this data may vary, and users should remain aware of RSEs and/or MoEs when interpreting this data.

Endnote 2

In order to accurately capture emerging trends in experiences of emotional abuse (such as the use of information and communication technology), new emotional abuse behaviours have been specifically included in the 2016 PSS. Although these behaviours have been previously collected as part of other categories, this should be considered when comparing emotional abuse prevalence rates between 2012 and 2016 iterations of the survey.

Experience of abuse before the age of 15

The 2016 Personal Safety Survey (PSS) collected information about men’s and women’s experiences of physical and/or sexual abuse before the age of 15 years by any adult (male or female), including the person’s parents.

Physical abuse includes any deliberate physical injury (including bruises) inflicted upon a child (under the age of 15 years) by an adult. It excludes discipline that accidentally resulted in injury, emotional abuse, and physical abuse by someone under the age of 18.

Sexual abuse includes any act by an adult involving a child (under the age of 15 years) in sexual activity beyond their understanding or contrary to currently accepted community standards. It excludes emotional abuse and sexual abuse by someone under the age of 18.

For more information on the collection of Abuse before the age of 15 data, including the level of refusal for this topic, refer to the Abuse before the Age of 15 page of the Personal Safety Survey, Australia: User Guide, 2016 (cat. no. 4906.0.55.003).

Prevalence of experience of abuse before the age of 15 (endnote 1)

Over one in ten Australians aged 18 years and over (13% or 2.5 million) have experienced abuse before the age of 15. This includes an estimated 1.6 million people (8.5%) who experienced physical abuse and 1.4 million (7.7%) who experienced sexual abuse. Refer to Table 31.

Around one in six women (16% or 1.5 million) and just over one in ten men (11% or 991,600) experienced abuse before the age of 15.

Men’s experience of abuse before the age of 15 (endnote 2)

Of the men that experienced abuse before the age of 15, 94% (929,100) reported experiencing abuse by someone known to them. The proportion of men that experienced abuse by someone known to them was higher for sexual abuse (98% or 715,300) than for physical abuse (84% or 343,700).

Men who experienced sexual abuse before the age of 15 reported that the most common perpetrator type was a non-familial known person (i.e. a known person that wasn’t a family member/relative/in-law), with nearly two-thirds of sexually abused men (65% or 268,500) experiencing abuse by this perpetrator type.

Men who experienced physical abuse before the age of 15 reported that the most common perpetrator type was a parent (including step parents), with approximately three in every four physically abused men (73% or 534,100) experiencing abuse by this perpetrator type.

  1. Men may have experienced abuse by multiple types of perpetrators or multiple types of abuse. Therefore components cannot be summed to obtain totals.
  2. Includes step-parents.
  3. Includes step-siblings.
  4. Includes foster carer or other person associated with care placement, family friend, acquaintance/neighbour, doctor or other health professional, teacher, other school related staff, childcare worker, in-home care educator or carer, recreational leader, priest/minister/rabbi/nun/other person associated with place of worship, staff in a children's home/orphanage, corrective services personnel, and other known person.

Women’s experience of abuse before the age of 15 (endnote 2)

Of the women who experienced abuse before the age of 15, 94% (1.4 million) reported experiencing abuse by someone known to them. The proportion of women that experienced abuse by someone known to them was higher for physical abuse (97% or 803,100) than for sexual abuse (91% or 907,300).

Women who experienced sexual abuse before the age of 15 reported that the most common perpetrator type was a non-familial known person (i.e. a known person that wasn’t a family member/relative/in-law), with just under half of sexually abused women (47% or 468,400) experiencing abuse by this perpetrator type.

Women who experienced physical abuse before the age of 15 reported that the most common perpetrator type was a parent (including step parents), with four in every five physically abused women (79% or 654,600) experiencing abuse by this perpetrator type.

  1. Women may have experienced abuse by multiple types of perpetrators or multiple types of abuse. Therefore components cannot be summed to obtain totals.
  2. Includes step-parents.
  3. Includes step-siblings.
  4. Includes foster carer or other person associated with care placement, family friend, acquaintance/neighbour, doctor or other health professional, teacher, other school related staff, childcare worker, in-home care educator or carer, recreational leader, priest/minister/rabbi/nun/other person associated with place of worship, staff in a children's home/orphanage, corrective services personnel, and other known person.

Experience of abuse and witnessing violence before the age of 15 by whether experienced partner violence since the age of 15 (endnote 3)

This section examines the relationship between the respondent’s experiences before the age of 15, including abuse by an adult and the witnessing of violence against a parent, and whether the respondent subsequently experienced partner violence after the age of 15.

The 2016 PSS asked respondents if they ever heard or saw violence being directed at one parent by their partner before the age of 15.

‘Mother’ includes step mothers and female guardians or care-givers. ‘Partner’ includes the person’s father/stepfather, and the mother’s boyfriend or same-sex partner.

‘Father’ includes step fathers and male guardians or care-givers. ‘Partner’ includes the person’s mother/stepmother, and the father’s girlfriend or same-sex partner.

For this section, witnessing violence referred to physical assault only. In partner violence since the age of 15 however, violence refers to physical and/or sexual violence. Refer to the Glossary for the definition of physical assault.

Men’s experience of abuse and witnessing violence before the age of 15 by whether experienced partner violence since the age of 15

Experienced abuse before the age of 15

Around one in six men who experienced abuse before the age of 15 experienced partner violence as an adult (15% or 152,600). Men who experienced abuse before the age of 15 were three times more likely to experience partner violence as an adult than men who had not experienced abuse before the age of 15 (15% compared to 4.7%). Refer to Table 30.

  1. Experienced physical and/or sexual abuse before the age of 15.
  2. Experienced violence by a current and/or previous partner since the age of 15.

Witnessed violence towards a parent by a partner before the age of 15

One in ten men witnessed violence towards their mother by a partner before the age of 15 (10% or 896,700). Endnote 4 These men were at least twice as likely to experience partner violence (after the age of 15) than men who had not witnessed violence towards their mother by a partner (14% compared to 5.2%). Refer to Table 30.

One in twenty-five men witnessed violence towards their father by a partner before the age of 15 (4.2% or 380,000). Endnote 4 These men were almost four times as likely to experience partner violence (after the age of 15) than males who had not witnessed violence towards their father by a partner (20% compared to 5.5%).

  1. Witnessed violence towards mother by a partner before the age of 15.
  2. Experienced violence by a current and/or previous partner since the age of 15.
  1. Witnessed violence towards father by a partner before the age of 15.
  2. Experienced violence by a current and/or previous partner since the age of 15.

Women’s experience of abuse and witnessing violence before the age of 15 by whether experienced partner violence since the age of 15

Experienced abuse before the age of 15

Around one in three women who experienced abuse before the age of 15 experienced partner violence as an adult (36% or 535,800). These women were nearly three times more likely to experience partner violence as an adult than women who had not experienced abuse before the age of 15 (36% compared to 13% or 989,400). Refer to Table 30.

  1. Experienced physical and/or sexual abuse before the age of 15.
  2. Experienced violence by a current and/or previous partner since the age of 15.

Witnessed violence towards a parent by a partner before the age of 15

One in eight women witnessed violence towards their mother by a partner before the age of 15 (13% or 1.2 million). Endnote 4 These women were more than twice as likely to experience partner violence (after the age of 15) than women who had not witnessed violence towards their mother by a partner (34% compared to 15%). Refer to Table 30.

One in twenty women witnessed violence towards their father by a partner before the age of 15 (4.7% or 440,900). Endnote 4 These women were nearly twice as likely to experience partner violence as an adult than women who had not witnessed violence towards their father by a partner (31% compared to 17%).

  1. Witnessed violence towards mother by a partner before the age of 15.
  2. Experienced violence by a current and/or previous partner since the age of 15.
  1. Witnessed violence towards father by a partner before the age of 15.
  2. Experienced violence by a current and/or previous partner since the age of 15.

Endnotes

Endnote 1

Current rates of child abuse cannot be determined in the PSS as the survey only interviews persons aged 18 years and over. For more information, refer to Abuse before the Age of 15 page of the Personal Safety Survey, Australia: User Guide, 2016 (cat. no. 4906.0.55.003).

Endnote 2

‘Relationship to perpetrator’ proportions provided in this section are produced from published figures in Table 31.

Endnote 3

‘Partner violence since the age of 15’ refers to any incident of sexual assault, sexual threat, physical assault or physical threat by a person the respondent lives with, or lived with at some point, in a married or de facto relationship. Refer to the Glossary for further information on the definitions of violence.

Endnote 4

‘Whether witnessed violence against parents’ prevalence proportions are produced from published figures in Table 30.

Experience of stalking

The 2016 Personal Safety Survey (PSS) collected information from men and women aged 18 years and over about their experience of stalking by a male and by a female since the age of 15.

In the PSS, stalking is defined as any unwanted contact or attention on more than one occasion that could have caused fear or distress, or multiple types of unwanted contact or behaviour experienced on one occasion only that could have caused fear or distress. Behaviours used to define stalking episodes for the 2016 PSS were:

  • loitered or hung around outside their home
  • loitered or hung around outside their workplace, school or education facility
  • loitered or hung around outside their place of leisure/social activities
  • followed or watched them in person
  • followed or watched them using an electronic tracking device (e.g. GPS tracking system, computer spyware)
  • maintained unwanted contact with them by phone, postal mail, email, text messages or social media websites
  • posted offensive or unwanted messages, images or personal information on the internet about them
  • impersonated them online to damage their reputation
  • hacked or accessed their email, social media or other online account without their consent to follow or track them
  • gave or left them objects where they could be found that were offensive or disturbing
  • interfered with or damaged any of their property.
     

For more information on Stalking, refer to the Stalking page of the Personal Safety Survey, Australia: User Guide, 2016 (cat. no. 4906.0.55.003).

Experience of stalking since the age of 15

Overall, women were more likely to have experienced stalking than men. An estimated 1 in 6 women (17% or 1.6 million) and 1 in 15 men (6.5% or 587,000) experienced an episode of stalking since the age of 15. Refer to Table 34.
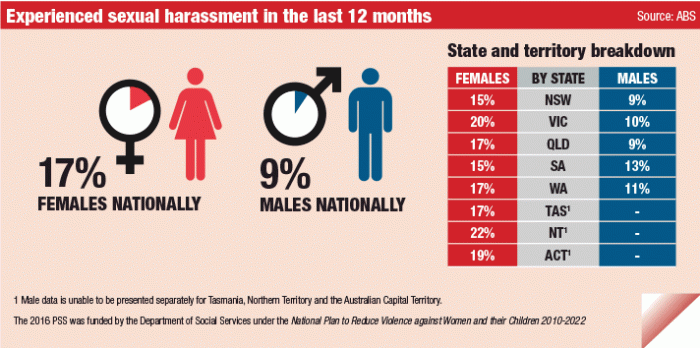
  1. People may have been stalked by both a male and female perpetrator. Therefore components may not add to the total.

Of the estimated 1.6 million women aged 18 years and over who had experienced an episode of stalking since the age of 15, 94% of these women (1.5 million) were stalked by a male and approximately 10% (160,700) were stalked by a female.

Men who had experienced an episode of stalking (587,000) were as likely to have experienced stalking by a male stalker 54% (316,700) as by a female stalker 51% (300,100). Endnote 1

Stalking in the last 12 months

In the 12 months prior to the survey, an estimated 3.1% of all women aged 18 years and over (288,200) and 1.7% of all men aged 18 years and over (153,600) experienced an episode of stalking. Refer to Table 34.

Both men and women were more likely to have experienced stalking by a male than by a female. Of the men and women who had experienced an episode of stalking in the last 12 months:

  • 88% of women had been stalked by a male compared to 15% who had been stalked by a female
  • 69% of men had been stalked by a male compared to 36% who had been stalked by a female.
     

Most recent episode of stalking since the age of 15

Relationship to perpetrator in the most recent episode

Women were more likely to have experienced an episode of stalking by someone they knew than by a stranger. An estimated 75% of women (1.1 million) who experienced stalking by a male and 89% of women (143,100) who experienced stalking by a female knew their most recent stalker. Refer to Table 35.

An estimated 95% of men (286,300) who experienced stalking by a female knew their most recent stalker. Refer to Table 36.

Men were just as likely to be stalked by a known male as by a male stranger in the most recent episode of stalking.

Types of stalking behaviours experienced by women in the most recent episode (endnote 2)

Of the women who experienced an episode of stalking by a male (1.5 million), the most common stalking behaviours experienced in the most recent episode were:

  • maintained unwanted contact by phone, postal mail, email, text messages or social media websites (50% or 747,500)
  • loitered or hung around outside their home (47% or 691,200)
  • followed or watched them in person (42% or 627,300).
     

Of the women who experienced an episode of stalking by a female (160,700), the most common stalking behaviour experienced in the most recent episode was:

  • maintained unwanted contact by phone, postal mail, email, text messages or social media websites (58% or 92,500).
     

Refer to Table 35.

  1. Most recent episode of stalking since the age of 15.
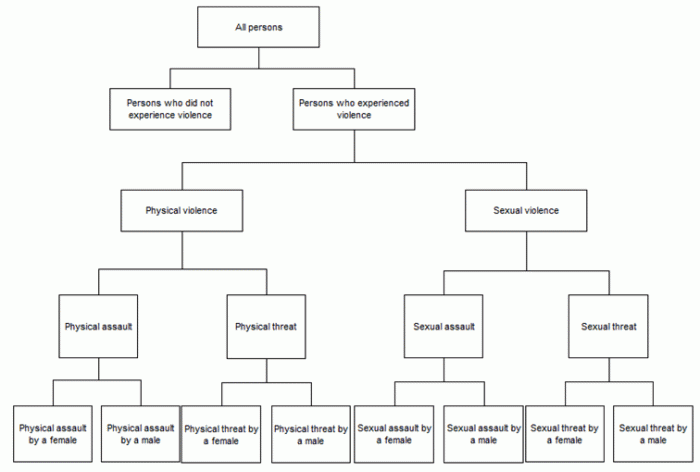
  2. Not all stalking behaviours shown.
  3. People may have experienced more than one stalking behaviour and/or experienced stalking by a male and a female. Therefore components may sum to more than 100% and cannot be summed to produce totals.
  4. Maintained unwanted contact by phone, postal mail, email, text messages or social media websites.
  5. Posted offensive or unwanted messages, images or personal information on the internet about them.

Types of stalking behaviours experienced by men in the most recent episode (endnote 2)

Of the men who experienced an episode of stalking by a male (316,700), the most common stalking behaviours experienced in the most recent episode were:

  • loitered or hung around outside their home (43% or 135,200)
  • maintained unwanted contact by phone, postal mail, email, text messages or social media websites (38% or 119,300)
  • followed or watched them in person (26% or 81,200)
  • interfered with or damaged their property (24% or 74,400).
     

Of the men who experienced an episode of stalking by a female (300,100), the most common stalking behaviours experienced in the most recent episode were:

  • maintained unwanted contact by phone, postal mail, email, text messages or social media websites (57% or 171,500)
  • loitered or hung around outside their home (41% or 122,900)
  • followed or watched them in person (39% or 115,500).
     

Refer to Table 36.

  1. Most recent episode of stalking since the age of 15.
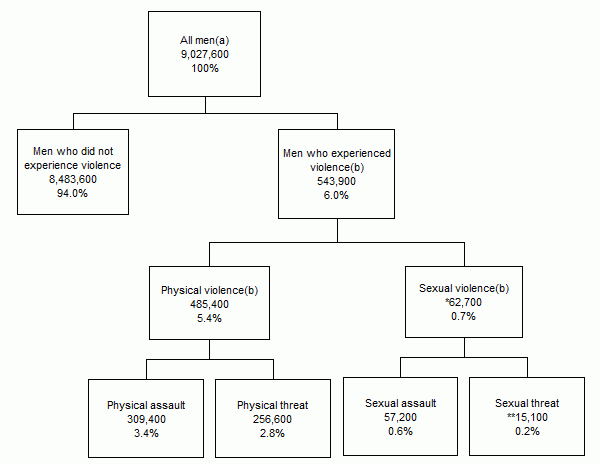
  2. Not all stalking behaviours shown.
  3. People may have experienced more than one stalking behaviour and/or experienced stalking by a male and a female. Therefore components may sum to more than 100% and cannot be summed to produce totals.
  4. Maintained unwanted contact by phone, postal mail, email, text messages or social media websites.

Most recent episode of stalking in the last 20 years

The remainder of this chapter refers to characteristics of the most recent episode of stalking that occurred in the last 20 years, by male and female stalkers.

Approximately 1.2 million women experienced their most recent episode of stalking by a male in the last 20 years, whilst approximately 146,600 experienced their most recent episode of stalking by a female during this period. Refer to Table 35.

For men, an estimated 282,400 experienced their most recent episode of stalking by a male in the last 20 years, whilst 256,700 experienced their most recent episode of stalking by a female during this period. Refer to Table 36.

Whether the most recent episode of stalking was perceived as a crime at the time

Half of all women who experienced stalking perceived their most recent episode as wrong but not a crime (48% of women (557,800) stalked by a male and 51% of women (74,200) stalked by a female). Refer to Table 35.

Men were less likely to perceive their most recent episode of stalking by a female as a crime (23% or 58,500) compared to being stalked by a male (49% or 139,600), and more likely to perceive it as something that just happens (27% of men (68,300) stalked by a female compared to 11% of men (30,900) stalked by a male). Refer to Table 36.

Whether police were contacted about the most recent episode of stalking

Women were more likely to contact the police about their most recent episode of stalking by a female stalker (37% or 54,400) than by a male stalker (29% or 337,300).

  1. Contacting the police includes where the police were contacted by the respondent or by someone else.
  2. Due to rounding and the effect of perturbation the sum of components may add to more than 100%. For more details, refer to Endnote 3.

Men were more likely to contact the police about their most recent episode of stalking by a male stalker (47% or 132,100) than by a female stalker (18% or 46,400). Refer to Table 37.

  1. Contacting the police includes where the police were contacted by the respondent or by someone else.
  2. Due to rounding and the effect of perturbation the sum of components may add to more than 100%. For more details, refer to Endnote 3.

Reasons for not contacting the police about the most recent episode of stalking (endnote 2)

For women who experienced stalking by a male, the most common reasons for not contacting the police for their most recent episode were:

  • feeling that they could deal with it themselves (44% or 364,800)
  • did not regard it as a serious offence (29% or 242,100).
     

For men who experienced stalking by a female, the most common reason for not contacting the police for their most recent episode was:

  • feeling that they could deal with it themselves (46% or 97,100).
     

Refer to Table 37.

Endnotes

Endnote 1

Frequencies of those who experienced stalking by a male and a female in this section are produced from published figures in Table 34.

Endnote 2

More than one response may have been given so proportions may sum to more than 100%.

Endnote 3

To minimise the risk of identifying individuals in aggregate statistics, perturbation has been applied. Perturbation involves a small random adjustment of the statistics and is considered the most satisfactory technique for avoiding the release of identifiable statistics while maximising the range of information that can be released. However as a result, these random adjustments of estimates may result in the sum of components not equalling the total or subtotal. For more details, refer to the Methodology of this publication.

Experience of sexual harassment

The 2016 Personal Safety Survey (PSS) collected information about men’s and women’s experiences of selected types of sexual harassment by male and female perpetrators, for both lifetime experiences and the 12 months prior to the survey.

Sexual harassment was considered to have occurred when a person experienced or had been subjected to one or more selected behaviours which they found improper or unwanted, which made them feel uncomfortable, and/or were offensive due to their sexual nature. The sexual harassment behaviours included in the PSS were:

  • receiving indecent phone calls
  • receiving indecent texts, emails or post
  • indecent exposure
  • inappropriate comments about the person’s body or sex life
  • unwanted touching, grabbing, kissing or fondling
  • distributing or posting pictures or videos of the person, that were sexual in nature, without their consent
  • exposing the person to pictures, videos or materials which were sexual in nature that the persons did not wish to see.
     

For more information, including definitions of the sexual harassment behaviours, refer to the Sexual Harassment page of the Personal Safety Survey, Australia: User Guide, 2016 (cat. no. 4906.0.55.003).

Lifetime experience of selected types of sexual harassment

Overall, women aged 18 years and over were more likely to experience sexual harassment in their lifetime than men:

  • approximately one in two women (53% or 5 million) had experienced sexual harassment by a male or female perpetrator during their lifetime
  • an estimated one in four men (25% or 2.2 million) had experienced sexual harassment by any person throughout their lifetime. Refer to Table 32.
     
  1. People may have experienced sexual harassment by a male and a female. Components therefore may not add to the total.

Sex of perpetrator

Women were more likely to experience sexual harassment by a male perpetrator than by a female perpetrator. It is estimated that around one in two women (52% or 4.9 million) had experienced sexual harassment by a male perpetrator and approximately one in ten (11% or 989,900) women had experienced sexual harassment by a female perpetrator during their lifetime.

Men were as likely to be sexually harassed by a male perpetrator as by female perpetrator (16% or 1.5 million and 16% or 1.4 million, respectively).

Selected types of sexual harassment (endnote 1)

The most common forms of sexual harassment experienced were the same for both men and women.

Women’s experience of selected types of sexual harassment

Of the estimated 4.9 million women who experienced sexual harassment by a male perpetrator, the most commonly reported forms of sexual harassment were:

  • inappropriate comments about body or sex life (61% or 3 million)
  • unwanted touching grabbing, kissing or fondling (57% or 2.8 million)
  • indecent exposure (42% or 2.1 million).
     

Of the 989,900 women who experienced sexual harassment by a female perpetrator, the most commonly reported forms of sexual harassment were:

  • inappropriate comments about body or sex life (61% or 604,600)
  • unwanted touching, grabbing, kissing or fondling (24% or 238,800)
  • indecent text, email or post (20% or 200,200).
     
  1. People may have experienced more than one sexual harassment behaviour and/or experienced sexual harassment by a male and a female. Therefore components may sum to more than 100% and cannot be summed to produce totals.
  2. Not all types of sexual harassment shown.

Men’s experience of selected types of sexual harassment

An estimated 1.5 million men experienced sexual harassment by a male perpetrator in their lifetime. Of these men, the most commonly reported forms of sexual harassment were:

  • unwanted touching, grabbing, kissing or fondling (42% or 610,700)
  • inappropriate comments about body or sex life (41% or 603,600)
  • indecent exposure (26% or 377,900).
     

Approximately 1.4 million men experienced sexual harassment by a female perpetrator in their lifetime. Of these men, the most commonly reported forms of sexual harassment were:

  • unwanted touching, grabbing, kissing or fondling (50% or 714,200)
  • inappropriate comments about body or sex life (44% or 623,200)
  • indecent text, email or post (32% or 459,900).
     
  1. People may have experienced more than one sexual harassment behaviour and/or experienced sexual harassment by a male and a female. Therefore components may sum to more than 100% and cannot be summed to produce totals.
  2. Not all types of sexual harassment shown.

Experience of selected types of sexual harassment in the last 12 months

Women were more likely than men to have experienced sexual harassment in the 12 months prior to the survey. An estimated 17% of women (1.6 million) and 9.3% of men (836,700) aged 18 years and over had experienced one or more of the selected types of sexual harassment behaviours by any person in the 12 months prior to the survey. Refer to Table 32.

  1. Experiences by a male and/or female perpetrator.

Demographic characteristics of people who experienced sexual harassment in the last 12 months

In addition to collecting information for men and women about their experience of sexual harassment in the 12 months prior to the survey, the 2016 PSS also collected a range of information about their demographics. This included age, language, education, country of birth, disability status and state or territory of usual residence. Refer to Table 33.

The following selection of these characteristics are analysed here:

  • state or territory of usual residence
  • broad age groups
  • disability status.
     

Experience of sexual harassment in the last 12 months - current state or territory of usual residence

The PSS collects information about a person’s state or territory of usual residence. Note that this is not necessarily the state or territory in which the sexual harassment took place.

The Northern Territory, Victoria and South Australia were the only jurisdictions where the proportion of women who experienced sexual harassment in the 12 months prior to the survey differed from the national estimate (17% or 1.6 million):

  • in the Northern Territory, 22% of women (15,200) experienced sexual harassment
  • in Victoria, 20% of women (488,800) experienced sexual harassment
  • for South Australia, 15% of women (99,100) experienced sexual harassment.
     

Although the PSS was not designed to produce sexual harassment prevalence data at the state and territory level for men, some data was able to be produced for the larger states (for more information on sample design refer to the Methodology page of the Personal Safety Survey, Australia: User Guide, 2016 (cat. no. 4906.0.55.003)).

There was no significant difference in the prevalence of sexual harassment for men in South Australia (13%), Victoria (9.6%), Queensland (9.0%), or New South Wales (8.8%), when compared to the national estimate (9.3%).

Experience of sexual harassment in the last 12 months - broad age groups

For both men and women, younger age groups were more likely than older persons to experience sexual harassment in the 12 months prior to the survey. Refer to Table 33.

Compared to the national estimate for women (17% or 1.6 million):

  • Women aged 18-34 years were more likely to have experienced sexual harassment. An estimated 38% of women aged 18-24 years (421,400) and 25% of women aged 25-34 years (446,600) had experienced sexual harassment in the 12 months prior to the survey.
  • Women aged 45 years and over were less likely to have experienced sexual harassment. An estimated 15% of women aged 45-54 years (234,500), 10% of women aged 55-64 years (147,000) and 5% of women aged 65 years and over (86,200) had experienced sexual harassment in the 12 months prior to the survey.
     

Compared to the national estimate for men (9.3% or 836,700):

  • Men aged 18-34 years were more likely to have experienced sexual harassment. An estimated 16% of men aged 18-24 years (185,200) and 13% of men aged 25-34 years (226,700) had experienced sexual harassment in the 12 months prior to the survey.
  • Men aged 65 years and over were less likely to have experienced sexual harassment. An estimated 4% of men aged 65 years and over (62,100) experienced sexual harassment in the 12 months prior to the survey.
     
  1. Experiences by a male and/or female perpetrator.
  2. Refers to age at the time of survey.

Experience of sexual harassment in the last 12 months - disability status

The 2016 PSS collected information to determine whether or not someone had a disability or long-term health condition at the time of the survey. For more information about how disability was defined and potential under-representation of persons with a disability in the sample, refer to the Disability page of the Personal Safety Survey, Australia: User Guide, 2016 (cat. no. 4906.0.55.003).

Women with a disability or long-term health condition were more likely to experience sexual harassment in the 12 months prior to the survey than women without a disability or long-term health condition (19% or 561,300 compared to 17% or 1.1 million).

Men with a disability or long-term health condition were statistically just as likely to experience sexual harassment in the 12 months prior to the survey as men without a disability or long-term health condition (10% or 293,600 and 8.7% or 543,600 respectively).

Prevalence of sexual harassment since 2012

Between 2012 and 2016 there was a significant increase in the proportion of both men and women who experienced sexual harassment in the 12 months prior to the survey.

The proportion of women who experienced sexual harassment in the last 12 months, increased from 15% in 2012 to 17% in 2016. During the same time period, the proportion of men who experienced sexual harassment increased from 6.6% to 9.3%.

  1. Experiences by a male and/or female perpetrator.
  2. In order to accurately capture the emerging trends in experiences of sexual harassment (such as the use of information and communications technology), new sexual harassment behaviours have been specifically included in the 2016 PSS. Although these behaviours may have previously been collected as part of other categories, this should be considered when comparing sexual harassment prevalence rates between the 2012 and 2016 iterations of the survey. Refer to the Sexual Harassment chapter of the Personal Safety Survey, Australia: User Guide, 2016 (cat. no. 4906.0.55.003).

Endnotes

Endnote 1

More than one response may have been given so proportions may sum to more than 100%.

Experience of sexual harassment – current state or territory of residence

The PSS collects information about a person’s state or territory of usual residence at the time of interview, although this is not necessarily the state or territory in which the sexual harassment took place.

The PSS was not designed to produce violence prevalence data at the state and territory level for men, however, some data was able to be produced for the larger population states (New South Wales, Victoria, Queensland, South Australia and Western Australia). Care should still be used when interpreting this data. Endnote 1 For more information on Sample Design, refer to the Methodology page in the Personal Safety Survey, Australia: User Guide, 2016 (cat. no. 4906.0.55.003).

Women’s experience of sexual harassment in the last 12 months

In 2016, the proportion of women that experienced sexual harassment by a male perpetrator varied from 14% in New South Wales and South Australia, to 21% in the Northern Territory. Women were less likely to experience sexual harassment by a female, with the proportion varying from 3.5% in South Australia to 5.4% in the Northern Territory. Refer to Table 1 of the State and Territory Tables.

  1. In the 12 months prior to the survey.

Men’s experience of sexual harassment in the last 12 months

In 2016, the proportion of men that experienced sexual harassment by a female perpetrator varied from 5.6% in Victoria to 10% in South Australia. The proportion of men that experienced sexual harassment by a male perpetrator varied from 3.6% in Queensland to 6.3% in Victoria. Refer to Table 1 of the State and Territory Tables.

  1. In the 12 months prior to the survey.
  2. The PSS was not designed to produce prevalence data at the state and territory level for men, some data was able to be produced for the larger population states (New South Wales, Victoria, Queensland, South Australia and Western Australia).

Prevalence of sexual harassment since 2012 (endnote 2)

Between 2012 and 2016, Victoria and New South Wales were the only states that experienced a change in the proportion of women who experienced sexual harassment in the last 12 months. Refer to Table 2 of the State and Territory Tables.

  • In Victoria, the proportion of women who experienced sexual harassment by a male perpetrator increased from 14% in 2012 to 19% in 2016, whilst the proportion of women who experienced sexual harassment by a female perpetrator increased from 3.0% in 2012 to 4.7% in 2016.
  • In New South Wales, the proportion of women who experienced sexual harassment by a female perpetrator increased from 2.0% in 2012 to 4.0% in 2016.
     

Women aged 18 years and over, sexual harassment(a) by sex of perpetrator, states and territories, 2012 and 2016(b)

  1. Experience of sexual harassment in the 12 months prior to the survey.
  2. In order to accurately capture the emerging trends in experiences of sexual harassment (such as the use of information and communications technology), new sexual harassment behaviours have been specifically included in the 2016 PSS. Although these behaviours may have previously been collected as part of other categories, this should be considered when comparing sexual harassment prevalence rates between the 2012 and 2016 iterations of the survey. Refer to the Sexual Harassment chapter of the Personal Safety Survey, Australia: User Guide, 2016 (cat. no. 4906.0.55.003).

Between 2012 and 2016, the following states experienced an increase in the proportion of men who experienced sexual harassment:

  • In New South Wales, the proportion of men who experienced sexual harassment by a female perpetrator increased from 3.4% in 2012 to 6.6% in 2016.
  • In South Australia, the proportion of men who experienced sexual harassment by a female perpetrator increased from 3.3% in 2012 to 10% in 2016.
  • In Victoria, the proportion of men who experienced sexual harassment by a male perpetrator increased from 4.0% in 2012 to 6.3% in 2016.
     

Men aged 18 years and over, sexual harassment(a) by sex of perpetrator, selected states(b), 2012 and 2016(c)

  1. Experience of sexual harassment in the 12 months prior to the survey.
  2. Whilst the PSS was not designed to produce prevalence data at the state and territory level for men, some data was able to be produced for the larger population states (New South Wales, Victoria, Queensland, South Australia and Western Australia).
  3. In order to accurately capture the emerging trends in experiences of sexual harassment (such as the use of information and communications technology), new sexual harassment behaviours have been specifically included in the 2016 PSS. Although these behaviours may have previously been collected as part of other categories, this should be considered when comparing sexual harassment prevalence rates between the 2012 and 2016 iterations of the survey. Refer to the Sexual Harassment chapter of the Personal Safety Survey, Australia: User Guide, 2016 (cat. no. 4906.0.55.003).

Endnotes

Endnote 1

While data for men has been produced for the larger population states (New South Wales, Victoria, Queensland, South Australia and Western Australia), the reliability of this data may vary, and users should remain aware of RSEs and/or MoEs when interpreting this data.

Endnote 2

In order to accurately capture the emerging trends in experiences of sexual harassment (such as the use of information and communications technology), new sexual harassment behaviours have been specifically included in the 2016 PSS. Although these behaviours may have previously been collected as part of other categories, this should be considered when comparing sexual harassment prevalence rates between the 2012 and 2016 iterations of the survey.

Feelings of general safety

The 2016 Personal Safety Survey (PSS) collected information about men’s and women’s feelings of general safety, in the 12 months prior to the survey for the following situations:

  • waiting for and using public transport alone after dark
  • walking in their local area alone after dark
  • being home alone after dark.
     

For more information about the general feelings of safety information, refer to the General Safety page in the Personal Safety Survey, Australia: User Guide, 2016 (cat. no. 4906.0.55.003).

Waiting for and using public transport alone after dark (endnote 1)

The following section relates to all persons. Refer to Table 39.

Nationally, the proportion of men and women who waited for and used public transport alone after dark in the last 12 months has increased over the past decade:

  • In 2016, 41% of men waited for and used public transport alone after dark, compared to 34% in 2005.
  • For women, 27% reported waiting for and using public transport alone after dark in 2016, compared to approximately 22% in 2005.
     

Waiting for public transport

The following section relates to all persons who waited for public transport alone after dark. Refer to Table 40.

In 2016, men were more likely than women to feel safe waiting for public transport alone after dark in the last 12 months.

Between 2005 and 2016, the proportion of men and women who felt safe waiting for public transport alone after dark increased:

  • for men, this increased from 79% in 2005 to 87% in 2016, and
  • for women, this increased from 55% in 2005 to 68% in 2016.
     

Persons aged 18 years and over who waited for transport(a), felt safe(b) by sex, states and territories(c), 2005 to 2016

  1. Waited for public transport alone after dark in the 12 months prior to the survey. Public transport includes buses, trains, trams, taxis, and ferries.
  2. Felt safe waiting for public transport alone after dark in the 12 months prior to the survey.
  3. The PSS was not designed to produce prevalence data at the state and territory level for men, some data was able to be produced for the larger population states.

Using public transport

The following section relates to all persons who used public transport alone after dark. Refer to Table 40.

In 2016, men were more likely than women to feel safe using public transport alone after dark in the last 12 months.

Between 2005 and 2016, the proportion of men and women who felt safe using public transport alone after dark has increased:

  • for men this increased from 84% in 2005 to 91% in 2016, and
  • for women this increased from 68% in 2005 to 77% in 2016.
     
  1. Used public transport alone after dark in the 12 months prior to the survey.
  2. Public transport includes buses, trains, trams, taxis, and ferries.
  3. Felt safe using public transport alone after dark in the 12 months prior to the survey.

Reason for not using public transport

The following section relates to all persons. Refer to Table 39.

The proportion of people who did not use public transport after dark due to feeling unsafe has decreased over the last decade:

  • for men, this has decreased from 4.5% in 2005 to 2.8% in 2016, and
  • for women, this has decreased from 19% in 2005 to 14% in 2016.
     

Walking in the local area alone after dark

The following section relates to all persons. Refer to Table 39.

Persons who walked alone after dark

Between 2005 and 2016, men were more likely to walk in their local area alone after dark than women (68% of men and 39% of women in both 2005 and 2016).

Persons who walked alone after dark and felt unsafe

In 2016, an estimated one in thirteen women (7.7%) felt unsafe walking in their local area alone after dark in the last 12 months, compared to one in twenty men (5.1%).

The proportion of persons who felt unsafe walking in their local area alone after dark in the last 12 months decreased between 2005 and 2016 for both men (from 6.9% to 5.1%) and women (from 9.6% to 7.7%).

Persons who did not walk alone after dark because felt unsafe

In 2016, an estimated one in four women (26%) did not walk in their local area alone after dark in the last 12 months because they felt unsafe compared to one in twenty-four men (4.2%).

The proportion of women who did not walk in their local area alone after dark because they felt unsafe has decreased from 31% in 2005 to 26% in 2016. The proportion of men who did not walk alone after dark because they felt unsafe has remained stable during this same period (5.2% in 2005 compared to 4.2% in 2016).

Home alone after dark

The following section relates to all persons. Refer to Table 39.

In 2016, women were more likely to feel unsafe while at home alone after dark in the last 12 months compared to men (9.9% and 2.8% respectively).

The proportion of persons who felt unsafe while at home alone after dark in the last 12 months decreased between 2005 and 2016 for both men (from 3.8% to 2.8%) and women (from 13% to 9.9%).

Endnotes

Endnote 1

Public transport includes buses, trains, trams, taxis, and ferries.

Endnote 2

Local area is defined as the neighbourhood or suburb close to home.

Feelings of general safety - current state or territory of residence

The 2016 Personal Safety Survey (PSS) collected information about men’s and women’s feelings of general safety, in the 12 months prior to the survey for the following situations:

  • waiting for and using public transport alone after dark
  • walking in their local area alone after dark
  • being home alone after dark.
     

The 2016 Personal Safety Survey (PSS) collects information about a person’s state or territory of usual residence.

The PSS was not designed to produce data at the state and territory level for men, however, some data was able to be produced for the larger population states (New South Wales, Victoria, Queensland, South Australia and Western Australia). Care should still be used when interpreting this data. Endnote 1 For more information on Sample Design refer to the Methodology page in the Personal Safety Survey, Australia: User Guide, 2016 (cat. no. 4906.0.55.003).

Waiting for and using public transport alone after dark (endnote 2)

The following section relates to all persons. Refer to Table 5 (SA, WA, TAS, NT and ACT) and Table 6 (NSW, VIC and QLD) of the State and Territory Tables.

The proportion of men who waited for and used public transport alone after dark in the last 12 months increased, between 2005 and 2016, in the following states:

  • New South Wales (from 36% to 45%)
  • Victoria (from 37% to 46%)
  • South Australia (from 24% to 42%).
     

The proportion of women who waited for and used public transport alone after dark in the last 12 months increased, between 2005 and 2016, for the majority of states:

  • New South Wales (from 25% to 30%)
  • Victoria (from 24% to 33%)
  • South Australia (from 17% to 22%)
  • Western Australia (from 16% to 20%).
     

Waiting for public transport

The following section relates to all persons who waited for public transport alone after dark. Refer to Table 6 (SA, WA, TAS, NT and ACT) and Table 7 (NSW, VIC and QLD) of the State and Territory Tables.

The proportion of men who felt safe, waiting for public transport alone after dark in the last 12 months increased, between 2005 and 2016, in the following states:

  • New South Wales (from 79% to 88%)
  • Victoria (from 75% to 83%).
     

The proportion of women who felt safe waiting for public transport alone after dark increased, between 2005 and 2016, in the following states:

  • New South Wales (from 55% to 70%)
  • Victoria (from 53% to 68%)
  • Queensland (from 58% to 71%)
  • South Australia (from 49% to 59%)
  • Tasmania (from #58% to 71%).
     

# Proportion has a margin of error >10 percentage points, which should be considered when using this information.

Persons aged 18 years and over who waited for transport(a), felt safe(b) by sex, states and territories(c), 2005 to 2016

  1. Waited for public transport alone after dark in the 12 months prior to the survey. Public transport includes buses, trains, trams, taxis, and ferries.
  2. Felt safe waiting for public transport alone after dark in the 12 months prior to the survey.
  3. The PSS was not designed to produce prevalence data at the state and territory level for men, some data was able to be produced for the larger population states.
  1. Waited for public transport alone after dark in the 12 months prior to the survey. Public transport includes buses, trains, trams, taxis, and ferries.
  2. Felt safe waiting for public transport alone after dark in the 12 months prior to the survey.
  3. The PSS was not designed to produce prevalence data at the state and territory level for men, some data was able to be produced for the larger population states.

Using public transport

The following section relates to all persons who used public transport alone after dark. Refer to Table 6 (SA, WA, TAS, NT and ACT) and Table 7 (NSW, VIC and QLD) of the State and Territory Tables.

In 2016, the proportion of men who felt safe using public transport alone after dark in the last 12 months across all states and territories was similar to the proportion who felt safe nationally (91%) except in Queensland which was higher (95%).

For women, the proportion who felt safe using public transport alone after dark in the last 12 months across the states and territories was similar to the proportion who felt safe nationally (77%).

Between 2005 and 2016, the proportion of men who felt safe using public transport alone after dark in the last 12 months increased in the following states:

  • New South Wales (from 83% to 91%)
  • Queensland (from 88% to 95%).
     

The proportion of women who felt safe using public transport alone after dark in the last 12 months, increased, between 2005 and 2016, in the following states:

  • New South Wales (from 67% to 78%)
  • Victoria (from 65% to 74%).
     

Persons aged 18 years and over who used transport(a), felt safe(b) by sex, states and territories(c), 2005 to 2016

  1. Public transport includes buses, trains, trams, taxis, and ferries.
  2. Felt safe using public transport alone after dark in the 12 months prior to the survey.
  3. The PSS was not designed to produce prevalence data at the state and territory level for men, some data was able to be produced for the larger population states.

Reason for not using public transport

The following section relates to all persons. Refer to Table 5 (SA, WA, TAS, NT and ACT) and Table 6 (NSW, VIC and QLD) of the State and Territory Tables.

In 2016, the proportion of men who did not use public transport alone after dark during the last 12 months due to feeling unsafe was lower in Queensland compared to the proportion who felt unsafe nationally (1.7% compared to 2.8% respectively).

In 2016, Victoria (18%) and Western Australia (19%) had a higher proportion of women who did not use public transport alone after dark in the last 12 months due to feeling unsafe, compared to the proportion who felt unsafe nationally (14%). In contrast, the proportion in Queensland (10%), the Australian Capital Territory (10%), and Tasmania (7.8%) was lower.

Between 2005 and 2016, the proportion of men who did not use public transport after dark due to feeling unsafe decreased in the following states:

  • New South Wales (from 4.5% to 2.9%)
  • Queensland (from 3.7% to 1.7%).
     

The proportion of women who did not use public transport after dark due to feeling unsafe decreased, between 2005 and 2016, in the following states:

  • New South Wales (from 18% to 13%)
  • Queensland (from 16% to 10%)
  • South Australia (from 21% to 13%)
  • Tasmania (from 15% to 7.8%)
  • Victoria (from 21% to 18%)
  • Western Australia (from 26% to 19%).
     

Walking in the local area alone after dark (endnote 3)

The following section relates to all persons. Refer to Table 5 (SA, WA, TAS, NT and ACT) and Table 6 (NSW, VIC and QLD) of the State and Territory Tables.

Persons who walked alone after dark and felt unsafe

Over the last decade, the proportion of men who felt unsafe when walking alone in their local area after dark in the last 12 months decreased in New South Wales (from 8.0% in 2005 to 5.0% in 2016) and Queensland (from 6.8% in 2005 to 3.3% in 2016).

Between 2005 and 2016, the proportion of women who felt unsafe when walking alone in their local area after dark in the last 12 months decreased in the following states and territories:

  • New South Wales (from 9.3% to 6.5%)
  • Western Australia (from 9.1% to 6.5%)
  • Australian Capital Territory (from 11% to 7.3%).
     

Persons who did not walk alone after dark because felt unsafe

The proportion of men who did not walk alone in their local area after dark in the last 12 months because they felt unsafe remained stable, between 2005 and 2016, across the majority of states.

Between 2005 and 2016, the proportion of women who did not walk alone in their local area after dark in the last 12 months because they felt unsafe has decreased in the following states and territories:

  • New South Wales (from 29% to 23%)
  • Queensland (from 32% to 26%)
  • South Australia (from 36% to 27%)
  • Western Australia (from 36% to 28%)
  • Tasmania (from 27% to 20%)
  • Australian Capital Territory (from 30% to 20%).
     

Home alone after dark

The following section relates to all persons. Refer to Table 5 (SA, WA, TAS, NT and ACT) and Table 6 (NSW, VIC and QLD) of the State and Territory Tables.

Between 2005 and 2016, the proportion of men who felt unsafe when home alone after dark in the last 12 months only decreased in New South Wales (from 3.5% to 2.0%).

For the same period, the proportion of women who felt unsafe when home alone after dark in the last 12 months decreased in the following states and territories:

  • New South Wales (13% in 2005 to 8.7% in 2016)
  • Queensland (15% in 2005 to 10% in 2016)
  • South Australia (13% in 2005 to 9.3% in 2016)
  • Western Australia (14% in 2005 to 11% in 2016)
  • Tasmania (13% in 2005 to 8.1% in 2016)
  • Australian Capital Territory (12% in 2005 to 6.0% in 2016).
     

Persons aged 18 years and over, did not feel safe home alone(a) by sex, states and territories(b), 2005 to 2016

  1. Did not feel safe home alone after dark in the 12 months prior to the survey.
  2. The PSS was not designed to produce prevalence data at the state and territory level for men, some data was able to be produced for the larger population states.
  1. Did not feel safe home alone after dark in the 12 months prior to the survey.
  2. The PSS was not designed to produce prevalence data at the state and territory level for men, some data was able to be produced for the larger population states.

Endnotes

End note 1

While data for men has been produced for the larger population states (New South Wales, Victoria, Queensland, South Australia and Western Australia), the reliability of this data may vary, and users should remain aware of RSEs and/or MoEs when interpreting this data.

Endnote 2

Public transport includes buses, trains, trams, taxis, and ferries.

Endnote 3

Local area is defined as the neighbourhood or suburb close to home.

About the Personal Safety Survey

This publication presents results from the Australian Bureau of Statistics’ (ABS) 2016 Personal Safety Survey (PSS), conducted from November 2016 to June 2017. The survey was conducted in all states and territories and across urban, rural and remote (excl. very remote) areas of Australia, and included approximately 21,250 people.

The survey collected information from men and women aged 18 years and over about the nature and extent of violence experienced since the age of 15. It also collected detailed information about men's and women's experience of:

  • current and previous partner violence and emotional abuse since the age of 15
  • stalking since the age of 15
  • physical and sexual abuse before the age of 15
  • witnessing violence between a parent and partner before the age of 15
  • lifetime experience of sexual harassment
  • general feelings of safety.
     

This was the third time the PSS has been conducted. The PSS was last run by the ABS in 2012, and prior to that in 2005. The PSS is based on the design of the Women's Safety Survey (cat. no. 4128.0) which was conducted in 1996, and has been adapted to include men's experience of violence. This publication includes some comparisons with PSS 2005, 2012 and WSS 1996 data where appropriate.

The 2016 PSS meets the need for updated information on the nature and extent of violence experienced by men and women in Australia and other related information regarding people's safety at home and in the community that has not been collected since 2012.

The need for data on the prevalence of violence and sexual assault is discussed in The National Plan to Reduce Violence Against Women and their Children 2010-2022, and in the following ABS Information Papers:

The statistics presented in this publication are indicative of the extensive range of data available from the survey and demonstrate the analytical potential of the survey results. Full details about all the information collected in the 2016 PSS are provided in the Data Item List which can be accessed in the data downloads section of the Personal Safety Survey, Australia: User Guide 2016 (cat. no. 4906.0.55.003). Additional information may be made available by request, on a fee for service basis, through the National Information and Referral Service (NIRS), or on the Microdata products proposed to be released early in 2018.

For further details on the content and conduct of the survey please refer to the Personal Safety Survey, Australia: User Guide 2016 (cat. no. 4906.0.55.003). This guide includes information to assist users with interpreting and using the results of the survey, descriptions of the survey design and collection, and information on data quality.

Measuring violence

There are no generally agreed or accepted standards for defining what constitutes violence. In developing the concepts and definitions used in the survey, the ABS was assisted by a Survey Advisory Group, which included members with legal and crime research backgrounds. Where appropriate, the definitions used were based on actions which would be considered as offences under State and Territory criminal law.

The ABS publishes data relating to crime from different sources, including both administrative and survey data. Different methodologies result in different statistics. For example, statistics from police records are different from those reported in household surveys because not all incidents are reported to the police. Also, responses in surveys may be affected by the ways in which questions are asked. Some of these measurement issues are discussed in: Measuring Victims of Crime: A Guide to Using Administrative and Survey data (cat. no. 4500.0.55.001).

Acknowledgements

ABS acknowledges the support and input of the Department of Social Services (DSS) which, under the National Plan to Reduce Violence Against Women and their Children, provided funding for the 2016 Personal Safety Survey.

A Survey Advisory Group provided the ABS with advice on the information to be collected and on some aspects of survey methodology. Members of this group included representatives from State and Commonwealth Government departments, crime research agencies, service providers and relevant academics.

The ABS would also like to thank the people who completed the survey. Their participation has contributed valuable information that will help to inform public debate about violence and will help further development of policies and programs aimed at reducing the prevalence of violence.

Data downloads

Prevalence of violence: Tables 1 to 7

Most recent incident of violence: Tables 8 to 16

The title of Table 12.1 and 12.2 in the 'Most Recent Incident of violence' data cube has been updated to include reference to 'in the last 12 months'. No other changes have been made to this data cube.

Experience of partner violence: Tables 17 to 26

Experience of partner emotional abuse: Tables 27 to 29

Abuse before the age of 15: Tables 30 and 31

Sexual harassment: Tables 32 and 33

Experience of stalking: Tables 34 to 38

General safety: Tables 39 and 40

Tables 39.1 and 39.2 have been updated to include sub-totals for the four data items presented. These new sub-totals are:

  • "Used public transport alone after dark in the last 12 months" for Feelings of safety using public transport alone after dark in the last 12 months
  • "Waited for public transport alone after dark in the last 12 months" for Feelings of safety waiting for public transport alone after dark in the last 12 months
  • "Walked alone in the local area after dark in the last 12 months" for Feelings of safety walking in the local area alone after dark in the last 12 months
  • "Home alone after dark in the last 12 months" for Feelings of safety when at home alone after dark in the last 12 months.

Tables 39.1 and 39.2 have also been updated to include a footnotes which define what Public transport and Local area include.

Tables 40.1 and 40.2 are new tables which present changes over time for feelings of safety using or waiting for public transport data. Table 40.1 uses the "Used public transport alone after dark in the last 12 months" and "Waited for public transport alone after dark in the last 12 months" populations to calculate the "felt safe" and "felt unsafe" proportions. Table 40.2 presents the Margin of Error of these proportions.

New South Wales

Victoria

Queensland

South Australia

Western Australia

Tasmania

Northern Territory

Australian Capital Territory

Characteristics and outcomes of childhood abuse - Tables 41 to 47

All data cubes

History of changes

Show all

18/10/2022 - Added 'Related publications' section

06/05/2019 - Additional content

‘Characteristics and outcomes of childhood abuse’ chapter has been added.

‘Characteristics and outcomes of childhood abuse’ datacube has been added.

12/04/2018 - Additional Information

Additional chapters have been added pertaining to State and Territory data, related to Key Findings, Prevalence of violence over time, Experience of Partner Emotional Abuse and Experience of Sexual Harassment. In addition, new National and State and Territory chapters have been produced relating to Feelings of General Safety.

A data cube for each State and Territory has been added to the Data downloads section containing a selection of tables which supplement the national tables provided in the first release from Personal Safety, Australia.

23/03/2018 - Replacement Content

'General Safety' datacube has been updated - Table 39 has been updated with sub-population data (e.g. Used public transport alone after dark in the last 12 months). Table 40 has also been added to this datacube.

'Most Recent Incident of violence' datacube has been updated - there has been a revision to the title of Table 12 to clarify the reference period of the data (in the last 12 months).

The 'Prevalence of violence in the last 12 months - Current State or Territory of Usual Residence' chapter has been updated to remove the 'Additional State and Territory data will be released in the near future' statement in preparation for the upcoming State and Territory release.

The 'Methodology' has had the Products and Services/Microdata section revised in preparation for the upcoming release of the Microdata products.

Previous catalogue number

This release previously used catalogue number 4906.0

Related publications

The publications below are in-depth analytical articles using the 2016 Personal Safety Survey data and other related ABS data sources.

  • Domestic Violence: Experiences of Partner Emotional Abuse: statistics about partner emotional abuse, including prevalence, socio-demographic characteristics and associations with partner violence and childhood abuse
  • Sexual Harassment: statistics about sexual harassment, including prevalence socio-demographic characteristics, and intersections with other forms of violence and abuse
  • Sexual Violence - Victimisation: statistics about sexual assault and childhood sexual abuse, including prevalence, socio-demographic characteristics, police reporting and support seeking
  • Sexual Assault - Perpetrators: sexual assault statistics for offenders proceeded against by police, criminal court outcomes for defendants and prisoners in adult custody
  • Disability and Violence: statistics about assault, domestic violence, partner emotional abuse, sexual harassment and stalking for persons with disability
  • Partner Violence: statistics about women who have experienced partner violence, including socio-demographic characteristics, characteristics of the most recent incident of assault, separations from a violent partner and characteristics of partner violence  
  • Characteristics and outcomes of childhood abuse: statistics about childhood physical and sexual abuse, including prevalence, socio-demographic characteristics, and the relationship between childhood abuse and adult experiences of violence


Directory of Family, Domestic, and Sexual Violence Statistics, (2018): provides an online central reference point for publicly available family, domestic and sexual violence data sources, including metadata about the definitions, data items collected, collection methodology, scope and coverage of each data source.

Related ABS data sources for family, domestic and sexual violence

Additional statistics about victims of violence (including family, domestic and sexual violence) are published annually in:

Statistics about perpetrators of violence (including family, domestic and sexual violence) are published annually in:

Related conceptual papers and frameworks

The following papers provide context around measuring violence (including family, domestic and sexual violence) in Australia and the differences between available data sources:

Back to top of the page