Census of Population and Housing - Counts of Aboriginal and Torres Strait Islander Australians

This is not the latest release View the latest release

Counts of Aboriginal and Torres Strait Islander peoples from the 2016 Census of Population and Housing, including intercensal changes over time

Reference period
2016
Released
31/08/2017

Summary

This is the second release of the publication titled Census of Population and Housing Counts of Aboriginal and Torres Strait Islander Australians (cat. no. 2075.0). The first release took place in June 2012 and can be accessed via the ‘Previous releases' menu above.

The five-yearly Census of Population and Housing is the only comprehensive source of small area data about the Aboriginal and Torres Strait Islander population. The Census provides a wide range of socioeconomic indicators to support planning, administration, policy development and evaluation in the public and private sectors.

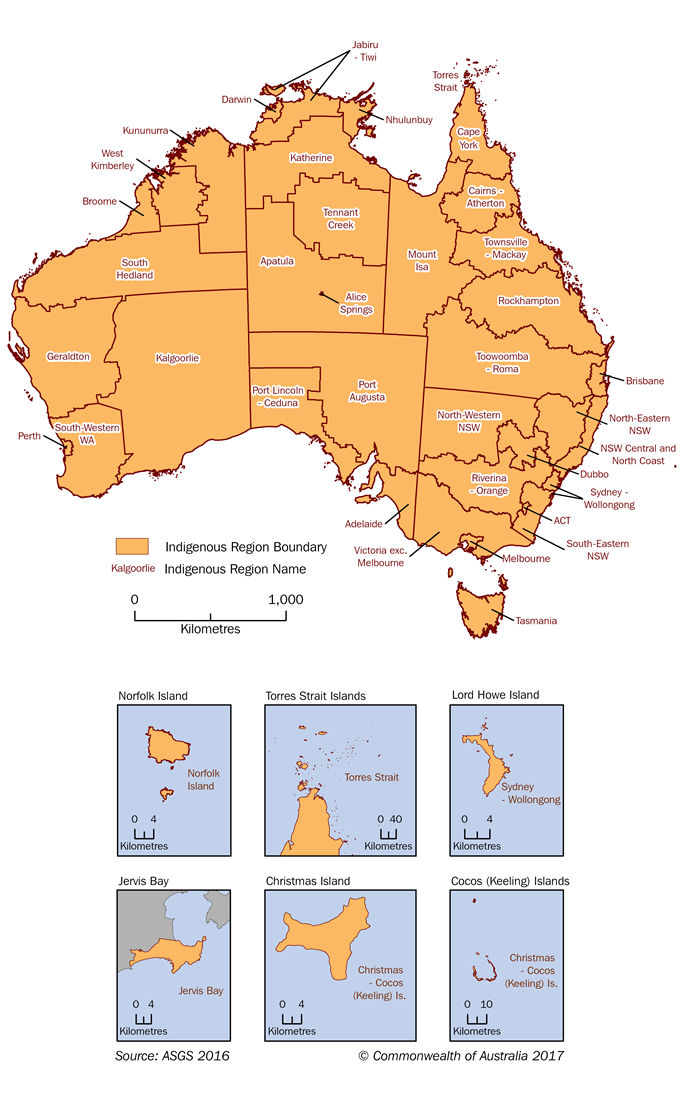
This release presents counts for Aboriginal and Torres Strait Islander peoples from the 2016 Census of Population and Housing. Counts are disaggregated by a range of ABS and non-ABS geographical structures (as set out in the Australian Statistical Geography Standard (ASGS), to satisfy different statistical purposes. Geographical structures used in this publication include:

ASGS ABS structures

ASGS Non-ABS structures

  • Commonwealth Electoral Divisions (CEDs)
  • Local Government Areas (LGAs)
     

This release also presents intercensal changes dating back to the 2001 Census of Population and Housing. Future updates of this publication will provide additional analysis on the characteristic of Aboriginal and Torres Strait Islander persons enumerated in the 2016 Census.

Counts by state/territory and capital city/rest of state

In 2016, there were 649,171 people identified as being of Aboriginal and/or Torres Strait Islander origin in the Census. Of these people, 91% (590,056 people) were of Aboriginal origin only, 5% (32,345 people) were of Torres Strait Islander origin only and 4% (26,767 people) identified as being of both Aboriginal and Torres Strait Islander origin. These proportions have changed very little in the last ten year period (see Data Cube 3, Table 3b). In the Northern Territory, just under 25% of the population identified as being of Aboriginal and/or Torres Strait Islander origin in the 2016 Census. In all other jurisdictions, 5% or less of the population were of Aboriginal and/or Torres Strait Islander origin. Victoria had the lowest proportion at 0.8% of the state total.

When a response to the Indigenous status question in the Census was not provided, a response of 'not stated' is recorded. When these people are excluded from the total population, the proportion of those identifying as Aboriginal and/or Torres Strait Islander increases slightly (between 0.1 and 0.3 percentage points) in all states and territories, with the exception of the Northern Territory which increases by 2.8 percentage points (see Data downloads section, Table 3a).

Census counts(a) by Indigenous status - state/territory, 2016

 Aboriginal and/or Torres Strait IslanderNon-IndigenousNot statedTotalAboriginal and/or Torres Strait Islander
State/TerritoryCount of PersonsProportion of Persons (%)Count of PersonsCount of PersonsCount of PersonsProportion of Persons (%)
New South Wales216 17633.36 826 286437 7627 480 2282.9
Victoria47 7887.45 532 275346 5635 926 6240.8
Queensland186 48228.74 211 020305 6854 703 1934.0
South Australia34 1845.31 557 00185 4641 676 6532.0
Western Australia75 97811.72 237 541160 8912 474 4103.1
Tasmania23 5723.6455 13731 255509 9654.6
Northern Territory58 2489.0147 32723 257228 83325.5
Australian Capital Territory6 5081.0370 74820 143397 3971.6
Total Australia(b)649 171100.021 341 2311 411 49123 401 8922.8

a. Usual residence, excludes overseas visitors.

b. Includes Other Territories, comprising Jervis Bay Territory, Cocos (Keeling) Islands, Christmas Island and Norfolk Island, Migratory-Offshore-Shipping, and No Usual Address.

Note: Please note that there are small random adjustments made to all cell values to protect the confidentiality of data. These adjustments may cause the sum of rows or columns to differ by small amounts from table totals. For further information see Census of Population and Housing: Census Dictionary, 2016 (cat. no. 2901.0).
 

Capital cities and rest of state

In the 2016 Census, just over one-third (35%) of the Aboriginal and Torres Strait Islander population lived in Capital City areas. States with relatively high proportions of Aboriginal and Torres Strait Islander people living in Capital Cities include South Australia (54%) and Victoria (50%). In contrast, 78% of the population who identified as being of Aboriginal and/or Torres Strait Islander origin in the Northern Territory lived outside the Capital City area. Likewise, in Queensland, 71% of the Aboriginal and Torres Strait Islander population lived outside of the Capital City area.

Census counts(a) by Indigenous status - capital city and rest of state, 2016

 Aboriginal and/or Torres Strait IslanderNon-IndigenousNot statedTotalProportion of Aboriginal and/or Torres Strait Islander Persons
Capital City/Rest of StateCount of PersonsCount of PersonsCount of PersonsCount of PersonsProportion of Persons (%)
New South Wales (NSW)     
Greater Sydney70 1354 493 490260 3644 823 99132.4
Rest of State145 1892 322 911175 4362 643 53667.2
No Usual Address8399 5281 91612 2880.4
Total NSW216 1766 826 286437 7627 480 228100
Victoria (Vic)     
Greater Melbourne24 0624 215 761245 3904 485 21150.4
Rest of State23 4441 310 270100 1031 433 81849.1
No Usual Address2796 2191 0697 5650.6
Total Vic47 7885 532 275346 5635 926 624100
Queensland (Qld)     
Greater Brisbane54 1582 093 128123 5172 270 80029.0
Rest of State131 5202 107 878180 3242 419 72470.5
No Usual Address7999 8861 82712 5100.4
Total Qld186 4824 211 020305 6854 703 193100
South Australia (SA)     
Greater Adelaide18 4031 216 62460 6891 295 71453.8
Rest of State15 530338 09624 445378 07445.4
No Usual Address2492 2793282 8630.7
Total SA34 1841 557 00185 4641 676 653100
Western Australia (WA)     
Greater Perth31 2141 801 031111 6121 943 85841.1
Rest of State44 169431 65748 341524 16758.1
No Usual Address5874 4978675 9500.8
Total WA75 9782 237 541160 8912 474 410100
Tasmania (Tas)     
Greater Hobart8 534201 46212 351222 35636.2
Rest of State14 983252 85018 791286 62763.6
No Usual Address557551049120.2
Total Tas23 572455 13731 255509 965100
Northern Territory (NT)     
Greater Darwin11 960110 00414 862136 82820.5
Rest of Territory45 59035 8627 99889 44378.3
No Usual Address6961 4023872 4891.2
Total NT58 248147 32723 257228 833100
Australian Capital Territory (ACT)     
Australian Capital Territory6 476370 29720 084396 85799.5
No Usual Address33454625380.5
Total ACT6 508370 74820 143397 397100
Total Australia(b)649 17121 341 2311 411 49123 401 892 

a. Usual residence, excludes overseas visitors.
b. Includes Other Territories, comprising Jervis Bay Territory, Cocos (Keeling) Islands, Christmas Island and Norfolk Island, and Migratory-Offshore-Shipping, and No Usual Address.

Note: Please note that there are small random adjustments made to all cell values to protect the confidentiality of data. These adjustments may cause the sum of rows or columns to differ by small amounts from table totals. For further information see Census of Population and Housing: Census Dictionary, 2016 (cat. no. 2901.0).
 

Age profile

In the 2016 Census, the Aboriginal and Torres Strait Islander population had a younger age distribution than the non-Indigenous population, reflecting higher fertility and lower life expectancy - a trend consistent with 2011 Census results. In 2016, the median age (the age at which half the population is older and half the population is younger) for Aboriginal and Torres Strait Islander people was 23 years (up from 21 years in 2011), compared with 38 years for non-Indigenous people (up from 37 years in 2011). The Northern Territory had the highest median age for Aboriginal and Torres Strait Islander people in both 2011 and 2016 (23 years and 25 years respectively). In 2016, New South Wales and Queensland had the lowest median age (22 years). For 2011 age profiles, see Census of Population and Housing - Counts of Aboriginal and Torres Strait Islander Australians, 2011 (cat. no. 2075.0).

Nationally, just over one-third of Aboriginal and Torres Strait Islander people counted in the 2016 Census were under 15 years of age (34%), while 5% were aged 65 years and over. The age profile of the Aboriginal and Torres Strait population varied only slightly between the states and territories. Queensland had the highest proportion of children aged under 15 years (35%). Tasmania had the highest proportion of older persons aged 65 years and over (6%).

Census counts(a) - Aboriginal and Torres Strait Islander people by state/territory and age, 2016

 Total PersonsPersons aged 0-14 yearsPersons aged 15-64 yearsPersons aged 65 years and overMedian age
State/TerritoryCount of PersonsProportion of Persons (%)Proportion of Persons (%)Proportion of Persons (%)Years
New South Wales216 17634.460.35.422
Victoria47 78833.361.55.323
Queensland186 48235.460.24.422
South Australia34 18433.462.04.623
Western Australia75 97833.462.44.223
Tasmania23 57233.060.86.224
Northern Territory58 24830.066.23.825
Australian Capital Territory6 50831.265.53.123
Total Australia(b)649 17134.061.34.823

a. Usual residence, excludes overseas visitors.
b. Includes Other Territories, comprising Jervis Bay Territory, Cocos (Keeling) Islands, Christmas Island and Norfolk Island, and Migratory-Offshore-Shipping, and No Usual Address.

Note: Please note that there are small random adjustments made to all cell values to protect the confidentiality of data. These adjustments may cause the sum of rows or columns to differ by small amounts from table totals. For further information see Census of Population and Housing: Census Dictionary, 2016 (cat. no. 2901.0).

Counts by Indigenous Region

The Indigenous Structure of the Australian Statistical Geography Standard (ASGS) provides a geographical standard for the publication of statistics about the Aboriginal and Torres Strait Islander population of Australia. Indigenous Regions (IREGs) are the highest level of the Indigenous Structure. IREGs are divided into Indigenous Areas (IAREs) (the second level of the Indigenous Structure) and these are then divided into smaller units known as Indigenous Locations (ILOCs), the third and lowest level of the Indigenous Structure.

In the 2016 Census, over half (59%) of the people who identified as being of Aboriginal and/or Torres Strait Islander origin lived in 10 of the 58 Indigenous Regions. The three largest regions were located on the Eastern seaboard of Australia: Brisbane (70,734 people), NSW Central and North Coast (69,772 people) and Sydney - Wollongong (66,023 people). These three regions accounted for 32% (206,529 out of 649,171 people) of the total Aboriginal and Torres Strait Islander count for Australia.

Census counts(a) - Indigenous regions with the highest counts of Aboriginal and Torres Strait Islander persons, 2016

Indigenous Region(b)Count of PersonsProportion of Persons (%)
Brisbane70 73410.9
NSW Central and North Coast69 77210.7
Sydney - Wollongong66 02310.2
Perth29 1184.5
Townsville - Mackay26 4784.1
Riverina - Orange24 9753.8
Cairns - Atherton24 4653.8
Adelaide24 2973.7
Victoria (exc. Melbourne)24 2083.7
Tasmania23 5213.6
Total Australia(c)649 1712.8

a. Usual residence, excludes overseas visitors.

b. For information about Indigenous Regions, see the Indigenous Structure of the Australian Statistical Geography Standard.

c. Includes all Indigenous Regions, Migratory-Offshore-Shipping, No Usual Address and Other Territories, comprising Jervis Bay Territory, Cocos (Keeling) Islands, Christmas Island and Norfolk Island.


Note: Please note that there are small random adjustments made to all cell values to protect the confidentiality of data. These adjustments may cause the sum of rows or columns to differ by small amounts from table totals. For further information see Census of Population and Housing: Census Dictionary, 2016 (cat. no. 2901.0).
 

Map of Indigenous Regions

Map of Australia showing Indigenous Region boundaries, including insets of islands including Norfolk Island, Torres Strait Islands, Lord Howe Island, Jervis Bay, Christmas Island and Cocos (Keeling) Islands.
Map of Australia showing indigenous region boundaries presented by state and territory, including insets of islands including Norfolk Island, Torres Strait Islands, Lord Howe Island, Jervis Bay, Christmas Island and Cocos (Keeling) Islands. State and territory Indigenous Region boundaries: New South Wales · Sydney - Wollongong · Riverina – Orange · Dubbo · North-Western NSW · NSW Central and North Coast · North Eastern NSW · South Eastern NSW Victoria · Melbourne · Victoria exc. Melbourne Queensland · Brisbane · Toowoomba – Roma · Rockhampton · Mount Isa · Townsville – Mackay · Cairns-Atherton · Cape York · Torres Strait South Australia · Adelaide · Port Augusta · Point Lincoln Ceduna Western Australia · Perth · South Western WA · Geraldton · Kalgoorlie · South Headland · Broome · West Kimberly · Kununurra Tasmania · Tasmania Northern Territory · Darwin · Alice Springs · Katherine · Jabiru Tiwi · Nhulumby · Tenant Creek · Apatula Australian Capital Territory · ACT

Indigenous Regions outside of Australia's major population centres had the highest proportion of Aboriginal and Torres Strait Islander people. Of the Indigenous Regions with the highest proportion of Aboriginal and Torres Strait Islander people, all Regions except for Jervis Bay were located in Northern Australia (including the Torres Strait).

Census counts(a) - Indigenous regions with the highest proportions of Aboriginal and Torres Strait Islander persons, 2016

Indigenous Region(b)Count of PersonsProportion of Persons (%)
Torres Strait6 62681.8
Jabiru - Tiwi10 40876.9
Apatula8 69976.8
Nhulunbuy9 55769.5
West Kimberley4 95964.4
Tennant Creek3 50563.3
Cape York9 45355.8
Jervis Bay20752.9
Katherine8 47147.1
Kununurra4 76145.7
Total Australia(c)649 1712.8

a. Usual residence, excludes overseas visitors.

b. For information about Indigenous Regions, see the Indigenous Structure of the Australian Statistical Geography Standard.

c. Includes all Indigenous Regions, Migratory-Offshore-Shipping, No Usual Address and Other Territories, comprising Jervis Bay Territory, Cocos (Keeling) Islands, Christmas Island and Norfolk Island.


Note: Please note that there are small random adjustments made to all cell values to protect the confidentiality of data. These adjustments may cause the sum of rows or columns to differ by small amounts from table totals. For further information see Census of Population and Housing: Census Dictionary, 2016 (cat. no. 2901.0).
 

Indigenous areas

In the 2016 Census, the Indigenous Areas with the highest proportion of Aboriginal and Torres Strait Islander people were in the Northern Territory and Queensland. Cherbourg in Queensland had the highest proportion of Aboriginal and Torres Strait Islander people (98%), followed by Laynhapuy - Gumatj Homelands in Eastern Arnhem Land and Yarrabah in Queensland (both 97%).

Census counts(a) - Indigenous areas with the highest proportions of Aboriginal and Torres Strait Islander persons, 2016

Indigenous Area(b)Count of PersonsProportion of Persons (%)
Cherbourg1 24998.4
Laynhapuy - Gumatj Homelands45097.4
Yarrabah2 49197.3
Kulkalgal - Central Islands94695.6
Gapuwiyak and Outstations94194.3
Ramingining - Milingimbi and Outstations2 18094.2
Alice Springs Town Camps96494.2
Meriam - Eastern Islands81294.1
Marthakal Homelands - Galiwinku2 31594.1
Palm Island2 29893.9
Ngukurr1 07993.9
Total Australia(c)649 1712.8

a. Usual residence, excludes overseas visitors.

b. For information about Indigenous Areas, see the Indigenous Structure of the Australian Statistical Geography Standard.

c. Includes all Indigenous Areas, Migratory-Offshore-Shipping, No Usual Address and Other Territories, comprising Jervis Bay Territory, Cocos (Keeling) Islands, Christmas Island and Norfolk Island.


Note: Please note that there are small random adjustments made to all cell values to protect the confidentiality of data. These adjustments may cause the sum of rows or columns to differ by small amounts from table totals. For further information see Census of Population and Housing: Census Dictionary, 2016 (cat. no. 2901.0).

Counts by state/territory and Indigenous location

In the 2016 Census, 59,116 people identified as being of Torres Strait Islander origin (including people identified as being both Torres Strait Islander and Aboriginal origin). Of these, almost two-thirds (64%) lived in Queensland. All states, with the exception of South Australia, experienced a growth in the number of persons identifying as Torres Strait Islander. Western Australia experienced the greatest growth - up from 2,608 persons in 2011 to 3,055 in 2016, representing a 17% increase. As a proportion of total State/Territory populations, the distribution of people who identified as Torres Strait Islander has remained stable in all of the States/Territories except for the Northern Territory, where the proportion has increased from 1.0% to 1.1%.

Census counts(a) - Torres Strait Islander persons(b) by state/territory, 2011 and 2016

 20112016
State/TerritoryCount of PersonsProportion of Persons (%)Proportion of State/Territory (%)Count of PersonsProportion of Persons (%)Proportion of State/Territory (%)
New South Wales8 01115.20.18 92315.10.1
Victoria3 0445.80.13 1975.40.1
Queensland32 92962.60.837 54063.50.8
South Australia1 5993.00.11 5702.70.1
Western Australia2 6085.00.13 0555.20.1
Tasmania1 8863.60.42 0043.40.4
Northern Territory2 2064.21.02 4414.11.1
Australian Capital Territory3260.60.13650.60.1
Total Australia(c)52 616100.00.259 116100.00.3

a. Usual residence, excludes overseas visitors.
b. Comprises people who are Torres Strait Islander and both Aboriginal and Torres Strait Islander in origin.
c. Includes Other Territories, comprising Jervis Bay Territory, Cocos (Keeling) Islands, Christmas Island and Norfolk Island, Migratory-Offshore-Shipping, and No Usual Address.


Note: Please note that there are small random adjustments made to all cell values to protect the confidentiality of data. These adjustments may cause the sum of rows or columns to differ by small amounts from table totals. For further information see Census of Population and Housing: Census Dictionary, 2016 (cat. no. 2901.0).


The Indigenous Regions with the largest count of people identifying as being of Torres Strait Islander origin were Cairns–Atherton (8,644 people or 15% of the Torres Strait Islander population), Brisbane (7,573 people or 13%) and Townsville–Mackay (7,122 people or 12%).

Census counts(a) - Indigenous regions with the highest counts of Torres Strait Islander persons(b), 2016

Indigenous Region(c)Count of PersonsProportion of Persons (%)
Cairns - Atherton8 64414.6
Brisbane7 57312.8
Townsville - Mackay7 12212.0
Torres Strait6 48911.0
Cape York3 6926.2
NSW Central and North Coast3 3225.6
Sydney - Wollongong2 9935.1
Rockhampton2 4914.2
Tasmania2 0013.4
Melbourne1 7132.9
Total Australia(d)59 116100.0

a. Usual residence, excludes overseas visitors.
b. Comprises people who are Torres Strait Islander and both Aboriginal and Torres Strait Islander in origin.
c. For information about Indigenous Regions, see the Indigenous Structure of the Australian Statistical Geography Standard.
d. Includes all Indigenous Regions, Migratory-Offshore-Shipping, No Usual Address and Other Territories, comprising Jervis Bay Territory, Cocos (Keeling) Islands, Christmas Island and Norfolk Island.


Note: Please note that there are small random adjustments made to all cell values to protect the confidentiality of data. These adjustments may cause the sum of rows or columns to differ by small amounts from table totals. For further information see Census of Population and Housing: Census Dictionary, 2016 (cat. no. 2901.0).


In the Torres Strait Indigenous Region there were 6,489 people of Torres Strait Islander origin, representing 80% of the population for the region. Within this region, the Indigenous Locations with the largest populations of Torres Strait Islander people were Port Kennedy and TRAWQ (Tamoi, Rose Hill, Applin, Wyborn and Quarantine) (1,123 and 826 people respectively), followed by Badu Island (697 people) and Mer (Murray) Island (429 people). See Data Cube 13, Table 13b for further information.

The Indigenous Location of Manunda - Portsmith in Cairns had the largest number of Torres Strait Islander people (2,355 people), followed by Mackay (1,817 people) and Townsville (1,668 people). The 20 most populous Indigenous Locations for Torres Strait Islander people were all within Queensland.

Census counts(a) - Indigenous locations with the highest counts of Torres Strait Islander persons(b), 2016

Indigenous Location(c)Count of PersonsProportion of Persons (%)
Manunda - Portsmith2 35510.2
Mackay1 8172.2
Townsville1 6681.7
Thuringowa1 6132.2
Port Kennedy (Thursday Island)1 12356.9
Edmonton1 0826.0
Bamaga and Surrounds93378.5
TRAWQ (Thursday Island)82685.9
Gold Coast7950.1
Cairns – White Rock – Mt Sheridan7915.9
Total Australia(d)59 1160.3

a. Usual residence, excludes overseas visitors.
b. Comprises people who are Torres Strait Islander and both Aboriginal and Torres Strait Islander in origin.
c. For information about Indigenous Locations, see the Indigenous Structure of the Australian Statistical Geography Standard.
d. Includes all Indigenous Locations, Migratory-Offshore-Shipping, No Usual Address and Other Territories, comprising Jervis Bay Territory, Cocos (Keeling) Islands, Christmas Island and Norfolk Island.


Note: Please note that there are small random adjustments made to all cell values to protect the confidentiality of data. These adjustments may cause the sum of rows or columns to differ by small amounts from table totals. For further information see Census of Population and Housing: Census Dictionary, 2016 (cat. no. 2901.0).

Counts by remoteness area

In the 2016 Census, there were 649,171 people across Australia who identified as being of Aboriginal and/or Torres Strait Islander origin, the majority (81%) of whom lived in non-remote areas of Australia.

Although Aboriginal and Torres Strait Islander people were more likely to be living in non-remote areas, they made up a greater proportion of the remote (25%) than non-remote (2%) population.

Indigenous status by remoteness area, 2016 (a)

 Aboriginal and/or Torres Strait IslanderNon-Indigenous
Remoteness AreaCount of Persons (no.)Proportion of Persons (%)Count of Persons (no.)Proportion of Persons (%)
Non-Remote526 00981.021 000 76698.4
Remote119 59518.4304 3941.4
Total Australia (b)649 171100.021 341 231100.0

a. Usual residence, excludes overseas visitors.
b. Includes Other Territories, comprising Jervis Bay Territory, Cocos (Keeling) Islands, Christmas Island and Norfolk Island, Migratory-Offshore-Shipping, and No Usual Address.

Source: ABS Census of Population and Housing, 2016
 

Remoteness area by Indigenous status, 2016 (a)

 Non-remoteRemote
 Count of Persons (no.)Proportion of Persons (%)Count of Persons (no.)Proportion of Persons (%)
Aboriginal and/or Torres Strait Islander526 0092.3119 59525.3
Non-Indigenous21 000 76691.8304 39464.3
Total Australia (b)(c)22 882 169100.0473 356100.0

a. Usual residence, excludes overseas visitors.
b. Includes Other Territories, comprising Jervis Bay Territory, Cocos (Keeling) Islands, Christmas Island and Norfolk Island, Migratory-Offshore-Shipping, and No Usual Address.
c. Includes Indigenous status Not Stated.

Source: ABS Census of Population and Housing, 2016
 

Remoteness area

The Remoteness Area structure of the Australian Statistical Geography Standard (ASGS) provides a geographical standard for the publication of statistics about the Aboriginal and Torres Strait Islander population of Australia. This structure is produced by dividing each state and territory into five classes of remoteness based on relative access to services. The five classes of remoteness for each state and territory can be aggregated to produce non-remote and remote areas of Australia.

The five classes of remoteness are:

  • Major Cities of Australia
  • Inner Regional Australia
  • Outer Regional Australia
  • Remote Australia
  • Very Remote Australia
     

In general, regions become less remote when urban centres increase in size and when the road networks between regions improve. Between 2011 and 2016, Major Cities have expanded to encapsulate regions that were initially inner regional in 2011, with these areas containing just over 100,000 people in 2016. For example, Wallacia was part of inner regional New South Wales in 2011, however in 2016 Wallacia is one of the major cities in New South Wales.

Changes between censuses

Looking at the distribution of Aboriginal and Torres Strait Islander people across remoteness areas in 2016 compared to 2011, we can see how people have moved between the areas. In 2016, there was an increase in people living in major cities and inner regional areas and an associated reduction in people living in outer regional and remote areas.

Aboriginal and Torres Strait Islander persons by remoteness area, 2006-2016 (a)

 200620112016Difference between 2016 and 2011
Remoteness Area (b)Proportion of Persons (%)Per cent (%)
Major Cities of Australia32.434.437.43.0
Inner Regional Australia21.822.124.01.9
Outer Regional Australia21.721.619.7-1.9
Remote Australia8.77.26.2-1.0
Very Remote Australia15.114.112.2-1.9

a. Usual residence, excludes overseas visitors.
b. Excludes Other Territories, comprising Jervis Bay Territory, Cocos (Keeling) Islands, Christmas Island and Norfolk Island, Migratory-Offshore-Shipping, and No Usual Address.

Source: ABS Census of Population and Housing, 2016
 

Over the last 10 years, the number of Australians identifying as Aboriginal and/or Torres Strait Islander has increased by 43 per cent. Growth in major cities and inner regional areas (29% and 28% respectively) was higher than the growth in remote and very remote areas (1% and 2% respectively).

Intercensal change (%) by remoteness area, Aboriginal and Torres Strait Islander persons, 2006-2016 (a)(b)

 2006 to 20112011 to 2016
Remoteness AreaIntercensal Change (%)
Major Cities of Australia28.028.6
Inner Regional Australia22.128.3
Outer Regional Australia20.17.9
Remote Australia0.91.1
Very Remote Australia12.72.4
Total Australia (c)20.518.4

a. Intercensal change is calculated using the change in counts of Aboriginal and Torres Strait Islander population over the Census periods.
b. Usual residence, excludes overseas visitors.
c. Includes Other Territories, comprising Jervis Bay Territory, Cocos (Keeling) Islands, Christmas Island and Norfolk Island, Migratory-Offshore-Shipping, and No Usual Address.

Source: ABS Census of Population and Housing, 2016
 

Remoteness

As seen above, the Aboriginal and Torres Strait Islander population has shifted toward urban areas over the last ten years. However, Aboriginal and Torres Strait Islander people are still more likely than other Australians to live outside of major cities.

In 2016, almost 4 in 10 (37%) Aboriginal and Torres Strait Islander people lived in major cities in 2016 compared to 72 per cent of other Australians. A further 24 per cent and 20 per cent lived in inner or outer regional areas respectively.

Almost 1 in 5 Aboriginal and Torres Strait Islander people lived in remote (6%) and very remote (12%) areas while around 1 in 100 non-Indigenous Australians lived in these areas (1% and 0.4% respectively).

Indigenous status by remoteness area, 2016 (a)

 Aboriginal and/or Torres Strait IslanderNon-Indigenous
Remoteness AreaCount of Persons (no.)Proportion of Persons (%)Count of Persons (no.)Proportion of Persons (%)
Major Cities of Australia242 52937.415 495 76872.6
Inner Regional Australia155 60224.03 809 56917.9
Outer Regional Australia127 87419.71 695 4307.9
Remote Australia40 2106.2211 2691.0
Very Remote Australia79 38312.293 1270.4
Total Australia (b)649 171100.021 341 231100.0

a. Usual residence, excludes overseas visitors.
b. Includes Other Territories, comprising Jervis Bay Territory, Cocos (Keeling) Islands, Christmas Island and Norfolk Island, Migratory-Offshore-Shipping, and No Usual Address.

Source: ABS Census of Population and Housing, 2016
 

States and territories

Across most states and territories, the Aboriginal and Torres Strait Islander population were less likely to live in major cities and inner regional areas than other Australians and more likely to live in remote or very remote areas.

In New South Wales and Queensland, where most Aboriginal and Torres Strait Islander people live, most people lived in major cities or regional areas. However, the remote and very remote population for both states was larger for Aboriginal and Torres Strait Islander people than other Australians (3% for New South Wales and 17% for Queensland).

More than half (58%) of the Aboriginal and Torres Strait Islander population of the Northern Territory lived in very remote areas compared to 6 per cent of the non-Indigenous population.

While a quarter of Aboriginal and Torres Strait Islander people in Western Australia lived in very remote areas, most (40%) lived in major cities. In contrast, 80 per cent of the non-Indigenous population lived in major cities and 2 per cent lived in very remote areas.

Remoteness Area (b)Major Cities of AustraliaInner Regional AustraliaOuter Regional AustraliaRemote AustraliaVery Remote Australia
 ABORIGINAL AND/OR TORRES STRAIT ISLANDER
 Proportion of Persons (%)
New South Wales46.434.515.32.60.9
Victoria51.834.912.60.1. .
Queensland33.822.226.55.911.1
South Australia51.910.722.03.810.8
Western Australia39.87.713.712.725.3
Tasmania. .56.240.72.10.8
Northern Territory. .. .20.520.757.5
Australian Capital Territory99.30.2. .. .. .
Total Australia (b)37.424.019.76.212.2
 NON-INDIGENOUS
 Proportion of Persons (%)
New South Wales75.918.35.30.30.0
Victoria77.418.53.90.1. .
Queensland64.719.813.31.20.7
South Australia74.212.89.92.50.5
Western Australia79.48.77.02.91.7
Tasmania. .68.329.61.40.5
Northern Territory. .. .74.718.26.1
Australian Capital Territory99.70.2. .. .. .
Total Australia (b)72.617.97.91.00.4

a. Usual residence, excludes overseas visitors.
b. Includes Other Territories, comprising Jervis Bay Territory, Cocos (Keeling) Islands, Christmas Island and Norfolk Island, Migratory-Offshore-Shipping, and No Usual Address.
. . Not Applicable

Source: ABS Census of Population and Housing, 2016

Data downloads

Table 01: Census counts and intercensal change, Indigenous status, 2001, 2006, 2011 and 2016

Table 02: Census counts of Aboriginal and Torres Strait Islander persons in local government areas, 2016

05/12/2018 - The datacube containing Aboriginal and Torres Strait Islander Census Counts by Local Government Area (LGA) has been updated to reflect minor boundary changes to five LGAs in Queensland and New South Wales.

Table 03: 2016 Census counts by state and territory, by Indigenous status 2016

Table 04: Census counts by Indigenous region, 2011 and 2016

Table 05: Census counts, Indigenous regions - New South Wales, 2016

Table 06: Census counts, Indigenous regions - Victoria, 2016

Table 07: Census counts, Indigenous regions - Queensland, 2016

Table 08: Census counts, Indigenous regions - South Australia, 2016

Table 09: Census counts, Indigenous regions - Western Australia, 2016

Table 10: Census counts, Indigenous regions - Tasmania, 2016

Table 11: Census counts, Indigenous regions - Northern Territory, 2016

Table 12: Census counts, Indigenous regions - Australian Capital Territory, 2016

Table 13: Census counts of Torres Strait Islander persons, 2006, 2011 and 2016

Table 14: Census counts of Aboriginal and Torres Strait Islander persons in commonwealth electoral divisions, 2016

Table 15: Census counts by Indigenous status - section of state 2016

12/01/2018 - This new datacube provides population counts and proportions for Aboriginal and Torres Strait Islander people broken down by state and section of state (urban and non-urban areas). A non-Indigenous comparison is also provided as well as data for the entire Australian population.

Table 16: Census counts by Indigenous status, remoteness, 2016

03/04/2018 - This new datacube provides population counts and proportions for Aboriginal and Torres Strait Islander people broken down by remoteness regions. A non-Indigenous comparison is also provided as well as data for the entire Australian population.

Table 17: Census counts by SEIFA index of advantage and disadvantage - state and territory and remoteness 2016

04/12/2018 - This new datacube provides population counts and proportions for Aboriginal and Torres Strait Islander people by the SEIFA Index of Advantage and Disadvantage, broken down by Remoteness areas and State and Territory.

All data cubes

History of changes

Show all

05/12/2018 - The datacube containing Aboriginal and Torres Strait Islander Census Counts by Local Government Area (LGA) was updated to reflect minor boundary changes to five LGAs in Queensland and New South Wales.

04/12/2018 - Publication was updated with an additional datacube providing population counts and proportions for Aboriginal and Torres Strait Islander people by the SEIFA Index of Advantage and Disadvantage, broken down by Remoteness areas and State and Territory.

29/08/2018 - The feature article for remoteness was updated to correct the figures for the proportion of non-Indigenous Australians in the Major Cities of Victoria and for the proportion of Aboriginal and Torres Strait Islander persons in non-remote areas

03/04/2018 - Publication was updated with an additional datacube and feature article containing information on remoteness.

12/01/2018 - Publication was updated with an additional datacube containing information on section of state.

Previous catalogue number

This release previously used catalogue number 2075.0.
 

Back to top of the page