Four additional monthly data series have been included under the Food and non-alcoholic beverages group:
- Bread and cereal products
- Dairy and related products
- Food products n.e.c.
- Non-alcoholic beverages
The monthly CPI indicator is a measure of inflation and includes statistics about prices for categories of households expenditure.
Four additional monthly data series have been included under the Food and non-alcoholic beverages group:
| Annual change (%) | |
|---|---|
| Nov-18 | 1.6 |
| Dec-18 | 1.5 |
| Jan-19 | 1.2 |
| Feb-19 | 1.5 |
| Mar-19 | 1.6 |
| Apr-19 | 1.8 |
| May-19 | 1.5 |
| Jun-19 | 1.4 |
| Jul-19 | 1.6 |
| Aug-19 | 1.6 |
| Sep-19 | 1.7 |
| Oct-19 | 1.8 |
| Nov-19 | 1.8 |
| Dec-19 | 2.2 |
| Jan-20 | 2.7 |
| Feb-20 | 2 |
| Mar-20 | 2.1 |
| Apr-20 | 0.1 |
| May-20 | -0.2 |
| Jun-20 | -0.1 |
| Jul-20 | 0.8 |
| Aug-20 | 1.1 |
| Sep-20 | 0.4 |
| Oct-20 | 0.5 |
| Nov-20 | 1.1 |
| Dec-20 | 0.3 |
| Jan-21 | 0.4 |
| Feb-21 | 1.1 |
| Mar-21 | 0.8 |
| Apr-21 | 2.5 |
| May-21 | 3.3 |
| Jun-21 | 3.5 |
| Jul-21 | 2.1 |
| Aug-21 | 2.5 |
| Sep-21 | 3.1 |
| Oct-21 | 3 |
| Nov-21 | 3.1 |
| Dec-21 | 3.4 |
| Jan-22 | 3.9 |
| Feb-22 | 4.8 |
| Mar-22 | 5.7 |
| Apr-22 | 5.5 |
| May-22 | 6.1 |
| Jun-22 | 6.7 |
| Jul-22 | 7 |
| Aug-22 | 6.9 |
| Sep-22 | 7.3 |
| Oct-22 | 6.9 |
| Nov-22 | 7.3 |
All groups monthly CPI indicator, Australia, annual movement (%)
["","Annual change"]
[["Nov-18","Dec-18","Jan-19","Feb-19","Mar-19","Apr-19","May-19","Jun-19","Jul-19","Aug-19","Sep-19","Oct-19","Nov-19","Dec-19","Jan-20","Feb-20","Mar-20","Apr-20","May-20","Jun-20","Jul-20","Aug-20","Sep-20","Oct-20","Nov-20","Dec-20","Jan-21","Feb-21","Mar-21","Apr-21","May-21","Jun-21","Jul-21","Aug-21","Sep-21","Oct-21","Nov-21","Dec-21","Jan-22","Feb-22","Mar-22","Apr-22","May-22","Jun-22","Jul-22","Aug-22","Sep-22","Oct-22","Nov-22"],[[1.6000000000000001],[1.5],[1.2],[1.5],[1.6000000000000001],[1.8],[1.5],[1.3999999999999999],[1.6000000000000001],[1.6000000000000001],[1.7],[1.8],[1.8],[2.2000000000000002],[2.7000000000000002],[2],[2.1000000000000001],[0.10000000000000001],[-0.20000000000000001],[-0.10000000000000001],[0.80000000000000004],[1.1000000000000001],[0.40000000000000002],[0.5],[1.1000000000000001],[0.29999999999999999],[0.40000000000000002],[1.1000000000000001],[0.80000000000000004],[2.5],[3.2999999999999998],[3.5],[2.1000000000000001],[2.5],[3.1000000000000001],[3],[3.1000000000000001],[3.3999999999999999],[3.8999999999999999],[4.7999999999999998],[5.7000000000000002],[5.5],[6.0999999999999996],[6.7000000000000002],[7],[6.9000000000000004],[7.2999999999999998],[6.9000000000000004],[7.2999999999999998]]]
[]
[{"axis_id":"0","tick_interval":"","axis_min":"","axis_max":"","axis_title":"","precision":-1,"axis_units":"","tooltip_units":"","table_units":"","data_unit_prefix":"","data_unit_suffix":"","reverse_axis":false}][{"value":"0","axis_id":"0","axis_title":"Percentage change (%)","axis_units":"","tooltip_units":"(%)","table_units":"(%)","axis_min":null,"axis_max":null,"tick_interval":null,"precision":"-1","data_unit_prefix":"","data_unit_suffix":"","reverse_axis":false}]Sept 21 to Sept 22 % change | Oct 21 to Oct 22 % change | Nov 21 to Nov 22 % change | |
|---|---|---|---|
| All groups CPI | 7.3 | 6.9 | 7.3 |
| Food and non-alcoholic beverages | 9.6 | 8.9 | 9.4 |
| Bread and cereal products | 11.8 | 12.0 | 12.0 |
| Meat & seafood | 7.6 | 7.9 | 8.1 |
| Dairy and related products | 13.6 | 14.4 | 15.3 |
| Fruit & vegetables | 17.4 | 9.4 | 9.5 |
| Food products n.e.c. | 10.6 | 10.9 | 10.9 |
| Non-alcoholic beverages | 10.4 | 11.2 | 11.0 |
| Alcohol and tobacco | 4.6 | 4.3 | 4.3 |
| Alcohol | 3.9 | 3.6 | 4.2 |
| Tobacco | 5.6 | 5.4 | 4.6 |
| Clothing and footwear | 7.1 | 5.7 | 4.1 |
| Housing | 10.3 | 10.5 | 9.6 |
| Rents | 2.9 | 3.5 | 3.6 |
| New dwelling purchases by owner-occupiers | 20.0 | 20.4 | 17.9 |
| Furnishings, household equipment and services | 7.7 | 7.8 | 8.4 |
| Health | 2.8 | 2.6 | 3.6 |
| Transport | 6.8 | 7.4 | 9.0 |
| Automotive fuel | 10.1 | 11.8 | 16.6 |
| Communications | 2.0 | 1.9 | 0.7 |
| Recreation and culture | 5.3 | 2.3 | 5.8 |
| Holiday travel and accommodation | 12.6 | 3.7 | 12.8 |
| Education | 4.5 | 4.5 | 4.6 |
| Insurance and financial services | 4.2 | 4.2 | 4.8 |
| CPI analytical series | |||
| Seasonally adjusted | 7.2 | 6.9 | 7.4 |
| Trimmed mean | 5.5 | 5.4 | 5.6 |
| All groups CPI excluding volatile items* | 6.8 | 6.4 | 6.7 |
*Volatile items are Fruit and vegetables and Automotive fuel
| Sep-22 (%) | Oct-22 (%) | Nov-22 (%) | |
|---|---|---|---|
| All groups | 7.3 | 6.9 | 7.3 |
| Food & non-alcoholic beverages | 9.6 | 8.9 | 9.4 |
| Alcohol & tobacco | 4.6 | 4.3 | 4.3 |
| Clothing & footwear | 7.1 | 5.7 | 4.1 |
| Housing | 10.3 | 10.5 | 9.6 |
| Furnishings, household equipment & services | 7.7 | 7.8 | 8.4 |
| Health | 2.8 | 2.6 | 3.6 |
| Transport | 6.8 | 7.4 | 9 |
| Communications | 2 | 1.9 | 0.7 |
| Recreation & culture | 5.3 | 2.3 | 5.8 |
| Education | 4.5 | 4.5 | 4.6 |
| Insurance & financial services | 4.2 | 4.2 | 4.8 |
Groups and All groups monthly CPI indicator, Australia, annual movement (%)
["","Sep-22","Oct-22","Nov-22"]
[["All groups","Food & non-alcoholic beverages","Alcohol & tobacco","Clothing & footwear","Housing","Furnishings, household equipment & services","Health","Transport","Communications","Recreation & culture","Education","Insurance & financial services"],[[7.2999999999999998],[9.5999999999999996],[4.5999999999999996],[7.0999999999999996],[10.300000000000001],[7.7000000000000002],[2.7999999999999998],[6.7999999999999998],[2],[5.2999999999999998],[4.5],[4.2000000000000002]],[[6.9000000000000004],[8.9000000000000004],[4.2999999999999998],[5.7000000000000002],[10.5],[7.7999999999999998],[2.6000000000000001],[7.4000000000000004],[1.8999999999999999],[2.2999999999999998],[4.5],[4.2000000000000002]],[[7.2999999999999998],[9.4000000000000004],[4.2999999999999998],[4.0999999999999996],[9.5999999999999996],[8.4000000000000004],[3.6000000000000001],[9],[0.69999999999999996],[5.7999999999999998],[4.5999999999999996],[4.7999999999999998]]]
[]
[{"axis_id":"0","tick_interval":"","axis_min":"","axis_max":"","axis_title":"","precision":-1,"axis_units":"","tooltip_units":"","table_units":"","data_unit_prefix":"","data_unit_suffix":"","reverse_axis":false}][{"value":"0","axis_id":"0","axis_title":"Percentage change (%)","axis_units":"","tooltip_units":"(%)","table_units":"(%)","axis_min":null,"axis_max":null,"tick_interval":null,"precision":"-1","data_unit_prefix":"","data_unit_suffix":"","reverse_axis":false}]New dwelling prices rose 17.9% in the year to November as builders passed through higher costs for labour and materials. The rate of price growth eased in November compared to the 20.4% annual rise in October. Fewer payments of government construction grants compared to November 2021 also contributed to the rise in new dwelling prices.
Rent prices increased further this month from an annual rise of 3.5% in October to 3.6% in November, reflecting a tight rental market.
| monthly change (%) | annual change (%) | |
|---|---|---|
| Nov-19 | 0 | -0.1 |
| Dec-19 | 0.2 | -0.1 |
| Jan-20 | 0.1 | 0.4 |
| Feb-20 | 0.4 | 0.8 |
| Mar-20 | -0.1 | 0.5 |
| Apr-20 | 0 | 0.7 |
| May-20 | -0.3 | 0.6 |
| Jun-20 | 0.5 | 1 |
| Jul-20 | 0.2 | 1.2 |
| Aug-20 | 0.2 | 1.8 |
| Sep-20 | 0 | 1.3 |
| Oct-20 | 0.2 | 1.4 |
| Nov-20 | 0.4 | 1.8 |
| Dec-20 | 0 | 1.6 |
| Jan-21 | 0.8 | 2.3 |
| Feb-21 | -1 | 0.9 |
| Mar-21 | -0.1 | 0.9 |
| Apr-21 | -0.9 | 0 |
| May-21 | 1.3 | 1.6 |
| Jun-21 | 0.8 | 1.9 |
| Jul-21 | 0.5 | 2.1 |
| Aug-21 | 2.1 | 4.1 |
| Sep-21 | 0.9 | 5 |
| Oct-21 | 0.2 | 5 |
| Nov-21 | 2.2 | 6.9 |
| Dec-21 | 2.5 | 9.6 |
| Jan-22 | 1.6 | 10.5 |
| Feb-22 | 1.6 | 13.4 |
| Mar-22 | 2 | 15.8 |
| Apr-22 | 2.2 | 19.3 |
| May-22 | 1.3 | 19.4 |
| Jun-22 | 1.9 | 20.7 |
| Jul-22 | 1.3 | 21.7 |
| Aug-22 | 1.1 | 20.5 |
| Sep-22 | 0.5 | 20 |
| Oct-22 | 0.5 | 20.4 |
| Nov-22 | 0.1 | 17.9 |
New dwelling purchase by owner occupiers, Australia, monthly and annual movement (%)
["","monthly change","annual change"]
[["Nov-19","Dec-19","Jan-20","Feb-20","Mar-20","Apr-20","May-20","Jun-20","Jul-20","Aug-20","Sep-20","Oct-20","Nov-20","Dec-20","Jan-21","Feb-21","Mar-21","Apr-21","May-21","Jun-21","Jul-21","Aug-21","Sep-21","Oct-21","Nov-21","Dec-21","Jan-22","Feb-22","Mar-22","Apr-22","May-22","Jun-22","Jul-22","Aug-22","Sep-22","Oct-22","Nov-22"],[[0],[0.20000000000000001],[0.10000000000000001],[0.40000000000000002],[-0.10000000000000001],[0],[-0.29999999999999999],[0.5],[0.20000000000000001],[0.20000000000000001],[0],[0.20000000000000001],[0.40000000000000002],[0],[0.80000000000000004],[-1],[-0.10000000000000001],[-0.90000000000000002],[1.3],[0.80000000000000004],[0.5],[2.1000000000000001],[0.90000000000000002],[0.20000000000000001],[2.2000000000000002],[2.5],[1.6000000000000001],[1.6000000000000001],[2],[2.2000000000000002],[1.3],[1.8999999999999999],[1.3],[1.1000000000000001],[0.5],[0.5],[0.10000000000000001]],[[-0.10000000000000001],[-0.10000000000000001],[0.40000000000000002],[0.80000000000000004],[0.5],[0.69999999999999996],[0.59999999999999998],[1],[1.2],[1.8],[1.3],[1.3999999999999999],[1.8],[1.6000000000000001],[2.2999999999999998],[0.90000000000000002],[0.90000000000000002],[0],[1.6000000000000001],[1.8999999999999999],[2.1000000000000001],[4.0999999999999996],[5],[5],[6.9000000000000004],[9.5999999999999996],[10.5],[13.4],[15.800000000000001],[19.300000000000001],[19.399999999999999],[20.699999999999999],[21.699999999999999],[20.5],[20],[20.399999999999999],[17.899999999999999]]]
[]
[{"axis_id":"0","tick_interval":"","axis_min":"","axis_max":"","axis_title":"","precision":-1,"axis_units":"","tooltip_units":"","table_units":"","data_unit_prefix":"","data_unit_suffix":"","reverse_axis":false}][{"value":"0","axis_id":"0","axis_title":"Percentage change (%)","axis_units":"","tooltip_units":"(%)","table_units":"(%)","axis_min":null,"axis_max":null,"tick_interval":null,"precision":"-1","data_unit_prefix":"","data_unit_suffix":"","reverse_axis":false}]Over the twelve months to November price rises were seen across all food categories. These rises reflect a range of price pressures including supply chain issues and increased input costs.
The main contributor to the annual rise was Meals out and take away foods, which rose 7.3% due to rising input costs, fresh food supply issues and labour shortages.
Fruit and vegetables rose 9.5% in the year to November. This subgroup continues to be impacted by flooding, heavy rainfall and hail in key growing areas, alongside high transport and fertiliser costs.
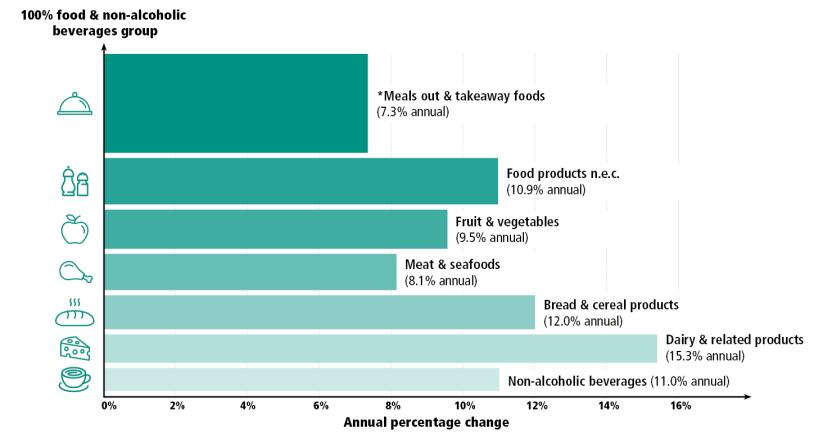
Food and non alcoholic beverages subgroups, Annual percentage change (%), ordered by percentage contribution to the Food and non alcoholic beverages group:
*Quarterly index, price updated in Nov (month2) – more information
Automotive fuel prices increased 16.6% in the twelve months to November, up from 11.8% in October.
The restoration of the Australian Government’s fuel excise on 29 September contributed to higher prices for automotive fuel in October and early November as the increase in fuel excise started to filter through as petrol stations used up their existing fuel reserves. Average prices for unleaded petrol peaked at $2.01 in early November before falling approximately 22 cents by the end of November.
| Daily average price of ULP (%) | Monthly average price of ULP (%) | |
|---|---|---|
| Mar20 | 126.5 | 127.1 |
| Apr-20 | 120.1 | 105.5 |
| Apr-20 | 119.8 | 105.5 |
| Apr-20 | 119.3 | 105.5 |
| Apr-20 | 116.3 | 105.5 |
| Apr-20 | 114.3 | 105.5 |
| Apr-20 | 112.7 | 105.5 |
| Apr-20 | 112.1 | 105.5 |
| Apr-20 | 115.4 | 105.5 |
| Apr-20 | 113.4 | 105.5 |
| Apr-20 | 109.8 | 105.5 |
| Apr-20 | 107.7 | 105.5 |
| Apr-20 | 104.8 | 105.5 |
| Apr-20 | 102.6 | 105.5 |
| Apr-20 | 102.5 | 105.5 |
| Apr-20 | 106.2 | 105.5 |
| Apr-20 | 106.2 | 105.5 |
| Apr-20 | 105.4 | 105.5 |
| Apr-20 | 103.2 | 105.5 |
| Apr-20 | 101.3 | 105.5 |
| Apr-20 | 99.8 | 105.5 |
| Apr-20 | 97.9 | 105.5 |
| Apr-20 | 102.5 | 105.5 |
| Apr-20 | 100.5 | 105.5 |
| Apr-20 | 97.4 | 105.5 |
| Apr-20 | 95.2 | 105.5 |
| Apr-20 | 93.6 | 105.5 |
| Apr-20 | 92.5 | 105.5 |
| Apr-20 | 92.3 | 105.5 |
| Apr-20 | 99.8 | 105.5 |
| Apr-20 | 100.1 | 105.5 |
| May-20 | 100.9 | 107.2 |
| May-20 | 99.4 | 107.2 |
| May-20 | 97.8 | 107.2 |
| May-20 | 96.2 | 107.2 |
| May-20 | 96.8 | 107.2 |
| May-20 | 104.1 | 107.2 |
| May-20 | 105.2 | 107.2 |
| May-20 | 104.7 | 107.2 |
| May-20 | 103.9 | 107.2 |
| May-20 | 106.3 | 107.2 |
| May-20 | 107.4 | 107.2 |
| May-20 | 108.5 | 107.2 |
| May-20 | 115.2 | 107.2 |
| May-20 | 115.3 | 107.2 |
| May-20 | 113.4 | 107.2 |
| May-20 | 111.1 | 107.2 |
| May-20 | 109.4 | 107.2 |
| May-20 | 108.7 | 107.2 |
| May-20 | 107.4 | 107.2 |
| May-20 | 112.3 | 107.2 |
| May-20 | 110.9 | 107.2 |
| May-20 | 108.9 | 107.2 |
| May-20 | 108.2 | 107.2 |
| May-20 | 109.1 | 107.2 |
| May-20 | 108.4 | 107.2 |
| May-20 | 107.4 | 107.2 |
| May-20 | 112.5 | 107.2 |
| May-20 | 110.9 | 107.2 |
| May-20 | 109.1 | 107.2 |
| May-20 | 108.1 | 107.2 |
| May-20 | 106.6 | 107.2 |
| Jun-20 | 106.2 | 118.9 |
| Jun-20 | 105.4 | 118.9 |
| Jun-20 | 111.6 | 118.9 |
| Jun-20 | 112.5 | 118.9 |
| Jun-20 | 112.5 | 118.9 |
| Jun-20 | 112.6 | 118.9 |
| Jun-20 | 116.4 | 118.9 |
| Jun-20 | 117.9 | 118.9 |
| Jun-20 | 119.1 | 118.9 |
| Jun-20 | 127.8 | 118.9 |
| Jun-20 | 127.5 | 118.9 |
| Jun-20 | 126.3 | 118.9 |
| Jun-20 | 124.2 | 118.9 |
| Jun-20 | 122.1 | 118.9 |
| Jun-20 | 120.5 | 118.9 |
| Jun-20 | 119.2 | 118.9 |
| Jun-20 | 124.3 | 118.9 |
| Jun-20 | 122.8 | 118.9 |
| Jun-20 | 120.7 | 118.9 |
| Jun-20 | 121.7 | 118.9 |
| Jun-20 | 121.0 | 118.9 |
| Jun-20 | 119.3 | 118.9 |
| Jun-20 | 118.2 | 118.9 |
| Jun-20 | 123.7 | 118.9 |
| Jun-20 | 122.6 | 118.9 |
| Jun-20 | 120.7 | 118.9 |
| Jun-20 | 119.0 | 118.9 |
| Jun-20 | 117.7 | 118.9 |
| Jun-20 | 116.8 | 118.9 |
| Jun-20 | 115.9 | 118.9 |
| Jul-20 | 123.5 | 124.3 |
| Jul-20 | 123.9 | 124.3 |
| Jul-20 | 122.9 | 124.3 |
| Jul-20 | 122.4 | 124.3 |
| Jul-20 | 122.5 | 124.3 |
| Jul-20 | 122.7 | 124.3 |
| Jul-20 | 121.9 | 124.3 |
| Jul-20 | 126.3 | 124.3 |
| Jul-20 | 126.6 | 124.3 |
| Jul-20 | 123.9 | 124.3 |
| Jul-20 | 121.5 | 124.3 |
| Jul-20 | 120.3 | 124.3 |
| Jul-20 | 119.6 | 124.3 |
| Jul-20 | 118.9 | 124.3 |
| Jul-20 | 125.3 | 124.3 |
| Jul-20 | 124.4 | 124.3 |
| Jul-20 | 125.6 | 124.3 |
| Jul-20 | 125.7 | 124.3 |
| Jul-20 | 126.4 | 124.3 |
| Jul-20 | 126.1 | 124.3 |
| Jul-20 | 124.9 | 124.3 |
| Jul-20 | 129.7 | 124.3 |
| Jul-20 | 127.7 | 124.3 |
| Jul-20 | 125.2 | 124.3 |
| Jul-20 | 123.3 | 124.3 |
| Jul-20 | 121.8 | 124.3 |
| Jul-20 | 120.0 | 124.3 |
| Jul-20 | 120.0 | 124.3 |
| Jul-20 | 128.7 | 124.3 |
| Jul-20 | 130.6 | 124.3 |
| Jul-20 | 129.6 | 124.3 |
| Aug-20 | 128.8 | 123.0 |
| Aug-20 | 128.3 | 123.0 |
| Aug-20 | 128.0 | 123.0 |
| Aug-20 | 126.3 | 123.0 |
| Aug-20 | 132.1 | 123.0 |
| Aug-20 | 129.8 | 123.0 |
| Aug-20 | 126.1 | 123.0 |
| Aug-20 | 122.2 | 123.0 |
| Aug-20 | 120.3 | 123.0 |
| Aug-20 | 119.3 | 123.0 |
| Aug-20 | 117.3 | 123.0 |
| Aug-20 | 123.5 | 123.0 |
| Aug-20 | 123.4 | 123.0 |
| Aug-20 | 120.7 | 123.0 |
| Aug-20 | 119.0 | 123.0 |
| Aug-20 | 118.7 | 123.0 |
| Aug-20 | 117.3 | 123.0 |
| Aug-20 | 115.3 | 123.0 |
| Aug-20 | 121.2 | 123.0 |
| Aug-20 | 120.2 | 123.0 |
| Aug-20 | 118.0 | 123.0 |
| Aug-20 | 116.8 | 123.0 |
| Aug-20 | 115.2 | 123.0 |
| Aug-20 | 115.4 | 123.0 |
| Aug-20 | 116.0 | 123.0 |
| Aug-20 | 125.5 | 123.0 |
| Aug-20 | 126.8 | 123.0 |
| Aug-20 | 127.2 | 123.0 |
| Aug-20 | 129.7 | 123.0 |
| Aug-20 | 132.0 | 123.0 |
| Aug-20 | 133.8 | 123.0 |
| Sep-20 | 132.6 | 122.7 |
| Sep-20 | 139.0 | 122.7 |
| Sep-20 | 136.7 | 122.7 |
| Sep-20 | 132.7 | 122.7 |
| Sep-20 | 129.3 | 122.7 |
| Sep-20 | 127.2 | 122.7 |
| Sep-20 | 125.5 | 122.7 |
| Sep-20 | 124.0 | 122.7 |
| Sep-20 | 129.7 | 122.7 |
| Sep-20 | 127.5 | 122.7 |
| Sep-20 | 124.4 | 122.7 |
| Sep-20 | 122.9 | 122.7 |
| Sep-20 | 122.1 | 122.7 |
| Sep-20 | 122.5 | 122.7 |
| Sep-20 | 121.9 | 122.7 |
| Sep-20 | 127.7 | 122.7 |
| Sep-20 | 125.1 | 122.7 |
| Sep-20 | 121.7 | 122.7 |
| Sep-20 | 118.4 | 122.7 |
| Sep-20 | 116.0 | 122.7 |
| Sep-20 | 113.9 | 122.7 |
| Sep-20 | 112.5 | 122.7 |
| Sep-20 | 119.0 | 122.7 |
| Sep-20 | 117.1 | 122.7 |
| Sep-20 | 114.7 | 122.7 |
| Sep-20 | 113.6 | 122.7 |
| Sep-20 | 114.8 | 122.7 |
| Sep-20 | 114.3 | 122.7 |
| Sep-20 | 113.9 | 122.7 |
| Sep-20 | 120.6 | 122.7 |
| Oct-20 | 121.9 | 121.8 |
| Oct-20 | 120.0 | 121.8 |
| Oct-20 | 117.6 | 121.8 |
| Oct-20 | 116.0 | 121.8 |
| Oct-20 | 114.2 | 121.8 |
| Oct-20 | 115.3 | 121.8 |
| Oct-20 | 122.6 | 121.8 |
| Oct-20 | 122.5 | 121.8 |
| Oct-20 | 120.7 | 121.8 |
| Oct-20 | 117.8 | 121.8 |
| Oct-20 | 117.5 | 121.8 |
| Oct-20 | 118.9 | 121.8 |
| Oct-20 | 118.4 | 121.8 |
| Oct-20 | 126.2 | 121.8 |
| Oct-20 | 124.9 | 121.8 |
| Oct-20 | 123.0 | 121.8 |
| Oct-20 | 120.1 | 121.8 |
| Oct-20 | 121.9 | 121.8 |
| Oct-20 | 123.3 | 121.8 |
| Oct-20 | 123.0 | 121.8 |
| Oct-20 | 131.6 | 121.8 |
| Oct-20 | 131.4 | 121.8 |
| Oct-20 | 127.4 | 121.8 |
| Oct-20 | 124.8 | 121.8 |
| Oct-20 | 123.1 | 121.8 |
| Oct-20 | 121.8 | 121.8 |
| Oct-20 | 119.2 | 121.8 |
| Oct-20 | 125.9 | 121.8 |
| Oct-20 | 124.0 | 121.8 |
| Oct-20 | 121.0 | 121.8 |
| Oct-20 | 119.6 | 121.8 |
| Nov-20 | 116.6 | 120.6 |
| Nov-20 | 114.7 | 120.6 |
| Nov-20 | 112.2 | 120.6 |
| Nov-20 | 120.4 | 120.6 |
| Nov-20 | 118.9 | 120.6 |
| Nov-20 | 117.1 | 120.6 |
| Nov-20 | 115.6 | 120.6 |
| Nov-20 | 114.9 | 120.6 |
| Nov-20 | 115.0 | 120.6 |
| Nov-20 | 116.5 | 120.6 |
| Nov-20 | 125.2 | 120.6 |
| Nov-20 | 126.1 | 120.6 |
| Nov-20 | 124.3 | 120.6 |
| Nov-20 | 121.6 | 120.6 |
| Nov-20 | 120.7 | 120.6 |
| Nov-20 | 120.6 | 120.6 |
| Nov-20 | 121.6 | 120.6 |
| Nov-20 | 129.1 | 120.6 |
| Nov-20 | 129.2 | 120.6 |
| Nov-20 | 127.5 | 120.6 |
| Nov-20 | 123.7 | 120.6 |
| Nov-20 | 122.1 | 120.6 |
| Nov-20 | 121.2 | 120.6 |
| Nov-20 | 119.7 | 120.6 |
| Nov-20 | 124.8 | 120.6 |
| Nov-20 | 122.6 | 120.6 |
| Nov-20 | 120.0 | 120.6 |
| Nov-20 | 117.0 | 120.6 |
| Nov-20 | 120.3 | 120.6 |
| Nov-20 | 120.3 | 120.6 |
| Dec-20 | 119.2 | 127.0 |
| Dec-20 | 125.0 | 127.0 |
| Dec-20 | 123.5 | 127.0 |
| Dec-20 | 122.1 | 127.0 |
| Dec-20 | 120.4 | 127.0 |
| Dec-20 | 119.4 | 127.0 |
| Dec-20 | 119.6 | 127.0 |
| Dec-20 | 119.6 | 127.0 |
| Dec-20 | 127.1 | 127.0 |
| Dec-20 | 125.9 | 127.0 |
| Dec-20 | 126.7 | 127.0 |
| Dec-20 | 125.6 | 127.0 |
| Dec-20 | 127.9 | 127.0 |
| Dec-20 | 127.8 | 127.0 |
| Dec-20 | 127.7 | 127.0 |
| Dec-20 | 136.2 | 127.0 |
| Dec-20 | 134.8 | 127.0 |
| Dec-20 | 133.4 | 127.0 |
| Dec-20 | 131.2 | 127.0 |
| Dec-20 | 130.6 | 127.0 |
| Dec-20 | 131.1 | 127.0 |
| Dec-20 | 129.1 | 127.0 |
| Dec-20 | 135.8 | 127.0 |
| Dec-20 | 133.3 | 127.0 |
| Dec-20 | 129.6 | 127.0 |
| Dec-20 | 126.5 | 127.0 |
| Dec-20 | 125.0 | 127.0 |
| Dec-20 | 124.3 | 127.0 |
| Dec-20 | 122.6 | 127.0 |
| Dec-20 | 128.7 | 127.0 |
| Dec-20 | 126.9 | 127.0 |
| Jan-21 | 124.0 | 128.7 |
| Jan-21 | 122.0 | 128.7 |
| Jan-21 | 121.9 | 128.7 |
| Jan-21 | 121.0 | 128.7 |
| Jan-21 | 119.8 | 128.7 |
| Jan-21 | 126.3 | 128.7 |
| Jan-21 | 124.6 | 128.7 |
| Jan-21 | 121.8 | 128.7 |
| Jan-21 | 118.9 | 128.7 |
| Jan-21 | 116.9 | 128.7 |
| Jan-21 | 115.3 | 128.7 |
| Jan-21 | 114.7 | 128.7 |
| Jan-21 | 123.0 | 128.7 |
| Jan-21 | 123.2 | 128.7 |
| Jan-21 | 122.8 | 128.7 |
| Jan-21 | 121.9 | 128.7 |
| Jan-21 | 124.1 | 128.7 |
| Jan-21 | 126.9 | 128.7 |
| Jan-21 | 130.3 | 128.7 |
| Jan-21 | 143.8 | 128.7 |
| Jan-21 | 145.9 | 128.7 |
| Jan-21 | 144.1 | 128.7 |
| Jan-21 | 140.2 | 128.7 |
| Jan-21 | 138.6 | 128.7 |
| Jan-21 | 138.4 | 128.7 |
| Jan-21 | 134.7 | 128.7 |
| Jan-21 | 143.0 | 128.7 |
| Jan-21 | 140.2 | 128.7 |
| Jan-21 | 136.3 | 128.7 |
| Jan-21 | 133.5 | 128.7 |
| Jan-21 | 133.1 | 128.7 |
| Feb-21 | 134.8 | 133.1 |
| Feb-21 | 133.3 | 133.1 |
| Feb-21 | 138.6 | 133.1 |
| Feb-21 | 136.3 | 133.1 |
| Feb-21 | 133.8 | 133.1 |
| Feb-21 | 130.7 | 133.1 |
| Feb-21 | 128.6 | 133.1 |
| Feb-21 | 126.2 | 133.1 |
| Feb-21 | 124.9 | 133.1 |
| Feb-21 | 131.2 | 133.1 |
| Feb-21 | 131.0 | 133.1 |
| Feb-21 | 129.7 | 133.1 |
| Feb-21 | 128.0 | 133.1 |
| Feb-21 | 129.0 | 133.1 |
| Feb-21 | 129.2 | 133.1 |
| Feb-21 | 128.8 | 133.1 |
| Feb-21 | 140.0 | 133.1 |
| Feb-21 | 137.7 | 133.1 |
| Feb-21 | 136.1 | 133.1 |
| Feb-21 | 133.2 | 133.1 |
| Feb-21 | 132.1 | 133.1 |
| Feb-21 | 133.4 | 133.1 |
| Feb-21 | 133.3 | 133.1 |
| Feb-21 | 140.4 | 133.1 |
| Feb-21 | 139.3 | 133.1 |
| Feb-21 | 137.1 | 133.1 |
| Feb-21 | 134.7 | 133.1 |
| Feb-21 | 134.4 | 133.1 |
| Mar-21 | 138.3 | 142.0 |
| Mar-21 | 139.9 | 142.0 |
| Mar-21 | 152.0 | 142.0 |
| Mar-21 | 150.2 | 142.0 |
| Mar-21 | 147.9 | 142.0 |
| Mar-21 | 145.2 | 142.0 |
| Mar-21 | 143.4 | 142.0 |
| Mar-21 | 140.3 | 142.0 |
| Mar-21 | 139.5 | 142.0 |
| Mar-21 | 147.1 | 142.0 |
| Mar-21 | 144.3 | 142.0 |
| Mar-21 | 141.4 | 142.0 |
| Mar-21 | 139.0 | 142.0 |
| Mar-21 | 139.7 | 142.0 |
| Mar-21 | 138.2 | 142.0 |
| Mar-21 | 137.6 | 142.0 |
| Mar-21 | 146.6 | 142.0 |
| Mar-21 | 144.6 | 142.0 |
| Mar-21 | 142.1 | 142.0 |
| Mar-21 | 139.0 | 142.0 |
| Mar-21 | 137.1 | 142.0 |
| Mar-21 | 135.9 | 142.0 |
| Mar-21 | 135.0 | 142.0 |
| Mar-21 | 143.2 | 142.0 |
| Mar-21 | 142.5 | 142.0 |
| Mar-21 | 140.6 | 142.0 |
| Mar-21 | 138.5 | 142.0 |
| Mar-21 | 138.9 | 142.0 |
| Mar-21 | 140.5 | 142.0 |
| Mar-21 | 140.5 | 142.0 |
| Mar-21 | 152.7 | 142.0 |
| Apr-21 | 152.8 | 144.2 |
| Apr-21 | 152.1 | 144.2 |
| Apr-21 | 150.3 | 144.2 |
| Apr-21 | 148.1 | 144.2 |
| Apr-21 | 146.9 | 144.2 |
| Apr-21 | 145.6 | 144.2 |
| Apr-21 | 152.9 | 144.2 |
| Apr-21 | 151.6 | 144.2 |
| Apr-21 | 149.7 | 144.2 |
| Apr-21 | 147.5 | 144.2 |
| Apr-21 | 146.0 | 144.2 |
| Apr-21 | 145.2 | 144.2 |
| Apr-21 | 143.0 | 144.2 |
| Apr-21 | 149.2 | 144.2 |
| Apr-21 | 145.9 | 144.2 |
| Apr-21 | 143.4 | 144.2 |
| Apr-21 | 140.6 | 144.2 |
| Apr-21 | 139.8 | 144.2 |
| Apr-21 | 138.6 | 144.2 |
| Apr-21 | 136.7 | 144.2 |
| Apr-21 | 143.3 | 144.2 |
| Apr-21 | 141.4 | 144.2 |
| Apr-21 | 139.8 | 144.2 |
| Apr-21 | 137.9 | 144.2 |
| Apr-21 | 138.2 | 144.2 |
| Apr-21 | 136.8 | 144.2 |
| Apr-21 | 136.3 | 144.2 |
| Apr-21 | 143.0 | 144.2 |
| Apr-21 | 141.7 | 144.2 |
| Apr-21 | 140.7 | 144.2 |
| May-21 | 138.0 | 143.2 |
| May-21 | 137.7 | 143.2 |
| May-21 | 139.1 | 143.2 |
| May-21 | 140.9 | 143.2 |
| May-21 | 147.9 | 143.2 |
| May-21 | 149.0 | 143.2 |
| May-21 | 147.3 | 143.2 |
| May-21 | 143.1 | 143.2 |
| May-21 | 142.2 | 143.2 |
| May-21 | 142.5 | 143.2 |
| May-21 | 144.6 | 143.2 |
| May-21 | 150.5 | 143.2 |
| May-21 | 148.8 | 143.2 |
| May-21 | 146.6 | 143.2 |
| May-21 | 144.0 | 143.2 |
| May-21 | 145.3 | 143.2 |
| May-21 | 144.4 | 143.2 |
| May-21 | 143.6 | 143.2 |
| May-21 | 149.8 | 143.2 |
| May-21 | 148.1 | 143.2 |
| May-21 | 144.8 | 143.2 |
| May-21 | 141.6 | 143.2 |
| May-21 | 140.3 | 143.2 |
| May-21 | 138.7 | 143.2 |
| May-21 | 137.5 | 143.2 |
| May-21 | 144.6 | 143.2 |
| May-21 | 142.9 | 143.2 |
| May-21 | 140.9 | 143.2 |
| May-21 | 138.3 | 143.2 |
| May-21 | 138.5 | 143.2 |
| May-21 | 139.1 | 143.2 |
| Jun-21 | 138.6 | 143.4 |
| Jun-21 | 148.3 | 143.4 |
| Jun-21 | 146.9 | 143.4 |
| Jun-21 | 145.1 | 143.4 |
| Jun-21 | 141.9 | 143.4 |
| Jun-21 | 141.4 | 143.4 |
| Jun-21 | 141.8 | 143.4 |
| Jun-21 | 141.2 | 143.4 |
| Jun-21 | 149.8 | 143.4 |
| Jun-21 | 147.8 | 143.4 |
| Jun-21 | 144.0 | 143.4 |
| Jun-21 | 140.2 | 143.4 |
| Jun-21 | 138.7 | 143.4 |
| Jun-21 | 138.9 | 143.4 |
| Jun-21 | 137.5 | 143.4 |
| Jun-21 | 145.3 | 143.4 |
| Jun-21 | 142.8 | 143.4 |
| Jun-21 | 140.5 | 143.4 |
| Jun-21 | 137.4 | 143.4 |
| Jun-21 | 136.5 | 143.4 |
| Jun-21 | 137.0 | 143.4 |
| Jun-21 | 137.7 | 143.4 |
| Jun-21 | 145.9 | 143.4 |
| Jun-21 | 146.6 | 143.4 |
| Jun-21 | 145.4 | 143.4 |
| Jun-21 | 144.0 | 143.4 |
| Jun-21 | 144.8 | 143.4 |
| Jun-21 | 147.2 | 143.4 |
| Jun-21 | 149.5 | 143.4 |
| Jun-21 | 159.0 | 143.4 |
| Jul-21 | 162.5 | 153.2 |
| Jul-21 | 160.6 | 153.2 |
| Jul-21 | 157.4 | 153.2 |
| Jul-21 | 157.1 | 153.2 |
| Jul-21 | 157.0 | 153.2 |
| Jul-21 | 157.0 | 153.2 |
| Jul-21 | 162.8 | 153.2 |
| Jul-21 | 159.8 | 153.2 |
| Jul-21 | 156.4 | 153.2 |
| Jul-21 | 153.2 | 153.2 |
| Jul-21 | 153.2 | 153.2 |
| Jul-21 | 152.7 | 153.2 |
| Jul-21 | 151.0 | 153.2 |
| Jul-21 | 155.6 | 153.2 |
| Jul-21 | 153.1 | 153.2 |
| Jul-21 | 150.6 | 153.2 |
| Jul-21 | 147.4 | 153.2 |
| Jul-21 | 145.6 | 153.2 |
| Jul-21 | 144.5 | 153.2 |
| Jul-21 | 143.8 | 153.2 |
| Jul-21 | 152.4 | 153.2 |
| Jul-21 | 150.9 | 153.2 |
| Jul-21 | 148.9 | 153.2 |
| Jul-21 | 146.4 | 153.2 |
| Jul-21 | 147.6 | 153.2 |
| Jul-21 | 147.8 | 153.2 |
| Jul-21 | 148.0 | 153.2 |
| Jul-21 | 159.1 | 153.2 |
| Jul-21 | 157.8 | 153.2 |
| Jul-21 | 155.2 | 153.2 |
| Jul-21 | 152.9 | 153.2 |
| Aug-21 | 152.0 | 152.6 |
| Aug-21 | 150.0 | 152.6 |
| Aug-21 | 148.8 | 152.6 |
| Aug-21 | 157.9 | 152.6 |
| Aug-21 | 155.9 | 152.6 |
| Aug-21 | 153.8 | 152.6 |
| Aug-21 | 151.2 | 152.6 |
| Aug-21 | 152.4 | 152.6 |
| Aug-21 | 154.6 | 152.6 |
| Aug-21 | 155.1 | 152.6 |
| Aug-21 | 163.6 | 152.6 |
| Aug-21 | 161.0 | 152.6 |
| Aug-21 | 156.9 | 152.6 |
| Aug-21 | 153.2 | 152.6 |
| Aug-21 | 151.3 | 152.6 |
| Aug-21 | 151.7 | 152.6 |
| Aug-21 | 150.5 | 152.6 |
| Aug-21 | 158.1 | 152.6 |
| Aug-21 | 155.7 | 152.6 |
| Aug-21 | 153.0 | 152.6 |
| Aug-21 | 149.5 | 152.6 |
| Aug-21 | 149.0 | 152.6 |
| Aug-21 | 150.5 | 152.6 |
| Aug-21 | 149.2 | 152.6 |
| Aug-21 | 157.1 | 152.6 |
| Aug-21 | 153.8 | 152.6 |
| Aug-21 | 150.7 | 152.6 |
| Aug-21 | 147.4 | 152.6 |
| Aug-21 | 146.2 | 152.6 |
| Aug-21 | 144.9 | 152.6 |
| Sep-21 | 145.7 | 152.6 |
| Sep-21 | 152.3 | 155.8 |
| Sep-21 | 150.2 | 155.8 |
| Sep-21 | 148.7 | 155.8 |
| Sep-21 | 146.7 | 155.8 |
| Sep-21 | 147.7 | 155.8 |
| Sep-21 | 148.5 | 155.8 |
| Sep-21 | 149.0 | 155.8 |
| Sep-21 | 159.2 | 155.8 |
| Sep-21 | 158.8 | 155.8 |
| Sep-21 | 157.6 | 155.8 |
| Sep-21 | 155.8 | 155.8 |
| Sep-21 | 155.9 | 155.8 |
| Sep-21 | 157.6 | 155.8 |
| Sep-21 | 157.3 | 155.8 |
| Sep-21 | 164.8 | 155.8 |
| Sep-21 | 162.3 | 155.8 |
| Sep-21 | 160.7 | 155.8 |
| Sep-21 | 157.9 | 155.8 |
| Sep-21 | 156.5 | 155.8 |
| Sep-21 | 157.7 | 155.8 |
| Sep-21 | 155.0 | 155.8 |
| Sep-21 | 164.3 | 155.8 |
| Sep-21 | 162.9 | 155.8 |
| Sep-21 | 159.8 | 155.8 |
| Sep-21 | 156.4 | 155.8 |
| Sep-21 | 155.0 | 155.8 |
| Sep-21 | 154.1 | 155.8 |
| Sep-21 | 152.3 | 155.8 |
| Sep-21 | 155.8 | 155.8 |
| Sep-21 | 154.1 | 155.8 |
| Oct-21 | 152.3 | 164.4 |
| Oct-21 | 150.8 | 164.4 |
| Oct-21 | 150.6 | 164.4 |
| Oct-21 | 149.5 | 164.4 |
| Oct-21 | 148.9 | 164.4 |
| Oct-21 | 158.4 | 164.4 |
| Oct-21 | 159.2 | 164.4 |
| Oct-21 | 160.4 | 164.4 |
| Oct-21 | 161.9 | 164.4 |
| Oct-21 | 161.2 | 164.4 |
| Oct-21 | 160.7 | 164.4 |
| Oct-21 | 161.0 | 164.4 |
| Oct-21 | 162.5 | 164.4 |
| Oct-21 | 164.1 | 164.4 |
| Oct-21 | 165.4 | 164.4 |
| Oct-21 | 165.0 | 164.4 |
| Oct-21 | 166.1 | 164.4 |
| Oct-21 | 167.9 | 164.4 |
| Oct-21 | 167.3 | 164.4 |
| Oct-21 | 174.4 | 164.4 |
| Oct-21 | 174.9 | 164.4 |
| Oct-21 | 174.8 | 164.4 |
| Oct-21 | 174.1 | 164.4 |
| Oct-21 | 174.1 | 164.4 |
| Oct-21 | 173.8 | 164.4 |
| Oct-21 | 172.5 | 164.4 |
| Oct-21 | 171.1 | 164.4 |
| Oct-21 | 169.9 | 164.4 |
| Oct-21 | 168.6 | 164.4 |
| Oct-21 | 167.4 | 164.4 |
| Oct-21 | 166.6 | 164.4 |
| Nov-21 | 165.8 | 168.6 |
| Nov-21 | 164.5 | 168.6 |
| Nov-21 | 170.4 | 168.6 |
| Nov-21 | 168.8 | 168.6 |
| Nov-21 | 167.9 | 168.6 |
| Nov-21 | 167.4 | 168.6 |
| Nov-21 | 167.6 | 168.6 |
| Nov-21 | 166.5 | 168.6 |
| Nov-21 | 166.7 | 168.6 |
| Nov-21 | 166.3 | 168.6 |
| Nov-21 | 165.1 | 168.6 |
| Nov-21 | 164.4 | 168.6 |
| Nov-21 | 163.2 | 168.6 |
| Nov-21 | 162.4 | 168.6 |
| Nov-21 | 162.0 | 168.6 |
| Nov-21 | 161.8 | 168.6 |
| Nov-21 | 170.9 | 168.6 |
| Nov-21 | 170.7 | 168.6 |
| Nov-21 | 169.9 | 168.6 |
| Nov-21 | 169.9 | 168.6 |
| Nov-21 | 171.7 | 168.6 |
| Nov-21 | 172.8 | 168.6 |
| Nov-21 | 174.0 | 168.6 |
| Nov-21 | 176.8 | 168.6 |
| Nov-21 | 176.2 | 168.6 |
| Nov-21 | 174.3 | 168.6 |
| Nov-21 | 171.9 | 168.6 |
| Nov-21 | 170.4 | 168.6 |
| Nov-21 | 169.7 | 168.6 |
| Nov-21 | 166.8 | 168.6 |
| Dec-21 | 172.8 | 159.8 |
| Dec-21 | 171.0 | 159.8 |
| Dec-21 | 168.3 | 159.8 |
| Dec-21 | 166.5 | 159.8 |
| Dec-21 | 165.8 | 159.8 |
| Dec-21 | 164.5 | 159.8 |
| Dec-21 | 162.6 | 159.8 |
| Dec-21 | 161.7 | 159.8 |
| Dec-21 | 158.9 | 159.8 |
| Dec-21 | 157.1 | 159.8 |
| Dec-21 | 155.4 | 159.8 |
| Dec-21 | 156.7 | 159.8 |
| Dec-21 | 157.2 | 159.8 |
| Dec-21 | 156.2 | 159.8 |
| Dec-21 | 162.8 | 159.8 |
| Dec-21 | 161.8 | 159.8 |
| Dec-21 | 160.6 | 159.8 |
| Dec-21 | 159.8 | 159.8 |
| Dec-21 | 158.9 | 159.8 |
| Dec-21 | 159.1 | 159.8 |
| Dec-21 | 159.1 | 159.8 |
| Dec-21 | 157.8 | 159.8 |
| Dec-21 | 156.0 | 159.8 |
| Dec-21 | 155.8 | 159.8 |
| Dec-21 | 154.0 | 159.8 |
| Dec-21 | 153.7 | 159.8 |
| Dec-21 | 151.9 | 159.8 |
| Dec-21 | 151.2 | 159.8 |
| Dec-21 | 157.9 | 159.8 |
| Dec-21 | 159.8 | 159.8 |
| Dec-21 | 160.1 | 159.8 |
| Jan-22 | 163.2 | 167.9 |
| Jan-22 | 164.0 | 167.9 |
| Jan-22 | 163.9 | 167.9 |
| Jan-22 | 163.2 | 167.9 |
| Jan-22 | 162.0 | 167.9 |
| Jan-22 | 161.5 | 167.9 |
| Jan-22 | 162.6 | 167.9 |
| Jan-22 | 162.3 | 167.9 |
| Jan-22 | 163.4 | 167.9 |
| Jan-22 | 164.5 | 167.9 |
| Jan-22 | 164.7 | 167.9 |
| Jan-22 | 173.2 | 167.9 |
| Jan-22 | 173.9 | 167.9 |
| Jan-22 | 173.8 | 167.9 |
| Jan-22 | 171.8 | 167.9 |
| Jan-22 | 171.7 | 167.9 |
| Jan-22 | 172.1 | 167.9 |
| Jan-22 | 172.0 | 167.9 |
| Jan-22 | 172.2 | 167.9 |
| Jan-22 | 171.9 | 167.9 |
| Jan-22 | 170.7 | 167.9 |
| Jan-22 | 167.8 | 167.9 |
| Jan-22 | 167.5 | 167.9 |
| Jan-22 | 167.4 | 167.9 |
| Jan-22 | 166.9 | 167.9 |
| Jan-22 | 172.0 | 167.9 |
| Jan-22 | 171.4 | 167.9 |
| Jan-22 | 170.1 | 167.9 |
| Jan-22 | 168.6 | 167.9 |
| Jan-22 | 168.4 | 167.9 |
| Jan-22 | 167.1 | 167.9 |
| Feb-22 | 170.2 | 180.0 |
| Feb-22 | 170.7 | 180.0 |
| Feb-22 | 173.7 | 180.0 |
| Feb-22 | 175.2 | 180.0 |
| Feb-22 | 175.3 | 180.0 |
| Feb-22 | 175.5 | 180.0 |
| Feb-22 | 175.9 | 180.0 |
| Feb-22 | 176.7 | 180.0 |
| Feb-22 | 182.5 | 180.0 |
| Feb-22 | 183.8 | 180.0 |
| Feb-22 | 183.4 | 180.0 |
| Feb-22 | 182.9 | 180.0 |
| Feb-22 | 183.3 | 180.0 |
| Feb-22 | 183.3 | 180.0 |
| Feb-22 | 182.8 | 180.0 |
| Feb-22 | 182.1 | 180.0 |
| Feb-22 | 181.6 | 180.0 |
| Feb-22 | 180.6 | 180.0 |
| Feb-22 | 179.2 | 180.0 |
| Feb-22 | 178.6 | 180.0 |
| Feb-22 | 179.2 | 180.0 |
| Feb-22 | 178.0 | 180.0 |
| Feb-22 | 182.3 | 180.0 |
| Feb-22 | 183.0 | 180.0 |
| Feb-22 | 184.4 | 180.0 |
| Feb-22 | 184.4 | 180.0 |
| Feb-22 | 184.4 | 180.0 |
| Feb-22 | 185.5 | 180.0 |
| Mar-22 | 184.7 | 201.8 |
| Mar-22 | 186.2 | 201.8 |
| Mar-22 | 186.2 | 201.8 |
| Mar-22 | 185.2 | 201.8 |
| Mar-22 | 184.9 | 201.8 |
| Mar-22 | 185.3 | 201.8 |
| Mar-22 | 185.8 | 201.8 |
| Mar-22 | 187.3 | 201.8 |
| Mar-22 | 196.9 | 201.8 |
| Mar-22 | 204.4 | 201.8 |
| Mar-22 | 210.4 | 201.8 |
| Mar-22 | 212.6 | 201.8 |
| Mar-22 | 213.8 | 201.8 |
| Mar-22 | 215.9 | 201.8 |
| Mar-22 | 216.9 | 201.8 |
| Mar-22 | 216.2 | 201.8 |
| Mar-22 | 215.0 | 201.8 |
| Mar-22 | 213.2 | 201.8 |
| Mar-22 | 211.3 | 201.8 |
| Mar-22 | 210.0 | 201.8 |
| Mar-22 | 209.4 | 201.8 |
| Mar-22 | 206.6 | 201.8 |
| Mar-22 | 209.8 | 201.8 |
| Mar-22 | 207.9 | 201.8 |
| Mar-22 | 206.1 | 201.8 |
| Mar-22 | 204.1 | 201.8 |
| Mar-22 | 203.0 | 201.8 |
| Mar-22 | 201.5 | 201.8 |
| Mar-22 | 199.9 | 201.8 |
| Mar-22 | 194.6 | 201.8 |
| Mar-22 | 189.0 | 201.8 |
| Apr-22 | 184.7 | 170.7 |
| Apr-22 | 181.4 | 170.7 |
| Apr-22 | 179.1 | 170.7 |
| Apr-22 | 175.6 | 170.7 |
| Apr-22 | 170.4 | 170.7 |
| Apr-22 | 171.9 | 170.7 |
| Apr-22 | 170.1 | 170.7 |
| Apr-22 | 168.3 | 170.7 |
| Apr-22 | 166.7 | 170.7 |
| Apr-22 | 165.8 | 170.7 |
| Apr-22 | 164.7 | 170.7 |
| Apr-22 | 163.3 | 170.7 |
| Apr-22 | 162.0 | 170.7 |
| Apr-22 | 160.7 | 170.7 |
| Apr-22 | 159.5 | 170.7 |
| Apr-22 | 158.9 | 170.7 |
| Apr-22 | 158.6 | 170.7 |
| Apr-22 | 158.2 | 170.7 |
| Apr-22 | 158.2 | 170.7 |
| Apr-22 | 165.8 | 170.7 |
| Apr-22 | 172.2 | 170.7 |
| Apr-22 | 176.0 | 170.7 |
| Apr-22 | 176.8 | 170.7 |
| Apr-22 | 178.0 | 170.7 |
| Apr-22 | 179.1 | 170.7 |
| Apr-22 | 179.8 | 170.7 |
| Apr-22 | 179.7 | 170.7 |
| Apr-22 | 179.4 | 170.7 |
| Apr-22 | 178.3 | 170.7 |
| Apr-22 | 177.6 | 170.7 |
| May-22 | 178.5 | 191.7 |
| May-22 | 178.4 | 191.7 |
| May-22 | 179.2 | 191.7 |
| May-22 | 182.8 | 191.7 |
| May-22 | 180.2 | 191.7 |
| May-22 | 179.6 | 191.7 |
| May-22 | 181.4 | 191.7 |
| May-22 | 182.8 | 191.7 |
| May-22 | 183.6 | 191.7 |
| May-22 | 183.7 | 191.7 |
| May-22 | 184.3 | 191.7 |
| May-22 | 184.7 | 191.7 |
| May-22 | 186.1 | 191.7 |
| May-22 | 188.1 | 191.7 |
| May-22 | 190.9 | 191.7 |
| May-22 | 193.6 | 191.7 |
| May-22 | 195.7 | 191.7 |
| May-22 | 202.3 | 191.7 |
| May-22 | 204.1 | 191.7 |
| May-22 | 204.9 | 191.7 |
| May-22 | 205.8 | 191.7 |
| May-22 | 206.6 | 191.7 |
| May-22 | 205.6 | 191.7 |
| May-22 | 202.9 | 191.7 |
| May-22 | 200.4 | 191.7 |
| May-22 | 198.9 | 191.7 |
| May-22 | 197.3 | 191.7 |
| May-22 | 195.8 | 191.7 |
| May-22 | 195.3 | 191.7 |
| May-22 | 195.1 | 191.7 |
| May-22 | 195.0 | 191.7 |
| Jun-22 | 197.6 | 205.5 |
| Jun-22 | 197.4 | 205.5 |
| Jun-22 | 196.6 | 205.5 |
| Jun-22 | 198.1 | 205.5 |
| Jun-22 | 201.0 | 205.5 |
| Jun-22 | 201.9 | 205.5 |
| Jun-22 | 202.1 | 205.5 |
| Jun-22 | 201.1 | 205.5 |
| Jun-22 | 200.5 | 205.5 |
| Jun-22 | 199.7 | 205.5 |
| Jun-22 | 199.2 | 205.5 |
| Jun-22 | 199.6 | 205.5 |
| Jun-22 | 200.0 | 205.5 |
| Jun-22 | 200.5 | 205.5 |
| Jun-22 | 205.7 | 205.5 |
| Jun-22 | 208.5 | 205.5 |
| Jun-22 | 210.9 | 205.5 |
| Jun-22 | 214.0 | 205.5 |
| Jun-22 | 215.6 | 205.5 |
| Jun-22 | 216.1 | 205.5 |
| Jun-22 | 214.1 | 205.5 |
| Jun-22 | 212.4 | 205.5 |
| Jun-22 | 211.0 | 205.5 |
| Jun-22 | 209.7 | 205.5 |
| Jun-22 | 208.7 | 205.5 |
| Jun-22 | 207.8 | 205.5 |
| Jun-22 | 207.4 | 205.5 |
| Jun-22 | 206.2 | 205.5 |
| Jun-22 | 211.2 | 205.5 |
| Jun-22 | 211.2 | 205.5 |
| Jul-22 | 211.4 | 195.7 |
| Jul-22 | 211.7 | 195.7 |
| Jul-22 | 213.9 | 195.7 |
| Jul-22 | 215.2 | 195.7 |
| Jul-22 | 215.2 | 195.7 |
| Jul-22 | 216.1 | 195.7 |
| Jul-22 | 213.7 | 195.7 |
| Jul-22 | 210.3 | 195.7 |
| Jul-22 | 207.0 | 195.7 |
| Jul-22 | 205.5 | 195.7 |
| Jul-22 | 204.3 | 195.7 |
| Jul-22 | 202.0 | 195.7 |
| Jul-22 | 204.2 | 195.7 |
| Jul-22 | 202.1 | 195.7 |
| Jul-22 | 199.3 | 195.7 |
| Jul-22 | 196.7 | 195.7 |
| Jul-22 | 194.2 | 195.7 |
| Jul-22 | 191.7 | 195.7 |
| Jul-22 | 189.0 | 195.7 |
| Jul-22 | 189.3 | 195.7 |
| Jul-22 | 188.0 | 195.7 |
| Jul-22 | 187.5 | 195.7 |
| Jul-22 | 185.1 | 195.7 |
| Jul-22 | 183.4 | 195.7 |
| Jul-22 | 180.4 | 195.7 |
| Jul-22 | 176.7 | 195.7 |
| Jul-22 | 179.3 | 195.7 |
| Jul-22 | 177.0 | 195.7 |
| Jul-22 | 174.6 | 195.7 |
| Jul-22 | 171.9 | 195.7 |
| Jul-22 | 169.6 | 195.7 |
| Aug-22 | 170.7 | 171.9 |
| Aug-22 | 169.0 | 171.9 |
| Aug-22 | 173.2 | 171.9 |
| Aug-22 | 171.9 | 171.9 |
| Aug-22 | 169.7 | 171.9 |
| Aug-22 | 167.4 | 171.9 |
| Aug-22 | 166.6 | 171.9 |
| Aug-22 | 165.6 | 171.9 |
| Aug-22 | 163.7 | 171.9 |
| Aug-22 | 169.2 | 171.9 |
| Aug-22 | 167.8 | 171.9 |
| Aug-22 | 166.1 | 171.9 |
| Aug-22 | 165.3 | 171.9 |
| Aug-22 | 166.4 | 171.9 |
| Aug-22 | 167.9 | 171.9 |
| Aug-22 | 168.5 | 171.9 |
| Aug-22 | 173.2 | 171.9 |
| Aug-22 | 173.8 | 171.9 |
| Aug-22 | 172.8 | 171.9 |
| Aug-22 | 173.0 | 171.9 |
| Aug-22 | 173.5 | 171.9 |
| Aug-22 | 175.5 | 171.9 |
| Aug-22 | 174.8 | 171.9 |
| Aug-22 | 182.0 | 171.9 |
| Aug-22 | 180.6 | 171.9 |
| Aug-22 | 178.8 | 171.9 |
| Aug-22 | 176.6 | 171.9 |
| Aug-22 | 176.5 | 171.9 |
| Aug-22 | 178.3 | 171.9 |
| Aug-22 | 175.9 | 171.9 |
| Aug-22 | 173.8 | 171.9 |
| Sep-22 | 171.3 | 169.5 |
| Sep-22 | 168.2 | 169.5 |
| Sep-22 | 166.0 | 169.5 |
| Sep-22 | 164.8 | 169.5 |
| Sep-22 | 163.1 | 169.5 |
| Sep-22 | 160.4 | 169.5 |
| Sep-22 | 163.9 | 169.5 |
| Sep-22 | 162.3 | 169.5 |
| Sep-22 | 161.0 | 169.5 |
| Sep-22 | 160.1 | 169.5 |
| Sep-22 | 160.1 | 169.5 |
| Sep-22 | 160.1 | 169.5 |
| Sep-22 | 161.0 | 169.5 |
| Sep-22 | 164.1 | 169.5 |
| Sep-22 | 164.4 | 169.5 |
| Sep-22 | 163.5 | 169.5 |
| Sep-22 | 163.3 | 169.5 |
| Sep-22 | 164.1 | 169.5 |
| Sep-22 | 166.4 | 169.5 |
| Sep-22 | 166.8 | 169.5 |
| Sep-22 | 175.0 | 169.5 |
| Sep-22 | 176.9 | 169.5 |
| Sep-22 | 177.6 | 169.5 |
| Sep-22 | 178.7 | 169.5 |
| Sep-22 | 183.0 | 169.5 |
| Sep-22 | 184.4 | 169.5 |
| Sep-22 | 182.7 | 169.5 |
| Sep-22 | 184.1 | 169.5 |
| Sep-22 | 184.5 | 169.5 |
| Sep-22 | 184.5 | 169.5 |
| Oct-22 | 183.1 | 182.0 |
| Oct-22 | 182.8 | 182.0 |
| Oct-22 | 182.8 | 182.0 |
| Oct-22 | 182.2 | 182.0 |
| Oct-22 | 186.1 | 182.0 |
| Oct-22 | 184.7 | 182.0 |
| Oct-22 | 183.5 | 182.0 |
| Oct-22 | 182.2 | 182.0 |
| Oct-22 | 180.6 | 182.0 |
| Oct-22 | 178.7 | 182.0 |
| Oct-22 | 176.1 | 182.0 |
| Oct-22 | 176.4 | 182.0 |
| Oct-22 | 176.4 | 182.0 |
| Oct-22 | 176.5 | 182.0 |
| Oct-22 | 178.3 | 182.0 |
| Oct-22 | 179.6 | 182.0 |
| Oct-22 | 179.5 | 182.0 |
| Oct-22 | 178.9 | 182.0 |
| Oct-22 | 182.9 | 182.0 |
| Oct-22 | 181.5 | 182.0 |
| Oct-22 | 181.2 | 182.0 |
| Oct-22 | 180.7 | 182.0 |
| Oct-22 | 180.0 | 182.0 |
| Oct-22 | 181.2 | 182.0 |
| Oct-22 | 184.7 | 182.0 |
| Oct-22 | 189.0 | 182.0 |
| Oct-22 | 187.2 | 182.0 |
| Oct-22 | 186.4 | 182.0 |
| Oct-22 | 186.0 | 182.0 |
| Oct-22 | 186.5 | 182.0 |
| Oct-22 | 186.5 | 182.0 |
| Nov-22 | 188.3 | 191.1 |
| Nov-22 | 197.1 | 191.1 |
| Nov-22 | 197.3 | 191.1 |
| Nov-22 | 197.2 | 191.1 |
| Nov-22 | 197.5 | 191.1 |
| Nov-22 | 195.7 | 191.1 |
| Nov-22 | 196.5 | 191.1 |
| Nov-22 | 197.2 | 191.1 |
| Nov-22 | 201.8 | 191.1 |
| Nov-22 | 200.9 | 191.1 |
| Nov-22 | 198.2 | 191.1 |
| Nov-22 | 195.5 | 191.1 |
| Nov-22 | 194.5 | 191.1 |
| Nov-22 | 193.7 | 191.1 |
| Nov-22 | 192.2 | 191.1 |
| Nov-22 | 195.3 | 191.1 |
| Nov-22 | 193.0 | 191.1 |
| Nov-22 | 190.2 | 191.1 |
| Nov-22 | 187.3 | 191.1 |
| Nov-22 | 185.6 | 191.1 |
| Nov-22 | 185.0 | 191.1 |
| Nov-22 | 183.9 | 191.1 |
| Nov-22 | 187.2 | 191.1 |
| Nov-22 | 186.4 | 191.1 |
| Nov-22 | 185.4 | 191.1 |
| Nov-22 | 184.4 | 191.1 |
| Nov-22 | 184.0 | 191.1 |
| Nov-22 | 182.4 | 191.1 |
| Nov-22 | 179.2 | 191.1 |
| Nov-22 | 179.9 | 191.1 |
Average price of unleaded petrol (91 octane), cents per litre
["","Daily average price of ULP","Monthly average price of ULP"]
[["Mar20","Apr-20","Apr-20","Apr-20","Apr-20","Apr-20","Apr-20","Apr-20","Apr-20","Apr-20","Apr-20","Apr-20","Apr-20","Apr-20","Apr-20","Apr-20","Apr-20","Apr-20","Apr-20","Apr-20","Apr-20","Apr-20","Apr-20","Apr-20","Apr-20","Apr-20","Apr-20","Apr-20","Apr-20","Apr-20","Apr-20","May-20","May-20","May-20","May-20","May-20","May-20","May-20","May-20","May-20","May-20","May-20","May-20","May-20","May-20","May-20","May-20","May-20","May-20","May-20","May-20","May-20","May-20","May-20","May-20","May-20","May-20","May-20","May-20","May-20","May-20","May-20","Jun-20","Jun-20","Jun-20","Jun-20","Jun-20","Jun-20","Jun-20","Jun-20","Jun-20","Jun-20","Jun-20","Jun-20","Jun-20","Jun-20","Jun-20","Jun-20","Jun-20","Jun-20","Jun-20","Jun-20","Jun-20","Jun-20","Jun-20","Jun-20","Jun-20","Jun-20","Jun-20","Jun-20","Jun-20","Jun-20","Jul-20","Jul-20","Jul-20","Jul-20","Jul-20","Jul-20","Jul-20","Jul-20","Jul-20","Jul-20","Jul-20","Jul-20","Jul-20","Jul-20","Jul-20","Jul-20","Jul-20","Jul-20","Jul-20","Jul-20","Jul-20","Jul-20","Jul-20","Jul-20","Jul-20","Jul-20","Jul-20","Jul-20","Jul-20","Jul-20","Jul-20","Aug-20","Aug-20","Aug-20","Aug-20","Aug-20","Aug-20","Aug-20","Aug-20","Aug-20","Aug-20","Aug-20","Aug-20","Aug-20","Aug-20","Aug-20","Aug-20","Aug-20","Aug-20","Aug-20","Aug-20","Aug-20","Aug-20","Aug-20","Aug-20","Aug-20","Aug-20","Aug-20","Aug-20","Aug-20","Aug-20","Aug-20","Sep-20","Sep-20","Sep-20","Sep-20","Sep-20","Sep-20","Sep-20","Sep-20","Sep-20","Sep-20","Sep-20","Sep-20","Sep-20","Sep-20","Sep-20","Sep-20","Sep-20","Sep-20","Sep-20","Sep-20","Sep-20","Sep-20","Sep-20","Sep-20","Sep-20","Sep-20","Sep-20","Sep-20","Sep-20","Sep-20","Oct-20","Oct-20","Oct-20","Oct-20","Oct-20","Oct-20","Oct-20","Oct-20","Oct-20","Oct-20","Oct-20","Oct-20","Oct-20","Oct-20","Oct-20","Oct-20","Oct-20","Oct-20","Oct-20","Oct-20","Oct-20","Oct-20","Oct-20","Oct-20","Oct-20","Oct-20","Oct-20","Oct-20","Oct-20","Oct-20","Oct-20","Nov-20","Nov-20","Nov-20","Nov-20","Nov-20","Nov-20","Nov-20","Nov-20","Nov-20","Nov-20","Nov-20","Nov-20","Nov-20","Nov-20","Nov-20","Nov-20","Nov-20","Nov-20","Nov-20","Nov-20","Nov-20","Nov-20","Nov-20","Nov-20","Nov-20","Nov-20","Nov-20","Nov-20","Nov-20","Nov-20","Dec-20","Dec-20","Dec-20","Dec-20","Dec-20","Dec-20","Dec-20","Dec-20","Dec-20","Dec-20","Dec-20","Dec-20","Dec-20","Dec-20","Dec-20","Dec-20","Dec-20","Dec-20","Dec-20","Dec-20","Dec-20","Dec-20","Dec-20","Dec-20","Dec-20","Dec-20","Dec-20","Dec-20","Dec-20","Dec-20","Dec-20","Jan-21","Jan-21","Jan-21","Jan-21","Jan-21","Jan-21","Jan-21","Jan-21","Jan-21","Jan-21","Jan-21","Jan-21","Jan-21","Jan-21","Jan-21","Jan-21","Jan-21","Jan-21","Jan-21","Jan-21","Jan-21","Jan-21","Jan-21","Jan-21","Jan-21","Jan-21","Jan-21","Jan-21","Jan-21","Jan-21","Jan-21","Feb-21","Feb-21","Feb-21","Feb-21","Feb-21","Feb-21","Feb-21","Feb-21","Feb-21","Feb-21","Feb-21","Feb-21","Feb-21","Feb-21","Feb-21","Feb-21","Feb-21","Feb-21","Feb-21","Feb-21","Feb-21","Feb-21","Feb-21","Feb-21","Feb-21","Feb-21","Feb-21","Feb-21","Mar-21","Mar-21","Mar-21","Mar-21","Mar-21","Mar-21","Mar-21","Mar-21","Mar-21","Mar-21","Mar-21","Mar-21","Mar-21","Mar-21","Mar-21","Mar-21","Mar-21","Mar-21","Mar-21","Mar-21","Mar-21","Mar-21","Mar-21","Mar-21","Mar-21","Mar-21","Mar-21","Mar-21","Mar-21","Mar-21","Mar-21","Apr-21","Apr-21","Apr-21","Apr-21","Apr-21","Apr-21","Apr-21","Apr-21","Apr-21","Apr-21","Apr-21","Apr-21","Apr-21","Apr-21","Apr-21","Apr-21","Apr-21","Apr-21","Apr-21","Apr-21","Apr-21","Apr-21","Apr-21","Apr-21","Apr-21","Apr-21","Apr-21","Apr-21","Apr-21","Apr-21","May-21","May-21","May-21","May-21","May-21","May-21","May-21","May-21","May-21","May-21","May-21","May-21","May-21","May-21","May-21","May-21","May-21","May-21","May-21","May-21","May-21","May-21","May-21","May-21","May-21","May-21","May-21","May-21","May-21","May-21","May-21","Jun-21","Jun-21","Jun-21","Jun-21","Jun-21","Jun-21","Jun-21","Jun-21","Jun-21","Jun-21","Jun-21","Jun-21","Jun-21","Jun-21","Jun-21","Jun-21","Jun-21","Jun-21","Jun-21","Jun-21","Jun-21","Jun-21","Jun-21","Jun-21","Jun-21","Jun-21","Jun-21","Jun-21","Jun-21","Jun-21","Jul-21","Jul-21","Jul-21","Jul-21","Jul-21","Jul-21","Jul-21","Jul-21","Jul-21","Jul-21","Jul-21","Jul-21","Jul-21","Jul-21","Jul-21","Jul-21","Jul-21","Jul-21","Jul-21","Jul-21","Jul-21","Jul-21","Jul-21","Jul-21","Jul-21","Jul-21","Jul-21","Jul-21","Jul-21","Jul-21","Jul-21","Aug-21","Aug-21","Aug-21","Aug-21","Aug-21","Aug-21","Aug-21","Aug-21","Aug-21","Aug-21","Aug-21","Aug-21","Aug-21","Aug-21","Aug-21","Aug-21","Aug-21","Aug-21","Aug-21","Aug-21","Aug-21","Aug-21","Aug-21","Aug-21","Aug-21","Aug-21","Aug-21","Aug-21","Aug-21","Aug-21","Sep-21","Sep-21","Sep-21","Sep-21","Sep-21","Sep-21","Sep-21","Sep-21","Sep-21","Sep-21","Sep-21","Sep-21","Sep-21","Sep-21","Sep-21","Sep-21","Sep-21","Sep-21","Sep-21","Sep-21","Sep-21","Sep-21","Sep-21","Sep-21","Sep-21","Sep-21","Sep-21","Sep-21","Sep-21","Sep-21","Sep-21","Oct-21","Oct-21","Oct-21","Oct-21","Oct-21","Oct-21","Oct-21","Oct-21","Oct-21","Oct-21","Oct-21","Oct-21","Oct-21","Oct-21","Oct-21","Oct-21","Oct-21","Oct-21","Oct-21","Oct-21","Oct-21","Oct-21","Oct-21","Oct-21","Oct-21","Oct-21","Oct-21","Oct-21","Oct-21","Oct-21","Oct-21","Nov-21","Nov-21","Nov-21","Nov-21","Nov-21","Nov-21","Nov-21","Nov-21","Nov-21","Nov-21","Nov-21","Nov-21","Nov-21","Nov-21","Nov-21","Nov-21","Nov-21","Nov-21","Nov-21","Nov-21","Nov-21","Nov-21","Nov-21","Nov-21","Nov-21","Nov-21","Nov-21","Nov-21","Nov-21","Nov-21","Dec-21","Dec-21","Dec-21","Dec-21","Dec-21","Dec-21","Dec-21","Dec-21","Dec-21","Dec-21","Dec-21","Dec-21","Dec-21","Dec-21","Dec-21","Dec-21","Dec-21","Dec-21","Dec-21","Dec-21","Dec-21","Dec-21","Dec-21","Dec-21","Dec-21","Dec-21","Dec-21","Dec-21","Dec-21","Dec-21","Dec-21","Jan-22","Jan-22","Jan-22","Jan-22","Jan-22","Jan-22","Jan-22","Jan-22","Jan-22","Jan-22","Jan-22","Jan-22","Jan-22","Jan-22","Jan-22","Jan-22","Jan-22","Jan-22","Jan-22","Jan-22","Jan-22","Jan-22","Jan-22","Jan-22","Jan-22","Jan-22","Jan-22","Jan-22","Jan-22","Jan-22","Jan-22","Feb-22","Feb-22","Feb-22","Feb-22","Feb-22","Feb-22","Feb-22","Feb-22","Feb-22","Feb-22","Feb-22","Feb-22","Feb-22","Feb-22","Feb-22","Feb-22","Feb-22","Feb-22","Feb-22","Feb-22","Feb-22","Feb-22","Feb-22","Feb-22","Feb-22","Feb-22","Feb-22","Feb-22","Mar-22","Mar-22","Mar-22","Mar-22","Mar-22","Mar-22","Mar-22","Mar-22","Mar-22","Mar-22","Mar-22","Mar-22","Mar-22","Mar-22","Mar-22","Mar-22","Mar-22","Mar-22","Mar-22","Mar-22","Mar-22","Mar-22","Mar-22","Mar-22","Mar-22","Mar-22","Mar-22","Mar-22","Mar-22","Mar-22","Mar-22","Apr-22","Apr-22","Apr-22","Apr-22","Apr-22","Apr-22","Apr-22","Apr-22","Apr-22","Apr-22","Apr-22","Apr-22","Apr-22","Apr-22","Apr-22","Apr-22","Apr-22","Apr-22","Apr-22","Apr-22","Apr-22","Apr-22","Apr-22","Apr-22","Apr-22","Apr-22","Apr-22","Apr-22","Apr-22","Apr-22","May-22","May-22","May-22","May-22","May-22","May-22","May-22","May-22","May-22","May-22","May-22","May-22","May-22","May-22","May-22","May-22","May-22","May-22","May-22","May-22","May-22","May-22","May-22","May-22","May-22","May-22","May-22","May-22","May-22","May-22","May-22","Jun-22","Jun-22","Jun-22","Jun-22","Jun-22","Jun-22","Jun-22","Jun-22","Jun-22","Jun-22","Jun-22","Jun-22","Jun-22","Jun-22","Jun-22","Jun-22","Jun-22","Jun-22","Jun-22","Jun-22","Jun-22","Jun-22","Jun-22","Jun-22","Jun-22","Jun-22","Jun-22","Jun-22","Jun-22","Jun-22","Jul-22","Jul-22","Jul-22","Jul-22","Jul-22","Jul-22","Jul-22","Jul-22","Jul-22","Jul-22","Jul-22","Jul-22","Jul-22","Jul-22","Jul-22","Jul-22","Jul-22","Jul-22","Jul-22","Jul-22","Jul-22","Jul-22","Jul-22","Jul-22","Jul-22","Jul-22","Jul-22","Jul-22","Jul-22","Jul-22","Jul-22","Aug-22","Aug-22","Aug-22","Aug-22","Aug-22","Aug-22","Aug-22","Aug-22","Aug-22","Aug-22","Aug-22","Aug-22","Aug-22","Aug-22","Aug-22","Aug-22","Aug-22","Aug-22","Aug-22","Aug-22","Aug-22","Aug-22","Aug-22","Aug-22","Aug-22","Aug-22","Aug-22","Aug-22","Aug-22","Aug-22","Aug-22","Sep-22","Sep-22","Sep-22","Sep-22","Sep-22","Sep-22","Sep-22","Sep-22","Sep-22","Sep-22","Sep-22","Sep-22","Sep-22","Sep-22","Sep-22","Sep-22","Sep-22","Sep-22","Sep-22","Sep-22","Sep-22","Sep-22","Sep-22","Sep-22","Sep-22","Sep-22","Sep-22","Sep-22","Sep-22","Sep-22","Oct-22","Oct-22","Oct-22","Oct-22","Oct-22","Oct-22","Oct-22","Oct-22","Oct-22","Oct-22","Oct-22","Oct-22","Oct-22","Oct-22","Oct-22","Oct-22","Oct-22","Oct-22","Oct-22","Oct-22","Oct-22","Oct-22","Oct-22","Oct-22","Oct-22","Oct-22","Oct-22","Oct-22","Oct-22","Oct-22","Oct-22","Nov-22","Nov-22","Nov-22","Nov-22","Nov-22","Nov-22","Nov-22","Nov-22","Nov-22","Nov-22","Nov-22","Nov-22","Nov-22","Nov-22","Nov-22","Nov-22","Nov-22","Nov-22","Nov-22","Nov-22","Nov-22","Nov-22","Nov-22","Nov-22","Nov-22","Nov-22","Nov-22","Nov-22","Nov-22","Nov-22"],[[126.5213105],[120.09229929999999],[119.7834101],[119.3166533],[116.250958],[114.2548632],[112.6774861],[112.0919095],[115.438406],[113.4467131],[109.81468169999999],[107.6768017],[104.83127570000001],[102.6036641],[102.4925369],[106.209175],[106.20137320000001],[105.3540392],[103.1504624],[101.2585589],[99.806977959999998],[97.922246459999997],[102.4558316],[100.475579],[97.401850929999995],[95.196799310000003],[93.596984320000004],[92.460064759999995],[92.295469519999997],[99.760530459999998],[100.14227270000001],[100.91542130000001],[99.412515290000002],[97.792942109999998],[96.195638270000003],[96.842540380000003],[104.13393859999999],[105.2367509],[104.69678140000001],[103.8681229],[106.2812733],[107.4459569],[108.5296379],[115.184347],[115.284834],[113.4400321],[111.1122524],[109.3778071],[108.7192197],[107.36266089999999],[112.28589770000001],[110.9230803],[108.90968820000001],[108.1771373],[109.05461870000001],[108.42796370000001],[107.3794731],[112.4941058],[110.94418709999999],[109.0633479],[108.0537818],[106.6427752],[106.2178072],[105.39211160000001],[111.6067209],[112.4829285],[112.470158],[112.60363890000001],[116.4093902],[117.87169969999999],[119.11542129999999],[127.77990680000001],[127.4632708],[126.33222139999999],[124.1829867],[122.11879570000001],[120.4855663],[119.2070416],[124.30673659999999],[122.8032353],[120.6997289],[121.71296359999999],[120.98718220000001],[119.2651102],[118.151487],[123.7091992],[122.64287330000001],[120.7081172],[119.03748710000001],[117.6936383],[116.7744098],[115.913979],[123.48058229999999],[123.93298900000001],[122.87172030000001],[122.3615561],[122.5086367],[122.6619553],[121.9395445],[126.2571051],[126.58446739999999],[123.8718913],[121.52001300000001],[120.3153203],[119.6238329],[118.92024960000001],[125.2804537],[124.4179736],[125.59313280000001],[125.7280109],[126.3961281],[126.09903389999999],[124.8585532],[129.73192879999999],[127.6916441],[125.18651989999999],[123.3127503],[121.75475590000001],[119.9739917],[119.9517644],[128.72638240000001],[130.58289669999999],[129.5549844],[128.80732140000001],[128.3077437],[127.96268449999999],[126.3414386],[132.10628689999999],[129.77402219999999],[126.0643824],[122.2124354],[120.3146375],[119.2801037],[117.275373],[123.5023917],[123.3536999],[120.6987627],[119.0134862],[118.7335542],[117.2808404],[115.345463],[121.22108950000001],[120.1909337],[118.0285976],[116.82743619999999],[115.2450382],[115.35643469999999],[115.97822619999999],[125.5142713],[126.809911],[127.1648402],[129.73003840000001],[131.96250000000001],[133.81928429999999],[132.60711119999999],[138.98054139999999],[136.67145059999999],[132.7001401],[129.339123],[127.15584629999999],[125.53782510000001],[123.9938624],[129.70475010000001],[127.5344051],[124.4149767],[122.90381910000001],[122.1095734],[122.4527727],[121.89801730000001],[127.6955293],[125.137744],[121.73230529999999],[118.4460388],[116.0332774],[113.8932227],[112.4640964],[118.9865344],[117.1288993],[114.7078929],[113.6107263],[114.8390419],[114.33010229999999],[113.86154790000001],[120.60579869999999],[121.9351546],[119.9854936],[117.63462],[116.0163158],[114.1666448],[115.263166],[122.5742827],[122.4804359],[120.7086297],[117.8389561],[117.5025141],[118.85451430000001],[118.3650148],[126.1671314],[124.91847660000001],[123.03545250000001],[120.14029290000001],[121.8708567],[123.29979710000001],[122.9673222],[131.6491704],[131.43493029999999],[127.3688429],[124.7762673],[123.1147464],[121.7512545],[119.17531080000001],[125.8637978],[124.0082762],[120.9829173],[119.5708145],[116.6207656],[114.7047239],[112.1800396],[120.38996710000001],[118.88656469999999],[117.0628978],[115.6451488],[114.8984718],[115.00717880000001],[116.4659271],[125.1698361],[126.1179959],[124.3179718],[121.5604439],[120.6949779],[120.5690584],[121.6386806],[129.06575190000001],[129.1722475],[127.51079369999999],[123.6751022],[122.1446041],[121.2019366],[119.6948052],[124.7535998],[122.6172825],[119.9664413],[116.9528703],[120.3349412],[120.2899042],[119.1991261],[125.0175153],[123.48018020000001],[122.0918582],[120.3941104],[119.439069],[119.5867454],[119.57305479999999],[127.077797],[125.922],[126.7036253],[125.5893547],[127.9029402],[127.781935],[127.65787109999999],[136.20293240000001],[134.8166555],[133.38700460000001],[131.18174289999999],[130.6116529],[131.13679310000001],[129.1209724],[135.8084288],[133.32359869999999],[129.57363910000001],[126.4850414],[125.0336566],[124.326262],[122.61607050000001],[128.6682156],[126.9286506],[124.049284],[121.99211889999999],[121.90892169999999],[121.01697059999999],[119.7695559],[126.27168330000001],[124.6227952],[121.8068691],[118.926919],[116.9345617],[115.327254],[114.6536949],[122.9807022],[123.2142329],[122.8049803],[121.9241332],[124.0778],[126.91393170000001],[130.30582889999999],[143.7810288],[145.92650470000001],[144.053763],[140.15255339999999],[138.553256],[138.37872530000001],[134.66692409999999],[142.9704065],[140.19085290000001],[136.34989239999999],[133.4584811],[133.0841131],[134.81400909999999],[133.30146210000001],[138.6254734],[136.33399059999999],[133.75932159999999],[130.69009389999999],[128.64001880000001],[126.1909362],[124.8643411],[131.18668170000001],[130.98160039999999],[129.67299779999999],[128.04691829999999],[128.9893519],[129.17854700000001],[128.79227589999999],[140.0336825],[137.7410706],[136.09581080000001],[133.22861839999999],[132.0609876],[133.43684089999999],[133.2829279],[140.36558059999999],[139.2561082],[137.10957400000001],[134.66532359999999],[134.3670267],[138.3018309],[139.88071930000001],[152.01458650000001],[150.20688050000001],[147.86047260000001],[145.23852600000001],[143.43106900000001],[140.2750284],[139.46978340000001],[147.0527141],[144.28327390000001],[141.3758536],[139.03758089999999],[139.7286809],[138.23748409999999],[137.56131880000001],[146.58105739999999],[144.61078309999999],[142.07321870000001],[138.98399309999999],[137.08185829999999],[135.86247320000001],[134.96675479999999],[143.22725349999999],[142.4683216],[140.58809049999999],[138.46283339999999],[138.91686110000001],[140.504525],[140.48566529999999],[152.73631839999999],[152.76796519999999],[152.0882373],[150.28033239999999],[148.08632299999999],[146.87568250000001],[145.6370292],[152.88605709999999],[151.64156019999999],[149.68254999999999],[147.51654629999999],[146.0239124],[145.23334819999999],[143.0073821],[149.20167660000001],[145.87633640000001],[143.4414812],[140.61225830000001],[139.76588599999999],[138.6490178],[136.72848160000001],[143.31006880000001],[141.37917640000001],[139.82861449999999],[137.8717297],[138.18103199999999],[136.76765069999999],[136.25388290000001],[142.9878545],[141.74589610000001],[140.663251],[138.00573],[137.66689360000001],[139.1052617],[140.8564303],[147.9304185],[148.97443770000001],[147.31157759999999],[143.14382259999999],[142.22670769999999],[142.47434509999999],[144.5604171],[150.51205229999999],[148.7913672],[146.56441079999999],[144.04011980000001],[145.28427819999999],[144.3624398],[143.5837415],[149.82704380000001],[148.12709960000001],[144.78281899999999],[141.6214928],[140.28035869999999],[138.6701573],[137.47244739999999],[144.55987540000001],[142.92786889999999],[140.85753500000001],[138.33987529999999],[138.47648599999999],[139.07248530000001],[138.63162579999999],[148.27959379999999],[146.88053120000001],[145.1160246],[141.86873030000001],[141.3693687],[141.80242250000001],[141.23279669999999],[149.7603302],[147.83441339999999],[144.01174309999999],[140.15135040000001],[138.7027372],[138.8625691],[137.50177299999999],[145.32717020000001],[142.80617280000001],[140.4955472],[137.41344699999999],[136.47708399999999],[136.9789433],[137.7288039],[145.91108180000001],[146.5526854],[145.41757870000001],[144.0376962],[144.78688819999999],[147.1964256],[149.50943950000001],[159.0236127],[162.4515389],[160.6132283],[157.35218209999999],[157.12466789999999],[157.01174280000001],[156.96494620000001],[162.8209276],[159.82607659999999],[156.44610299999999],[153.22960979999999],[153.1938261],[152.73046360000001],[151.01536350000001],[155.63560720000001],[153.12454650000001],[150.64292180000001],[147.3747836],[145.6179478],[144.48168570000001],[143.82372380000001],[152.4376943],[150.9435039],[148.8775498],[146.37478820000001],[147.60156309999999],[147.76272209999999],[147.9746878],[159.0917048],[157.7516449],[155.2002995],[152.92538070000001],[151.96392639999999],[149.9913717],[148.79049370000001],[157.8678391],[155.94217209999999],[153.78495580000001],[151.18302360000001],[152.4123348],[154.61357839999999],[155.0665716],[163.58834669999999],[160.95852859999999],[156.88519980000001],[153.2426384],[151.3293946],[151.74007040000001],[150.52130740000001],[158.1283881],[155.74161359999999],[153.0459194],[149.49161559999999],[149.0001121],[150.50413380000001],[149.24050030000001],[157.11483820000001],[153.7740306],[150.682411],[147.4048808],[146.22843739999999],[144.91608350000001],[145.6778056],[152.28784160000001],[150.24451239999999],[148.66336100000001],[146.6816],[147.6625899],[148.5077775],[148.9599331],[159.15162219999999],[158.8371009],[157.58658539999999],[155.77959809999999],[155.90822130000001],[157.5568553],[157.33891399999999],[164.7680556],[162.28594620000001],[160.7228144],[157.92269580000001],[156.52759610000001],[157.70875290000001],[154.9946865],[164.26425789999999],[162.8918242],[159.762395],[156.43830539999999],[154.98369220000001],[154.1160859],[152.28274139999999],[155.77476590000001],[154.1385482],[152.2505961],[150.84988079999999],[150.61492480000001],[149.45357390000001],[148.8705162],[158.3797974],[159.22161130000001],[160.43669349999999],[161.94998240000001],[161.2114062],[160.7328531],[161.02327149999999],[162.47708069999999],[164.0586515],[165.43793980000001],[165.0298324],[166.08532919999999],[167.86879200000001],[167.3348963],[174.40673369999999],[174.8915992],[174.78626149999999],[174.07104519999999],[174.12457509999999],[173.81527879999999],[172.53979480000001],[171.12266059999999],[169.87522709999999],[168.5949938],[167.42882560000001],[166.59762989999999],[165.78306359999999],[164.49710479999999],[170.4366924],[168.7708571],[167.9193583],[167.41674449999999],[167.56288900000001],[166.49668829999999],[166.7051889],[166.2617904],[165.1161511],[164.3501401],[163.18462769999999],[162.36275900000001],[162.0085842],[161.75553780000001],[170.87807979999999],[170.68499310000001],[169.94000489999999],[169.93079850000001],[171.65287459999999],[172.77689849999999],[174.0300048],[176.82562920000001],[176.19126170000001],[174.3422305],[171.86595539999999],[170.4351369],[169.74793389999999],[166.76160669999999],[172.83893399999999],[170.9521551],[168.29865960000001],[166.5075674],[165.8196222],[164.45694760000001],[162.5843591],[161.66487989999999],[158.85587520000001],[157.11231720000001],[155.4448246],[156.72665520000001],[157.1937346],[156.1732336],[162.7583836],[161.79756359999999],[160.59246859999999],[159.81741500000001],[158.8787719],[159.05945059999999],[159.1298079],[157.8208626],[155.99210629999999],[155.79708500000001],[154.01527110000001],[153.72867210000001],[151.9462193],[151.15884149999999],[157.9086911],[159.76451410000001],[160.05177839999999],[163.19904880000001],[163.97046979999999],[163.9186579],[163.20503199999999],[162.0097288],[161.5094617],[162.6125916],[162.26962689999999],[163.3776269],[164.51937419999999],[164.73169759999999],[173.1753076],[173.8639258],[173.80816160000001],[171.80405809999999],[171.70210990000001],[172.08265059999999],[172.03935050000001],[172.24046200000001],[171.85487219999999],[170.72638889999999],[167.7992663],[167.4705802],[167.3884602],[166.90544700000001],[171.9608696],[171.44443609999999],[170.0773571],[168.62519900000001],[168.42550059999999],[167.12236390000001],[170.21674490000001],[170.70328129999999],[173.65768080000001],[175.1635914],[175.30772630000001],[175.51816600000001],[175.9275729],[176.6581908],[182.54750000000001],[183.7524646],[183.440327],[182.89908310000001],[183.2753203],[183.2941051],[182.84630559999999],[182.14764740000001],[181.5706352],[180.59452870000001],[179.16494019999999],[178.6363503],[179.17124000000001],[177.95653250000001],[182.33194270000001],[183.0281736],[184.35271539999999],[184.38529600000001],[184.4182648],[185.51914300000001],[184.72032300000001],[186.2035841],[186.17970310000001],[185.21896630000001],[184.91774599999999],[185.31851510000001],[185.84271029999999],[187.2755569],[196.9260754],[204.35355179999999],[210.38921619999999],[212.58199089999999],[213.7870561],[215.87598489999999],[216.9140065],[216.23548600000001],[215.009749],[213.2176662],[211.33751380000001],[210.0456365],[209.41374260000001],[206.6262783],[209.79655099999999],[207.85783430000001],[206.10936720000001],[204.08911000000001],[202.99639819999999],[201.46313839999999],[199.94836069999999],[194.59207559999999],[188.97528170000001],[184.7213672],[181.4463394],[179.12685339999999],[175.5544658],[170.4060173],[171.88950790000001],[170.1164622],[168.2626611],[166.71925289999999],[165.77448469999999],[164.71936450000001],[163.34171850000001],[161.99571320000001],[160.65721049999999],[159.52747690000001],[158.94568810000001],[158.56984589999999],[158.21800709999999],[158.19094999999999],[165.77829460000001],[172.1877015],[175.95670100000001],[176.78786450000001],[177.99020590000001],[179.14497170000001],[179.8106746],[179.68519620000001],[179.4346597],[178.27220220000001],[177.58166309999999],[178.4752632],[178.35556080000001],[179.21163870000001],[182.80317590000001],[180.19056950000001],[179.6147842],[181.3569024],[182.75450549999999],[183.56332570000001],[183.70349379999999],[184.30913839999999],[184.70151949999999],[186.06593699999999],[188.08587],[190.94368370000001],[193.55351730000001],[195.69103480000001],[202.28411610000001],[204.10086050000001],[204.87904119999999],[205.8333485],[206.57313690000001],[205.56510170000001],[202.92354460000001],[200.3912206],[198.86303799999999],[197.33940939999999],[195.8159847],[195.33645229999999],[195.11721180000001],[195.01785709999999],[197.56152019999999],[197.35849920000001],[196.62058730000001],[198.1360488],[200.95104470000001],[201.9381257],[202.12698140000001],[201.1371997],[200.5199365],[199.7163338],[199.22938139999999],[199.6133591],[199.98793430000001],[200.53148859999999],[205.71806470000001],[208.51265359999999],[210.90771229999999],[214.01579359999999],[215.60144589999999],[216.07546199999999],[214.05896089999999],[212.37894299999999],[211.0447972],[209.67086459999999],[208.68171190000001],[207.76840490000001],[207.433649],[206.2464799],[211.19942180000001],[211.24491889999999],[211.39699999999999],[211.69399999999999],[213.91300000000001],[215.15299999999999],[215.214],[216.13999999999999],[213.667],[210.31100000000001],[207.02099999999999],[205.517],[204.297],[202.01400000000001],[204.24000000000001],[202.10900000000001],[199.339],[196.691],[194.17099999999999],[191.67599999999999],[188.99600000000001],[189.339],[188.03],[187.46299999999999],[185.11000000000001],[183.429],[180.38800000000001],[176.65100000000001],[179.32499999999999],[177.035],[174.55600000000001],[171.89599999999999],[169.608],[170.68700000000001],[168.95500000000001],[173.17099999999999],[171.89500000000001],[169.73500000000001],[167.416],[166.62700000000001],[165.61099999999999],[163.74600000000001],[169.17599999999999],[167.77500000000001],[166.125],[165.316],[166.43100000000001],[167.85900000000001],[168.50899999999999],[173.24700000000001],[173.83600000000001],[172.81299999999999],[173.00899999999999],[173.52000000000001],[175.489],[174.81],[181.971],[180.637],[178.792],[176.554],[176.47399999999999],[178.29599999999999],[175.86699999999999],[173.82400000000001],[171.274],[168.22200000000001],[166.00700000000001],[164.82900000000001],[163.09999999999999],[160.41800000000001],[163.87700000000001],[162.279],[161.006],[160.13999999999999],[160.07400000000001],[160.13399999999999],[160.95500000000001],[164.14500000000001],[164.376],[163.499],[163.334],[164.06299999999999],[166.36199999999999],[166.81299999999999],[174.96199999999999],[176.86699999999999],[177.613],[178.71000000000001],[182.98099999999999],[184.43799999999999],[182.703],[184.11699999999999],[184.46700000000001],[184.47999999999999],[183.148],[182.797],[182.809],[182.17500000000001],[186.14400000000001],[184.69200000000001],[183.518],[182.21700000000001],[180.56100000000001],[178.71199999999999],[176.07400000000001],[176.392],[176.364],[176.45699999999999],[178.26499999999999],[179.648],[179.5],[178.89699999999999],[182.863],[181.53200000000001],[181.233],[180.67400000000001],[179.989],[181.22399999999999],[184.70500000000001],[188.99100000000001],[187.239],[186.43299999999999],[186.01300000000001],[186.46799999999999],[186.518],[188.25399999999999],[197.071],[197.321],[197.23599999999999],[197.529],[195.68799999999999],[196.53100000000001],[197.179],[201.761],[200.88499999999999],[198.221],[195.49799999999999],[194.50399999999999],[193.679],[192.19200000000001],[195.327],[192.96899999999999],[190.20699999999999],[187.255],[185.59200000000001],[185.047],[183.92400000000001],[187.24299999999999],[186.36199999999999],[185.43799999999999],[184.374],[184.04599999999999],[182.351],[179.18100000000001],[179.92400000000001]],[[127.09999999999999],[105.48],[105.48],[105.48],[105.48],[105.48],[105.48],[105.48],[105.48],[105.48],[105.48],[105.48],[105.48],[105.48],[105.48],[105.48],[105.48],[105.48],[105.48],[105.48],[105.48],[105.48],[105.48],[105.48],[105.48],[105.48],[105.48],[105.48],[105.48],[105.48],[105.48],[107.23],[107.23],[107.23],[107.23],[107.23],[107.23],[107.23],[107.23],[107.23],[107.23],[107.23],[107.23],[107.23],[107.23],[107.23],[107.23],[107.23],[107.23],[107.23],[107.23],[107.23],[107.23],[107.23],[107.23],[107.23],[107.23],[107.23],[107.23],[107.23],[107.23],[107.23],[118.87],[118.87],[118.87],[118.87],[118.87],[118.87],[118.87],[118.87],[118.87],[118.87],[118.87],[118.87],[118.87],[118.87],[118.87],[118.87],[118.87],[118.87],[118.87],[118.87],[118.87],[118.87],[118.87],[118.87],[118.87],[118.87],[118.87],[118.87],[118.87],[118.87],[124.25],[124.25],[124.25],[124.25],[124.25],[124.25],[124.25],[124.25],[124.25],[124.25],[124.25],[124.25],[124.25],[124.25],[124.25],[124.25],[124.25],[124.25],[124.25],[124.25],[124.25],[124.25],[124.25],[124.25],[124.25],[124.25],[124.25],[124.25],[124.25],[124.25],[124.25],[123.04000000000001],[123.04000000000001],[123.04000000000001],[123.04000000000001],[123.04000000000001],[123.04000000000001],[123.04000000000001],[123.04000000000001],[123.04000000000001],[123.04000000000001],[123.04000000000001],[123.04000000000001],[123.04000000000001],[123.04000000000001],[123.04000000000001],[123.04000000000001],[123.04000000000001],[123.04000000000001],[123.04000000000001],[123.04000000000001],[123.04000000000001],[123.04000000000001],[123.04000000000001],[123.04000000000001],[123.04000000000001],[123.04000000000001],[123.04000000000001],[123.04000000000001],[123.04000000000001],[123.04000000000001],[123.04000000000001],[122.72],[122.72],[122.72],[122.72],[122.72],[122.72],[122.72],[122.72],[122.72],[122.72],[122.72],[122.72],[122.72],[122.72],[122.72],[122.72],[122.72],[122.72],[122.72],[122.72],[122.72],[122.72],[122.72],[122.72],[122.72],[122.72],[122.72],[122.72],[122.72],[122.72],[121.79000000000001],[121.79000000000001],[121.79000000000001],[121.79000000000001],[121.79000000000001],[121.79000000000001],[121.79000000000001],[121.79000000000001],[121.79000000000001],[121.79000000000001],[121.79000000000001],[121.79000000000001],[121.79000000000001],[121.79000000000001],[121.79000000000001],[121.79000000000001],[121.79000000000001],[121.79000000000001],[121.79000000000001],[121.79000000000001],[121.79000000000001],[121.79000000000001],[121.79000000000001],[121.79000000000001],[121.79000000000001],[121.79000000000001],[121.79000000000001],[121.79000000000001],[121.79000000000001],[121.79000000000001],[121.79000000000001],[120.64],[120.64],[120.64],[120.64],[120.64],[120.64],[120.64],[120.64],[120.64],[120.64],[120.64],[120.64],[120.64],[120.64],[120.64],[120.64],[120.64],[120.64],[120.64],[120.64],[120.64],[120.64],[120.64],[120.64],[120.64],[120.64],[120.64],[120.64],[120.64],[120.64],[126.98999999999999],[126.98999999999999],[126.98999999999999],[126.98999999999999],[126.98999999999999],[126.98999999999999],[126.98999999999999],[126.98999999999999],[126.98999999999999],[126.98999999999999],[126.98999999999999],[126.98999999999999],[126.98999999999999],[126.98999999999999],[126.98999999999999],[126.98999999999999],[126.98999999999999],[126.98999999999999],[126.98999999999999],[126.98999999999999],[126.98999999999999],[126.98999999999999],[126.98999999999999],[126.98999999999999],[126.98999999999999],[126.98999999999999],[126.98999999999999],[126.98999999999999],[126.98999999999999],[126.98999999999999],[126.98999999999999],[128.74000000000001],[128.74000000000001],[128.74000000000001],[128.74000000000001],[128.74000000000001],[128.74000000000001],[128.74000000000001],[128.74000000000001],[128.74000000000001],[128.74000000000001],[128.74000000000001],[128.74000000000001],[128.74000000000001],[128.74000000000001],[128.74000000000001],[128.74000000000001],[128.74000000000001],[128.74000000000001],[128.74000000000001],[128.74000000000001],[128.74000000000001],[128.74000000000001],[128.74000000000001],[128.74000000000001],[128.74000000000001],[128.74000000000001],[128.74000000000001],[128.74000000000001],[128.74000000000001],[128.74000000000001],[128.74000000000001],[133.06],[133.06],[133.06],[133.06],[133.06],[133.06],[133.06],[133.06],[133.06],[133.06],[133.06],[133.06],[133.06],[133.06],[133.06],[133.06],[133.06],[133.06],[133.06],[133.06],[133.06],[133.06],[133.06],[133.06],[133.06],[133.06],[133.06],[133.06],[141.97999999999999],[141.97999999999999],[141.97999999999999],[141.97999999999999],[141.97999999999999],[141.97999999999999],[141.97999999999999],[141.97999999999999],[141.97999999999999],[141.97999999999999],[141.97999999999999],[141.97999999999999],[141.97999999999999],[141.97999999999999],[141.97999999999999],[141.97999999999999],[141.97999999999999],[141.97999999999999],[141.97999999999999],[141.97999999999999],[141.97999999999999],[141.97999999999999],[141.97999999999999],[141.97999999999999],[141.97999999999999],[141.97999999999999],[141.97999999999999],[141.97999999999999],[141.97999999999999],[141.97999999999999],[141.97999999999999],[144.16999999999999],[144.16999999999999],[144.16999999999999],[144.16999999999999],[144.16999999999999],[144.16999999999999],[144.16999999999999],[144.16999999999999],[144.16999999999999],[144.16999999999999],[144.16999999999999],[144.16999999999999],[144.16999999999999],[144.16999999999999],[144.16999999999999],[144.16999999999999],[144.16999999999999],[144.16999999999999],[144.16999999999999],[144.16999999999999],[144.16999999999999],[144.16999999999999],[144.16999999999999],[144.16999999999999],[144.16999999999999],[144.16999999999999],[144.16999999999999],[144.16999999999999],[144.16999999999999],[144.16999999999999],[143.24000000000001],[143.24000000000001],[143.24000000000001],[143.24000000000001],[143.24000000000001],[143.24000000000001],[143.24000000000001],[143.24000000000001],[143.24000000000001],[143.24000000000001],[143.24000000000001],[143.24000000000001],[143.24000000000001],[143.24000000000001],[143.24000000000001],[143.24000000000001],[143.24000000000001],[143.24000000000001],[143.24000000000001],[143.24000000000001],[143.24000000000001],[143.24000000000001],[143.24000000000001],[143.24000000000001],[143.24000000000001],[143.24000000000001],[143.24000000000001],[143.24000000000001],[143.24000000000001],[143.24000000000001],[143.24000000000001],[143.38999999999999],[143.38999999999999],[143.38999999999999],[143.38999999999999],[143.38999999999999],[143.38999999999999],[143.38999999999999],[143.38999999999999],[143.38999999999999],[143.38999999999999],[143.38999999999999],[143.38999999999999],[143.38999999999999],[143.38999999999999],[143.38999999999999],[143.38999999999999],[143.38999999999999],[143.38999999999999],[143.38999999999999],[143.38999999999999],[143.38999999999999],[143.38999999999999],[143.38999999999999],[143.38999999999999],[143.38999999999999],[143.38999999999999],[143.38999999999999],[143.38999999999999],[143.38999999999999],[143.38999999999999],[153.16999999999999],[153.16999999999999],[153.16999999999999],[153.16999999999999],[153.16999999999999],[153.16999999999999],[153.16999999999999],[153.16999999999999],[153.16999999999999],[153.16999999999999],[153.16999999999999],[153.16999999999999],[153.16999999999999],[153.16999999999999],[153.16999999999999],[153.16999999999999],[153.16999999999999],[153.16999999999999],[153.16999999999999],[153.16999999999999],[153.16999999999999],[153.16999999999999],[153.16999999999999],[153.16999999999999],[153.16999999999999],[153.16999999999999],[153.16999999999999],[153.16999999999999],[153.16999999999999],[153.16999999999999],[153.16999999999999],[152.61000000000001],[152.61000000000001],[152.61000000000001],[152.61000000000001],[152.61000000000001],[152.61000000000001],[152.61000000000001],[152.61000000000001],[152.61000000000001],[152.61000000000001],[152.61000000000001],[152.61000000000001],[152.61000000000001],[152.61000000000001],[152.61000000000001],[152.61000000000001],[152.61000000000001],[152.61000000000001],[152.61000000000001],[152.61000000000001],[152.61000000000001],[152.61000000000001],[152.61000000000001],[152.61000000000001],[152.61000000000001],[152.61000000000001],[152.61000000000001],[152.61000000000001],[152.61000000000001],[152.61000000000001],[152.61000000000001],[155.81999999999999],[155.81999999999999],[155.81999999999999],[155.81999999999999],[155.81999999999999],[155.81999999999999],[155.81999999999999],[155.81999999999999],[155.81999999999999],[155.81999999999999],[155.81999999999999],[155.81999999999999],[155.81999999999999],[155.81999999999999],[155.81999999999999],[155.81999999999999],[155.81999999999999],[155.81999999999999],[155.81999999999999],[155.81999999999999],[155.81999999999999],[155.81999999999999],[155.81999999999999],[155.81999999999999],[155.81999999999999],[155.81999999999999],[155.81999999999999],[155.81999999999999],[155.81999999999999],[155.81999999999999],[164.37],[164.37],[164.37],[164.37],[164.37],[164.37],[164.37],[164.37],[164.37],[164.37],[164.37],[164.37],[164.37],[164.37],[164.37],[164.37],[164.37],[164.37],[164.37],[164.37],[164.37],[164.37],[164.37],[164.37],[164.37],[164.37],[164.37],[164.37],[164.37],[164.37],[164.37],[168.56],[168.56],[168.56],[168.56],[168.56],[168.56],[168.56],[168.56],[168.56],[168.56],[168.56],[168.56],[168.56],[168.56],[168.56],[168.56],[168.56],[168.56],[168.56],[168.56],[168.56],[168.56],[168.56],[168.56],[168.56],[168.56],[168.56],[168.56],[168.56],[168.56],[159.83000000000001],[159.83000000000001],[159.83000000000001],[159.83000000000001],[159.83000000000001],[159.83000000000001],[159.83000000000001],[159.83000000000001],[159.83000000000001],[159.83000000000001],[159.83000000000001],[159.83000000000001],[159.83000000000001],[159.83000000000001],[159.83000000000001],[159.83000000000001],[159.83000000000001],[159.83000000000001],[159.83000000000001],[159.83000000000001],[159.83000000000001],[159.83000000000001],[159.83000000000001],[159.83000000000001],[159.83000000000001],[159.83000000000001],[159.83000000000001],[159.83000000000001],[159.83000000000001],[159.83000000000001],[159.83000000000001],[167.93000000000001],[167.93000000000001],[167.93000000000001],[167.93000000000001],[167.93000000000001],[167.93000000000001],[167.93000000000001],[167.93000000000001],[167.93000000000001],[167.93000000000001],[167.93000000000001],[167.93000000000001],[167.93000000000001],[167.93000000000001],[167.93000000000001],[167.93000000000001],[167.93000000000001],[167.93000000000001],[167.93000000000001],[167.93000000000001],[167.93000000000001],[167.93000000000001],[167.93000000000001],[167.93000000000001],[167.93000000000001],[167.93000000000001],[167.93000000000001],[167.93000000000001],[167.93000000000001],[167.93000000000001],[167.93000000000001],[179.94999999999999],[179.94999999999999],[179.94999999999999],[179.94999999999999],[179.94999999999999],[179.94999999999999],[179.94999999999999],[179.94999999999999],[179.94999999999999],[179.94999999999999],[179.94999999999999],[179.94999999999999],[179.94999999999999],[179.94999999999999],[179.94999999999999],[179.94999999999999],[179.94999999999999],[179.94999999999999],[179.94999999999999],[179.94999999999999],[179.94999999999999],[179.94999999999999],[179.94999999999999],[179.94999999999999],[179.94999999999999],[179.94999999999999],[179.94999999999999],[179.94999999999999],[201.75],[201.75],[201.75],[201.75],[201.75],[201.75],[201.75],[201.75],[201.75],[201.75],[201.75],[201.75],[201.75],[201.75],[201.75],[201.75],[201.75],[201.75],[201.75],[201.75],[201.75],[201.75],[201.75],[201.75],[201.75],[201.75],[201.75],[201.75],[201.75],[201.75],[201.75],[170.69],[170.69],[170.69],[170.69],[170.69],[170.69],[170.69],[170.69],[170.69],[170.69],[170.69],[170.69],[170.69],[170.69],[170.69],[170.69],[170.69],[170.69],[170.69],[170.69],[170.69],[170.69],[170.69],[170.69],[170.69],[170.69],[170.69],[170.69],[170.69],[170.69],[191.72],[191.72],[191.72],[191.72],[191.72],[191.72],[191.72],[191.72],[191.72],[191.72],[191.72],[191.72],[191.72],[191.72],[191.72],[191.72],[191.72],[191.72],[191.72],[191.72],[191.72],[191.72],[191.72],[191.72],[191.72],[191.72],[191.72],[191.72],[191.72],[191.72],[191.72],[205.53],[205.53],[205.53],[205.53],[205.53],[205.53],[205.53],[205.53],[205.53],[205.53],[205.53],[205.53],[205.53],[205.53],[205.53],[205.53],[205.53],[205.53],[205.53],[205.53],[205.53],[205.53],[205.53],[205.53],[205.53],[205.53],[205.53],[205.53],[205.53],[205.53],[195.69],[195.69],[195.69],[195.69],[195.69],[195.69],[195.69],[195.69],[195.69],[195.69],[195.69],[195.69],[195.69],[195.69],[195.69],[195.69],[195.69],[195.69],[195.69],[195.69],[195.69],[195.69],[195.69],[195.69],[195.69],[195.69],[195.69],[195.69],[195.69],[195.69],[195.69],[171.88],[171.88],[171.88],[171.88],[171.88],[171.88],[171.88],[171.88],[171.88],[171.88],[171.88],[171.88],[171.88],[171.88],[171.88],[171.88],[171.88],[171.88],[171.88],[171.88],[171.88],[171.88],[171.88],[171.88],[171.88],[171.88],[171.88],[171.88],[171.88],[171.88],[171.88],[169.53999999999999],[169.53999999999999],[169.53999999999999],[169.53999999999999],[169.53999999999999],[169.53999999999999],[169.53999999999999],[169.53999999999999],[169.53999999999999],[169.53999999999999],[169.53999999999999],[169.53999999999999],[169.53999999999999],[169.53999999999999],[169.53999999999999],[169.53999999999999],[169.53999999999999],[169.53999999999999],[169.53999999999999],[169.53999999999999],[169.53999999999999],[169.53999999999999],[169.53999999999999],[169.53999999999999],[169.53999999999999],[169.53999999999999],[169.53999999999999],[169.53999999999999],[169.53999999999999],[169.53999999999999],[182.00999999999999],[182.00999999999999],[182.00999999999999],[182.00999999999999],[182.00999999999999],[182.00999999999999],[182.00999999999999],[182.00999999999999],[182.00999999999999],[182.00999999999999],[182.00999999999999],[182.00999999999999],[182.00999999999999],[182.00999999999999],[182.00999999999999],[182.00999999999999],[182.00999999999999],[182.00999999999999],[182.00999999999999],[182.00999999999999],[182.00999999999999],[182.00999999999999],[182.00999999999999],[182.00999999999999],[182.00999999999999],[182.00999999999999],[182.00999999999999],[182.00999999999999],[182.00999999999999],[182.00999999999999],[182.00999999999999],[191.09299999999999],[191.09299999999999],[191.09299999999999],[191.09299999999999],[191.09299999999999],[191.09299999999999],[191.09299999999999],[191.09299999999999],[191.09299999999999],[191.09299999999999],[191.09299999999999],[191.09299999999999],[191.09299999999999],[191.09299999999999],[191.09299999999999],[191.09299999999999],[191.09299999999999],[191.09299999999999],[191.09299999999999],[191.09299999999999],[191.09299999999999],[191.09299999999999],[191.09299999999999],[191.09299999999999],[191.09299999999999],[191.09299999999999],[191.09299999999999],[191.09299999999999],[191.09299999999999],[191.09299999999999]]]
[]
[{"axis_id":"0","tick_interval":"","axis_min":"","axis_max":"","axis_title":"","precision":-1,"axis_units":"","tooltip_units":"","table_units":"","data_unit_prefix":"","data_unit_suffix":"","reverse_axis":false}][{"value":"0","axis_id":"0","axis_title":"Percentage change (%)","axis_units":"","tooltip_units":"(%)","table_units":"(%)","axis_min":null,"axis_max":null,"tick_interval":null,"precision":"1","data_unit_prefix":"","data_unit_suffix":"","reverse_axis":false}]The Furniture, household equipment and services group rose 8.4% in the year to November. Higher freight and raw material costs recorded in mid 2022 contributed to price rises for furniture.
Non-durable household products contributed to the rise, driven by price increases for cleaning and maintenance products.
Holiday travel and accommodation prices rose 12.8% in the year to November, up from 3.7% in October. High jet fuel prices and strong travel demand throughout 2022, compared to COVID-19 affected 2021, have contributed to higher prices for airfares and accommodation.
In monthly terms, November’s increase of 4.3% varies from the falls usually seen in November, reflecting strong consumer demand for domestic accommodation and domestic and international airfares.
| monthly change (%)(1) | annual change (%) | |
|---|---|---|
| Nov-18 | -3.2 | 3.6 |
| Dec-18 | 13.3 | 5 |
| Jan-19 | -2.5 | 3.9 |
| Feb-19 | -9.7 | 1.9 |
| Mar-19 | -2.9 | 0 |
| Apr-19 | 10.5 | 4.9 |
| May-19 | -7.1 | 2.6 |
| Jun-19 | 2.8 | 3.6 |
| Jul-19 | 8.2 | 3.2 |
| Aug-19 | -6.8 | 4.8 |
| Sep-19 | 1.5 | 2.4 |
| Oct-19 | 2.9 | 4.4 |
| Nov-19 | -6.2(2) | 1.2 |
| Dec-19 | 14.6 | 2.3 |
| Jan-20 | -1.1 | 3.8 |
| Feb-20 | -13.4 | -0.5 |
| Mar-20 | 1.9 | 4.4 |
| Apr-20 | 2.7 | -3 |
| May-20 | -2 | 2.3 |
| Jun-20 | -0.4 | -0.9 |
| Jul-20 | 6 | -2.9 |
| Aug-20 | -0.5 | 3.7 |
| Sep-20 | -9.1 | -7.1 |
| Oct-20 | -1.1 | -10.7 |
| Nov-20 | -0.9(3) | -5.7 |
| Dec-20 | 11.6 | -8.2 |
| Jan-21 | -2.6 | -9.6 |
| Feb-21 | -7.9 | -3.9 |
| Mar-21 | -1.5 | -7.1 |
| Apr-21 | 5.8 | -4.2 |
| May-21 | -6.1 | -8.3 |
| Jun-21 | 4.3 | -4 |
| Jul-21 | -1.4 | -10.7 |
| Aug-21 | -0.3 | -10.5 |
| Sep-21 | 4.5 | 2.8 |
| Oct-21 | 1.7 | 5.7 |
| Nov-21 | -4.1(4) | 2.3 |
| Dec-21 | 10.8 | 1.5 |
| Jan-22 | 1.9 | 6.1 |
| Feb-22 | -12.4 | 1 |
| Mar-22 | 2.3 | 5 |
| Apr-22 | 9 | 8.2 |
| May-22 | -7.5 | 6.6 |
| Jun-22 | 5.4 | 7.8 |
| Jul-22 | 3.6 | 13.3 |
| Aug-22 | -5 | 7.9 |
| Sep-22 | 9.1 | 12.6 |
| Oct-22 | -6.4 | 3.7 |
| Nov-22 | 4.3(5) | 12.8 |
Holiday travel and accommodation, Australia, monthly and annual movement (%)
["","monthly change","annual change"]
[["Nov-18","Dec-18","Jan-19","Feb-19","Mar-19","Apr-19","May-19","Jun-19","Jul-19","Aug-19","Sep-19","Oct-19","Nov-19","Dec-19","Jan-20","Feb-20","Mar-20","Apr-20","May-20","Jun-20","Jul-20","Aug-20","Sep-20","Oct-20","Nov-20","Dec-20","Jan-21","Feb-21","Mar-21","Apr-21","May-21","Jun-21","Jul-21","Aug-21","Sep-21","Oct-21","Nov-21","Dec-21","Jan-22","Feb-22","Mar-22","Apr-22","May-22","Jun-22","Jul-22","Aug-22","Sep-22","Oct-22","Nov-22"],[[-3.2000000000000002],[13.300000000000001],[-2.5],[-9.6999999999999993],[-2.8999999999999999],[10.5],[-7.0999999999999996],[2.7999999999999998],[8.1999999999999993],[-6.7999999999999998],[1.5],[2.8999999999999999],[-6.2000000000000002],[14.6],[-1.1000000000000001],[-13.4],[1.8999999999999999],[2.7000000000000002],[-2],[-0.40000000000000002],[6],[-0.5],[-9.0999999999999996],[-1.1000000000000001],[-0.90000000000000002],[11.6],[-2.6000000000000001],[-7.9000000000000004],[-1.5],[5.7999999999999998],[-6.0999999999999996],[4.2999999999999998],[-1.3999999999999999],[-0.29999999999999999],[4.5],[1.7],[-4.0999999999999996],[10.800000000000001],[1.8999999999999999],[-12.4],[2.2999999999999998],[9],[-7.5],[5.4000000000000004],[3.6000000000000001],[-5],[9.0999999999999996],[-6.4000000000000004],[4.2999999999999998]],[[3.6000000000000001],[5],[3.8999999999999999],[1.8999999999999999],[0],[4.9000000000000004],[2.6000000000000001],[3.6000000000000001],[3.2000000000000002],[4.7999999999999998],[2.3999999999999999],[4.4000000000000004],[1.2],[2.2999999999999998],[3.7999999999999998],[-0.5],[4.4000000000000004],[-3],[2.2999999999999998],[-0.90000000000000002],[-2.8999999999999999],[3.7000000000000002],[-7.0999999999999996],[-10.699999999999999],[-5.7000000000000002],[-8.1999999999999993],[-9.5999999999999996],[-3.8999999999999999],[-7.0999999999999996],[-4.2000000000000002],[-8.3000000000000007],[-4],[-10.699999999999999],[-10.5],[2.7999999999999998],[5.7000000000000002],[2.2999999999999998],[1.5],[6.0999999999999996],[1],[5],[8.1999999999999993],[6.5999999999999996],[7.7999999999999998],[13.300000000000001],[7.9000000000000004],[12.6],[3.7000000000000002],[12.800000000000001]]]
[{"value":"Nov 2018","annote_text":null,"x_value":"0","y_value":"-3.2","x_axis":"0","y_axis":"0","x_offset":"1","y_offset":"95","cell_row":"1","cell_column":"2"},{"value":"Nov 2019","annote_text":null,"x_value":"12","y_value":"-6.2","x_axis":"0","y_axis":"0","x_offset":"1","y_offset":"95","cell_row":"14","cell_column":"2"},{"value":"Nov 2020","annote_text":null,"x_value":"24","y_value":"-0.9","x_axis":"0","y_axis":"0","x_offset":"1","y_offset":"125","cell_row":"26","cell_column":"2"},{"value":"Nov 2021","annote_text":null,"x_value":"36","y_value":"-4.1","x_axis":"0","y_axis":"0","x_offset":"1","y_offset":"95","cell_row":"38","cell_column":"2"},{"value":"Nov 2022","annote_text":null,"x_value":"48","y_value":"4.3","x_axis":"0","y_axis":"0","x_offset":"1","y_offset":"-120","cell_row":"50","cell_column":"2"}][{"axis_id":"0","tick_interval":"","axis_min":"","axis_max":"","axis_title":"","precision":-1,"axis_units":"","tooltip_units":"","table_units":"","data_unit_prefix":"","data_unit_suffix":"","reverse_axis":false}][{"value":"0","axis_id":"0","axis_title":"Percentage change (%)","axis_units":"","tooltip_units":"(%)","table_units":"(%)","axis_min":null,"axis_max":null,"tick_interval":null,"precision":"-1","data_unit_prefix":"","data_unit_suffix":"","reverse_axis":false}]Analytical series Australia, Index Numbers and Percentage Change from Corresponding Month of Previous Year, Weighted Average of Eight Capital Cities
Analytical series, Australia, Percentage Change from previous period, Weighted Average of Eight Capital Cities
Caution: Data in Data Explorer is currently released after the 11:30am release on the ABS website. Please check the reference period when using Data Explorer.
Data explorer for the monthly CPI indicator.
For information on Data Explorer and how it works, see the Data Explorer user guide.
| Index | 2022 Weight (%) | 2021 weight (%) | Points Change |
|---|---|---|---|
| Food and non-alcoholic beverages group | 17.18 | 16.76 | 0.42 |
| Bread | 0.53 | 0.53 | 0.00 |
| Cakes and biscuits | 0.60 | 0.61 | -0.01 |
| Breakfast cereals | 0.11 | 0.12 | -0.01 |
| Other cereal products | 0.18 | 0.17 | 0.01 |
| Beef and veal | 0.53 | 0.54 | -0.01 |
| Pork | 0.29 | 0.32 | -0.03 |
| Lamb and goat | 0.29 | 0.31 | -0.02 |
| Poultry | 0.44 | 0.45 | -0.01 |
| Other meats | 0.38 | 0.39 | -0.01 |
| Fish and other seafood | 0.40 | 0.44 | -0.04 |
| Milk | 0.42 | 0.40 | 0.02 |
| Cheese | 0.30 | 0.32 | -0.02 |
| Ice cream and other dairy | 0.29 | 0.29 | 0.00 |
| Fruit | 0.96 | 1.00 | -0.04 |
| Vegetables | 1.41 | 1.31 | 0.10 |
| Eggs | 0.12 | 0.13 | -0.01 |
| Jams, honey and spreads | 0.12 | 0.13 | -0.01 |
| Food additives & condiments | 0.31 | 0.30 | 0.01 |
| Oils and fats | 0.22 | 0.20 | 0.02 |
| Snacks and confectionery | 0.83 | 0.84 | -0.01 |
| Other food products | 0.49 | 0.51 | -0.02 |
| Coffee, tea and cocoa | 0.26 | 0.24 | 0.02 |
| Waters soft drinks and juices | 0.89 | 0.86 | 0.03 |
| Restaurant meals | 3.96 | 3.42 | 0.54 |
| Takeaway and fast foods | 2.85 | 2.93 | -0.08 |
| Alcohol and tobacco group | 7.87 | 9.01 | -1.14 |
| Spirits | 0.99 | 1.03 | -0.04 |
| Wine | 1.91 | 2.06 | -0.15 |
| Beer | 2.22 | 2.36 | -0.14 |
| Tobacco | 2.75 | 3.56 | -0.81 |
| Clothing and footwear group | 3.37 | 3.33 | 0.04 |
| Garments for men | 0.53 | 0.54 | -0.01 |
| Garments for women | 1.13 | 1.13 | 0.00 |
| Garments for children | 0.32 | 0.32 | 0.00 |
| Footwear for men | 0.12 | 0.12 | 0.00 |
| Footwear for women | 0.29 | 0.29 | 0.00 |
| Footwear for children | 0.07 | 0.08 | -0.01 |
| Accessories | 0.84 | 0.74 | 0.10 |
| Cleaning, repair and hire | 0.07 | 0.11 | -0.04 |
| Housing group | 22.24 | 23.24 | -1.00 |
| Rents | 5.75 | 6.23 | -0.48 |
| New dwelling purchase | 8.62 | 8.67 | -0.05 |
| Maintenance and repair of dwelling | 2.24 | 2.29 | -0.05 |
| Property rates and charges | 1.55 | 1.61 | -0.06 |
| Water and sewerage | 0.88 | 0.95 | -0.07 |
| Electricity | 2.22 | 2.52 | -0.30 |
| Gas and other household fuels | 0.98 | 0.97 | 0.01 |
| Furnishings, household equipment & services group | 8.94 | 9.16 | -0.22 |
| Furniture | 1.54 | 1.63 | -0.09 |
| Carpets and other floor cover | 0.32 | 0.34 | -0.02 |
| Household textiles | 0.51 | 0.50 | 0.01 |
| Major household appliances | 0.43 | 0.44 | -0.01 |
| Small electrical appliances | 0.32 | 0.33 | -0.01 |
| Glassware and tableware | 0.41 | 0.42 | -0.01 |
| Tools and equipment | 0.40 | 0.41 | -0.01 |
| Cleaning and maintenance products | 0.23 | 0.23 | 0.00 |
| Personal care products | 0.89 | 0.89 | 0.00 |
| Other non-durable products | 1.31 | 1.26 | 0.05 |
| Child care | 0.82 | 0.91 | -0.09 |
| Hairdressing services | 1.08 | 1.06 | 0.02 |
| Other household services | 0.68 | 0.74 | -0.06 |
| Health group | 6.25 | 6.47 | -0.22 |
| Pharmaceutical products | 1.04 | 1.09 | -0.05 |
| Therapeutic equipment | 0.16 | 0.16 | 0.00 |
| Medical and hospital services | 4.45 | 4.56 | -0.11 |
| Dental services | 0.60 | 0.66 | -0.06 |
| Transport group | 10.99 | 10.58 | 0.41 |
| Motor vehicles | 3.04 | 3.06 | -0.02 |
| Spare parts and accessories | 0.77 | 0.70 | 0.07 |
| Automotive fuel | 3.61 | 3.28 | 0.33 |
| Maintenance and repair of vehicle | 1.87 | 1.78 | 0.09 |
| Other motor vehicle services | 1.35 | 1.40 | -0.05 |
| Urban transport fares | 0.35 | 0.36 | -0.01 |
| Communication group | 2.31 | 2.41 | -0.10 |
| Postal services | 0.10 | 0.11 | -0.01 |
| Telecommunications | 2.21 | 2.30 | -0.09 |
| Recreation and culture group | 10.84 | 8.64 | 2.20 |
| Audio, visual and computer equipment | 1.28 | 1.35 | -0.07 |
| Audio, visual and media services | 0.67 | 0.70 | -0.03 |
| Books | 0.16 | 0.18 | -0.02 |
| Newspapers, magazines and stationery | 0.37 | 0.40 | -0.03 |
| Domestic holiday travel | 2.43 | 1.95 | 0.48 |
| International holiday travel | 1.85 | 0.08 | 1.77 |
| Equipment for sports and camping | 0.61 | 0.70 | -0.09 |
| Games, toys and hobbies | 0.64 | 0.69 | -0.05 |
| Pets and related products | 0.53 | 0.50 | 0.03 |
| Vet and other pet services | 0.51 | 0.44 | 0.07 |
| Sports participation | 0.90 | 0.75 | 0.15 |
| Other recreational services | 0.89 | 0.90 | -0.01 |
| Education group | 4.43 | 4.63 | -0.2 |
| Preschool and primary education | 0.95 | 0.99 | -0.04 |
| Secondary education | 1.91 | 2.01 | -0.10 |
| Tertiary education | 1.57 | 1.63 | -0.06 |
| Insurance and financial services group | 5.56 | 5.80 | -0.24 |
| Insurance | 1.16 | 1.23 | -0.07 |
| Bank fees (direct) | 0.40 | 0.46 | -0.06 |
| Other financial services | 4.00 | 4.11 | -0.11 |
The monthly Consumer Price Index (CPI) indicator was developed to provide inflation data at a higher frequency for use by governments, economists and the wider community. The quarterly CPI remains the principal measure of household inflation.
The monthly CPI indicator is derived using available data from the quarterly CPI. The ABS collects prices for the CPI in a range of frequencies including monthly, quarterly, and annual. The frequency of price collection is determined by how often prices change. Where price change occurs frequently, such as for food and petrol, monthly price data is collected. Where price change is less frequent, such as for restaurant meals and hairdressers, price data is available quarterly. In some cases, prices are collected once per year where it is known prices only change annually. This is the case for some education fees, property rates and private health insurance.
For this reason, the composition of the monthly CPI basket varies across the three months of the quarter, details of the monthly coverage composition are Illustrated in the image below and detailed in Table 1 below.
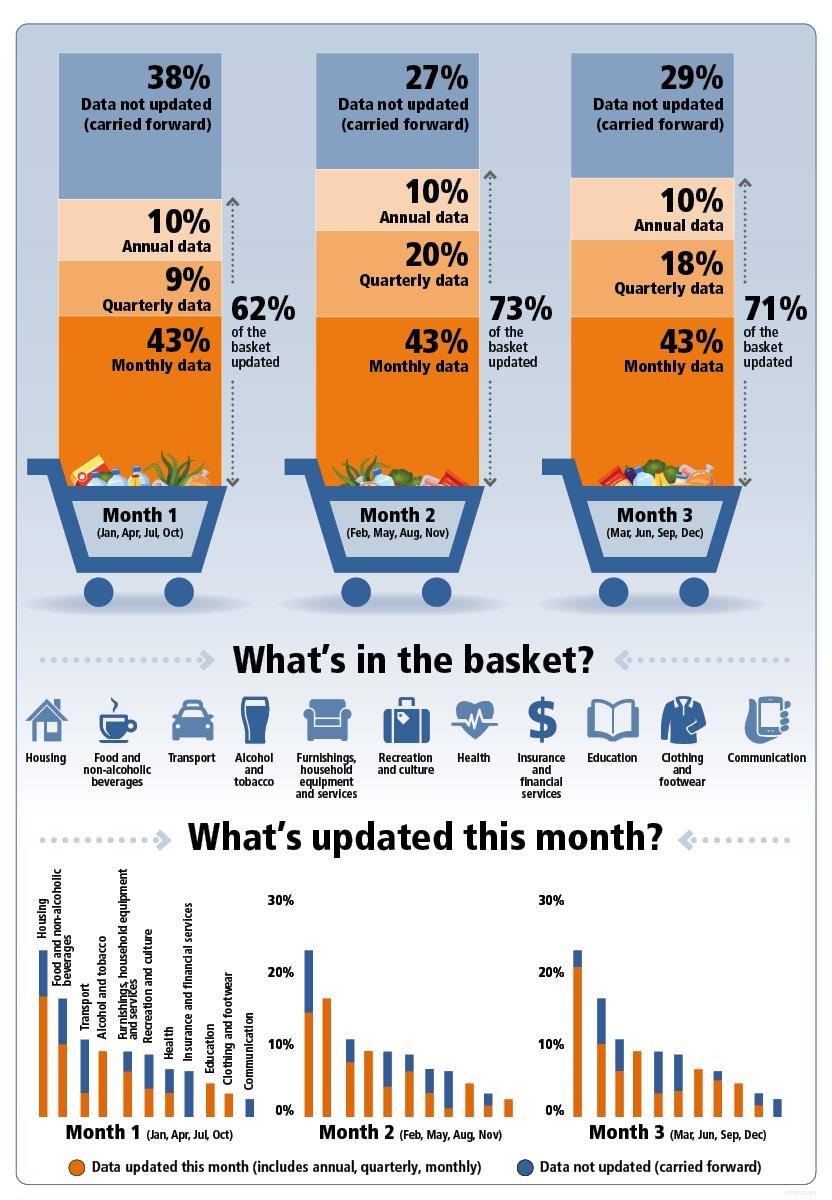
This infographic explains the frequency with which data is collected by the proportion of the quarterly CPI basket that these represent. Conceptually, the monthly CPI indicator will include all the items of the quarterly CPI basket, however, not all items in the basket will be updated with new prices each month. Where prices are not collected in a particular month, prices collected in previous months will be ‘carried forward’ (see appendix 2 for further explanation). Where prices are updated in month 2 or 3 of any given quarter, the new prices data will not be used to revise previous months in the quarter. For this reason, the average of the index in the three months for the monthly CPI indicator will not equal the index of the quarterly CPI. Including the data collected once per year: • Month 1 (January, April, July and October months) will include up-to-date price information for 62 per cent of the weight of the quarterly CPI. • Month 2 (February, May, August and November months) will include up-to-date price information for 73 per cent of the weight of the quarterly CPI. • Month 3 (March, June, September and December months) will include up-to-date price information for 71 per cent of the weight of the quarterly CPI. All eleven groups are included in each month, with the following breakdown: Month 1: 43% monthly data, 9% quarterly data, 10% annual data, 38% data not updated (carried forward) Month 2: 43% monthly data, 20% quarterly data, 10% annual data, 27% data not updated (carried forward) Month 3: 43% monthly data, 18% quarterly data, 10% annual data, 29% data not updated (carried forward) The eleven groups of the CPI basket are: Housing Food and non-alcoholic beverages Transport Alcohol and tobacco Furnishings, household equipment and services Recreation and culture Health Insurance and financial services Education Clothing and footwear Communication
| Expenditure Class (EC) | Frequency |
|---|---|
| Bread EC | Monthly |
| Cakes and biscuits EC | Monthly |
| Breakfast cereals EC | Monthly |
| Other cereal products EC | Monthly |
| Beef and veal EC | Monthly |
| Pork EC | Monthly |
| Lamb and goat EC | Monthly |
| Poultry EC | Monthly |
| Other meats EC | Monthly |
| Fish and other seafood EC | Monthly |
| Milk EC | Monthly |
| Cheese EC | Monthly |
| Ice cream & other dairy products EC | Monthly |
| Fruit EC | Monthly |
| Vegetables EC | Monthly |
| Eggs EC | Monthly |
| Jams, honey and spreads EC | Monthly |
| Food additives and condiments EC | Monthly |
| Oils and fats EC | Monthly |
| Snacks and confectionery EC | Monthly |
| Other food products n.e.c.* EC | Monthly |
| Coffee, tea and cocoa EC | Monthly |
| Waters soft drinks & juices EC | Monthly |
| Restaurant meals EC | Quarterly |
| Takeaway and fast foods EC | Quarterly |
| Spirits EC | Monthly |
| Wine EC | Monthly |
| Beer EC | Monthly |
| Tobacco EC | Monthly |
| Garments for men EC | Monthly |
| Garments for women EC | Monthly |
| Garments for infant and child EC | Quarterly |
| Footwear for men EC | Quarterly |
| Footwear for women EC | Quarterly |
| Footwear for infant & child EC | Quarterly |
| Accessories EC | Quarterly |
| Cleaning, repair and hire EC | Quarterly |
| Rents EC | Monthly |
| New dwell purchase by own occupied EC | Monthly |
| Maintenance and repair of dwelling EC | Quarterly |
| Property rates and charges EC | Annual |
| Water and sewerage EC | Quarterly |
| Electricity EC | Quarterly |
| Gas and other household fuels EC | Quarterly |
| Furniture EC | Quarterly |
| Carpets and other floor cover EC | Quarterly |
| Household textiles EC | Quarterly |
| Major household appliances EC | Quarterly |
| Small electrical and household appliances EC | Quarterly |
| Glassware,tableware and household EC | Quarterly |
| Tools and equipment EC | Quarterly |
| Cleaning and maintenance prod EC | Monthly |
| Personal care products EC | Monthly |
| Other non-durable household products EC | Monthly |
| Child care EC | Quarterly |
| Hairdressing and personal grooming services EC | Quarterly |
| Other household services EC | Quarterly |
| Pharmaceutical products EC | Quarterly |
| Therapeutic app and equip EC | Quarterly |
| Medical & hospital services EC | |
| Medical services | Quarterly |
| Private health insurance | Annual |
| Dental services EC | Quarterly |
| Motor vehicles EC | Quarterly |
| Spare parts and accessories EC | Quarterly |
| Automotive fuel EC | Monthly |
| Maintenance and repair of vehicle EC | Quarterly |
| Other services in respect of motor vehicle EC | Quarterly |
| Urban transport fares EC | Quarterly |
| Postal services EC | Monthly |
| Telecom equip & services EC | Quarterly |
| Audio,visual & comp equip EC | Quarterly |
| Audio, visual, media&serv EC | Quarterly |
| Books EC | Quarterly |
| Newspaper magazine and station EC | Quarterly |
| Domestic holiday travel & accommodation EC | Monthly |
| Intern holiday travel & accommodation EC | Monthly |
| Equipment for sports,camp EC | Quarterly |
| Games, toys and hobbies EC | Quarterly |
| Pets and related products EC | Monthly |
| Vet & other pet services EC | Quarterly |
| Sports participation EC | Quarterly |
| Other recreational sports & cultural services EC | Quarterly |
| Preschool&primary education EC | Quarterly & Annual |
| Secondary education EC | Annual |
| Tertiary education EC | Bi-annual |
| Insurance EC | Quarterly |
| D&L Facilities (direct) EC | Monthly |
| Other financial services EC | Quarterly |
* n.e.c Not elsewhere classified
| Month 1 | Month 2 | Month 3 | ||
|---|---|---|---|---|
| Bread | Bread | Bread | ||
| Cakes and biscuits | Cakes and biscuits | Cakes and biscuits | ||
| Breakfast cereals | Breakfast cereals | Breakfast cereals | ||
| Other cereal products | Other cereal products | Other cereal products | ||
| Beef and veal | Beef and veal | Beef and veal | ||
| Pork | Pork | Pork | ||
| Lamb and goat | Lamb and goat | Lamb and goat | ||
| Poultry | Poultry | Poultry | ||
| Other meats | Other meats | Other meats | ||
| Fish and other seafood | Fish and other seafood | Fish and other seafood | ||
| Milk | Milk | Milk | ||
| Cheese | Cheese | Cheese | ||
| Ice cream & other dairy prod | Ice cream & other dairy prod | Ice cream & other dairy prod | ||
| Fruit | Fruit | Fruit | ||
| Vegetables | Vegetables | Vegetables | ||
| Eggs | Eggs | Eggs | ||
| Jams, honey & spreads | Jams, honey & spreads | Jams, honey & spreads | ||
| Food additives & condiments | Food additives & condiments | Food additives & condiments | ||
| Oils and fats | Oils and fats | Oils and fats | ||
| Snacks and confectionery | Snacks and confectionery | Snacks and confectionery | ||
| Other food products n.e.c. | Other food products n.e.c. | Other food products n.e.c. | ||
| Coffee, tea and cocoa | Coffee, tea and cocoa | Coffee, tea and cocoa | ||
| Waters soft drinks & juices | Waters soft drinks & juices | Waters soft drinks & juices | ||
| Spirits | Restaurant meals | Spirits | ||
| Wine | Takeaway and fast foods | Wine | ||
| Beer | Spirits | Beer | ||
| Tobacco | Wine | Tobacco | ||
| Garments for men | Beer | Garments for men | ||
| Garments for women | Tobacco | Garments for women | ||
| Garments for infant & child | Garments for men | Rents | ||
| Footwear for men | Garments for women | New dwelling purchase by owner occupiers | ||
| Footwear for women | Rents | Property rates and charges (Annual) | ||
| Footwear for infant & child | New dwelling purchase by owner occupiers | Water and sewerage | ||
| Accessories | Cleaning & maintenance prod | Electricity | ||
| Cleaning, repair & hire | Personal care products | Gas and other household fuels | ||
| Rents | Other non-dur household prods | Cleaning & maintenance prod | ||
| New dwelling purchase by owner occupiers | Spare parts & accessories | Personal care products | ||
| Maintenance & repair of dwelling | Automotive fuel | Other non-dur household prods | ||
| Automotive fuel | Maintenance & repair of vehicle | Automotive fuel | ||
| Furniture | Other services in respect of motor vehicle | Child care | ||
| Carpets & other floor cover | Urban transport fares | Hairdressing & personal grooming | ||
| Household textiles | Postal services | Other household services | ||
| Major household appliances | Telecommunications equip & services | Pharmaceutical products | ||
| Small electronic household appliances | Audio,visual & computer equipment | Therapeutic appliances and equipment | ||
| Glassware, tableware & household | Audio, visual, media & services | Medical & hospital services | ||
| Tools & equipment | Domestic holiday travel & accommodation | Medical services | ||
| Cleaning & maintenance prod | International holiday travel & accommodation | Private Health insurance (Annual) | ||
| Personal care products | Equipment for sports,camp | Dental services | ||
| Other non-durable household prods | Games, toys and hobbies | Motor vehicles | ||
| Postal services | Pets and related products | Postal services | ||
| Audio,visual & computer equipment | Sports participation | Audio,visual & computer equipment | ||
| Domestic holiday travel & accommodation | Other recreational sports & cultural services | Books | ||
| International holiday travel & accommodation | Preschool & primary education (quarterly & Annual) | Newspaper magazine & stationery | ||
| Pets and related products | Secondary education (Annual) | Domestic holiday travel & accommodation | ||
| D&L Facilities (direct) | Tertiary education (bi-annual) | International holiday travel & accommodation | ||
| Insurance | Pets and related products | |||
| D&L Facilities (direct) | Vet & other pet services | |||
| Sports participation | ||||
| D&L Facilities (direct) | ||||
| Other financial services |
Monthly CPI indicator rose 6.8% in the year to August, 29 September 2022
Introducing a monthly Consumer Price Index (CPI) indicator for Australia, 16 August 2022
Introducing a monthly CPI indicator, 16 August 2022
ABS to release new monthly CPI Indicator, 10 August 2022
New data source
What the CPI Rents series measures
Price indexes published by the Australian Bureau of Statistics (ABS) provide summary measures of the movements in various categories of prices over time. They are published primarily for use in Government economic analysis.
Consistent with existing policy, the ABS does not comment on the use (or otherwise) of the price indexes we publish. However, it should be noted that the monthly CPI indicator may be routinely subject to revision, in contrast to the quarterly CPI which is only revised in exceptional circumstances.
Use of Price Indexes in Contracts sets out a range of issues that should be taken into account by parties considering including an Indexation Clause in a contract using an ABS published price index.
Frequently Asked Questions (FAQs) specific to the monthly CPI indicator can be found in the Information paper: Introducing a monthly CPI indicator for Australia FAQs
In addition, the Frequently Asked Questions page has answers to a number of common questions to do with price indexes and the quarterly Consumer Price Index in particular.