Australian National Accounts: Supply Use Tables

This is not the latest release View the latest release

Supply use tables are an integral part of the annual compilation of the Australian System of National Accounts

Reference period
2017-18 financial year
Released
25/10/2019

Main features

This publication contains the supply-use tables for 2017-18. The data in this release is consistent with the 2018-19 release of the Australian System of National Accounts (cat. no. 5204.0).

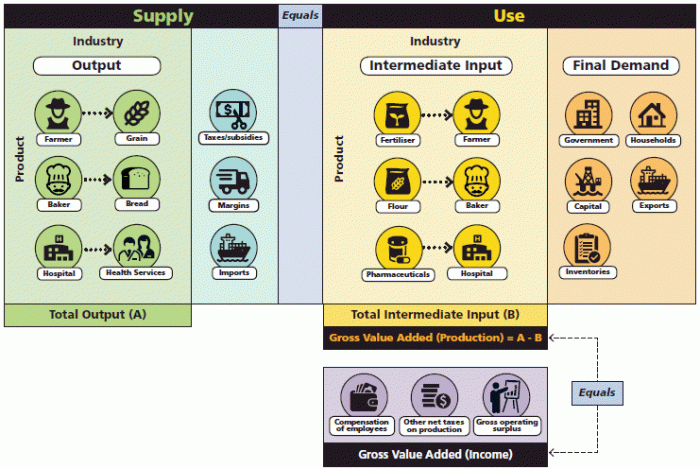
Supply-use tables are an integral and essential element of the ABS national accounts. They are building blocks for the Australian System of National Accounts as they are used to ensure GDP is balanced for all three approaches (production, expenditure and income) and provide the annual benchmarks (levels) from which the quarterly estimates are compiled. They provide detailed information about the supply and use of products in the Australian economy, and the structure of and interrelationships between Australian industries.

The supply-use time series from 1994-95 to 2017-18 are available through the ABS.Stat website http://stat.data.abs.gov.au.

Rounding

Any discrepancies between totals and sums of components in this publication are due to rounding.

Frequently asked questions

What is a supply-use table?

In their simplest form, the supply-use tables reconcile how the supply of goods and services (either as a result of domestic production or imports from other countries) within the economy in an accounting period are used for intermediate consumption by businesses, final consumption by households or the government, capital formation, exported or stored in inventories. The supply-use tables also provide the link between industry inputs, industry outputs and the primary income components of Gross Value Added (GVA).

Supply-use tables are a powerful tool to compare and contrast data from various sources and improve the coherence of the economic information system. They permit an analysis of markets and industries and allow productivity to be studied at this level of disaggregation. A fundamental role is played in the Australian System of National Accounts (ASNA) by supply-use tables as they show, for the economy as a whole and for groups of products, the total resources in terms of domestic output and imports, and the uses of goods and services in terms of intermediate consumption, final consumption, gross capital formation and exports. They also provide information on the generation of income from production.

The supply-use framework comprises two tables as shown in Figure 1. The supply table shows the total supply of products from domestic and foreign producers that are available for use in the domestic economy. The use table presents the use of this supply by industries as intermediate inputs and by final users. Once both sides are equal (i.e. supply = use) for all products, the supply-use tables are said to be balanced. Supply-use tables are compiled and balanced in both current prices and previous years prices. The combination of these measures provides the benchmarks for the current price and chain volume measures of annual GDP.

Figure 1 - supply-use tables - framework for the economy

Figure: Supply - use tables - framework for the economy
Within supply is industry, and beneath this is output. Products under output are farmer to grain, baker to bread, and hospital to health services. These all make up total output (A). Also under supply are taxes/subsidies, margins and imports. Supply equals use. Within use is industry, and beneath this is intermediate input. Products under intermediate input are fertiliser to farmer, flour to baker, and pharmaceuticals to hospital. These all make up total intermediate input (B). Also under use is final demand. Beneath final demand are government, households, capital, exports, and inventories. Gross value added (production) equals total output minus total intermediate input, or A minus B. A minus B equals gross value added income. This includes compensation of employees, other net taxes on production, and gross operating surplus.

How do the supply-use tables relate to the Australian system of national accounts

Supply-use tables were introduced in the Australian national accounts in 1998 as an integral part of the annual compilation of Gross Domestic Product (GDP). They are building blocks for ABS national accounts as they are used to ensure GDP is balanced for all three approaches (production, expenditure and income) and provide the annual benchmarks (levels) from which the quarterly estimates are compiled.

This approach to compiling GDP accounts applies to all years since 1994-95, except the last financial year 2018-19. The benchmarked GDP account is first published in the September quarter issue of the Australian National Accounts: National Income, Expenditure and Product (cat. no. 5206.0) of the National Accounts. This strategy means that the quarterly accounts will never be projected more than eight quarters from a balanced set of annual accounts. Apart from the most recent year and the June quarter national accounts (for which a balanced estimate is not available), there will be only one measure of annual GDP, and consequently no statistical discrepancies in annual terms.

Conceptually, the Australian System of National Accounts (ASNA) and the supply-use tables are fully integrated and consistent. Whereas intermediate consumption is netted out from the GDP account, supply-use tables bring inter-industry flows of commodities back into focus, thereby providing a more analytically useful articulation of production, and the structure and interrelationships of industries.

The data published in the supply-use tables are consistent with the latest release of the Australian System of National Accounts (cat. no. 5204.0).

What are the differences between the supply-use tables and the input-output tables?

Both the supply-use tables and input-output tables provide a means of undertaking detailed analysis of the process of production and the use of goods and services (i.e. products), and of the income generated in that production.

The supply-use tables form the starting point for constructing input-output tables. The input-output tables serve to provide a more detailed basis for analysing industries and products, with more comprehensive product and industry breakdowns than the supply-use tables. In addition, symmetric input-output tables are required for matrix analysis and modelling. A symmetric table refers to when the same classifications or units (e.g. the same groups of products) are used in both rows and columns.

The input-output tables are published for only a point in time and are not revised once they have been finalised. In contrast, the supply-use tables form a time series for all periods from 1994-95 up to the year preceding the latest completed financial year. The supply-use tables are subject to revision.

In addition, the input-output tables depart from the 2008 SNA and from the rest of the Australian national accounts in one main respect, namely the definition of output at basic prices. The departure relates to the treatment of charges incurred in moving goods from their point of production to the final user, where delivery charges relating to delivery by a third party operator arranged by the producer and paid for by the producer and not separately charged to the end user are treated differently in 2008 SNA.

Under the 1968 version of the System of National Accounts (1968 SNA) these charges were excluded from the basic price valuation of the good concerned while under the 2008 SNA treatment the basic price valuation of the good includes these delivery charges. The ABS considers that the change in definition was inappropriate from an analytical point of view and would result in the same product being valued differently depending whether or not the producer charged separately for the delivery of the product. The ABS therefore applies an adjustment to the input-output tables to reallocate delivery charges separably invoiced to transport, so including them in transport margins and reducing basic prices.

What classifications are used in the supply-use tables?

Supply-use tables are available at the level of 67 industries and 114 product groups based on specifically developed product and industry classifications.

The Supply-Use Product Group Classification (SUPG) is an industry-of-origin product classification. The overall principles for the preparation of such an industry-of-origin product classification include homogeneity of inputs and usage. The SUPG has 114 product groups made of 301 individual product items. The SUPG is equivalent to the Input-Output Product Group (IOPG) classification used to compile the input-output tables released in Australian National Accounts: Input-Output Tables (cat. no. 5209.0.55.001).

The Supply-Use Industry Classification (SUIC) disaggregates the Australian and New Zealand Standard Industrial Classification (ANZSIC06), 2006 (cat. no. 1292.0), in which the first two digits of the SUIC typically refer to the ANZSIC06 subdivision to which the product is primary.

The supply-use classifications and a concordance between the supply-use and input-output classifications can be found in Table 4 of this publication.

Data downloads

Table 1 supply table

Table 2 use table

Table 3 primary inputs table

Table 4 concordance and classifications

History of changes

Show all

07/02/2020 - The datacubes have been replaced to update links on the Contents pages, and to modify some product labels.

Previous catalogue number

This release previously used catalogue number 5217.0

Back to top of the page