Financing resources and investment table
| Non-financial corps | Financial corps | Government | Households | Total national | Rest of world | |||
|---|---|---|---|---|---|---|---|---|
| Financing resources | ||||||||
| Net saving (a) | -2.0 | 22.9 | -6.2 | 31.2 | 45.9 | 7.5 | ||
| plus Consumption of fixed capital | 56.3 | 3.6 | 14.2 | 44.5 | 118.7 | - | ||
| Gross saving | 54.2 | 26.6 | 8.0 | 75.8 | 164.6 | 7.5 | ||
| plus Net capital transfers | 0.6 | 0.0 | -1.9 | 1.1 | -0.2 | 0.2 | ||
| less Statistical discrepancy (b) | - | - | - | - | 15.8 | - | ||
| Total financing resources | 54.8 | 26.6 | 6.1 | 76.9 | 148.6 | 7.7 | ||
| Uses of financing (investment) | ||||||||
| Capital formation | ||||||||
| Gross fixed capital formation | 76.2 | 3.2 | 23.5 | 52.9 | 155.8 | - | ||
| plus Changes in inventories | 3.6 | 0.0 | -0.5 | -2.6 | 0.6 | - | ||
| plus Net acquisition of non-produced non-financial assets | -0.4 | - | 0.4 | - | - | - | ||
| Total capital formation | 79.5 | 3.2 | 23.5 | 50.3 | 156.4 | - | ||
| plus Financial investment | ||||||||
| Acquisition of financial assets | 1.2 | 24.6 | -7.8 | 75.5 | -26.1 | -22.7 | ||
| less Incurrence of financial liabilities | 77.9 | -17.0 | 17.6 | 18.4 | -22.7 | -26.1 | ||
| Net Financial investment (Net lending (+) / net borrowing (-)) | -76.8 | 41.6 | -25.4 | 57.2 | -3.4 | 3.4 | ||
| less Net errors and omissions | -52.1 | 18.2 | -8.0 | 30.6 | 4.4 | -4.4 | ||
| Total investment | 54.8 | 26.6 | 6.1 | 76.9 | 148.6 | 7.8 | ||
- nil or rounded to zero
(a) Net saving for the rest of world is the balance on the external income account.
(b) The statistical discrepancy is not able to be distributed among the sectors.
Financial market summary table
| Amounts outstanding, Jun-23 | Transactions, Sep-23 | Other changes, Sep-23 | Amounts outstanding, Sep-23 | ||
|---|---|---|---|---|---|
| Currency and deposits | |||||
| Currency | 105.5 | -0.8 | - | 104.7 | |
| Transferable deposits | 2,335.3 | -78.6 | 13.9 | 2,270.5 | |
| Other deposits | 1,560.2 | 48.4 | -2.3 | 1,606.3 | |
| Short term debt securities | |||||
| Bills of exchange | 6.1 | 0.1 | - | 6.3 | |
| One name paper | 531.2 | 17.8 | 4.5 | 553.5 | |
| Long term debt securities | |||||
| Bonds, etc. | 3,261.3 | 58.2 | -17.0 | 3,302.6 | |
| Derivatives | |||||
| Derivatives | 1,269.7 | -214.7 | 325.9 | 1,380.8 | |
| Loans and placements | |||||
| Short term | 431.9 | -15.4 | 1.0 | 417.5 | |
| Long term | 4,749.2 | 56.8 | 19.2 | 4,825.2 | |
| Shares and other equity | |||||
| Listed | 2,559.1 | 3.9 | -42.3 | 2,520.7 | |
| Unlisted | 5,987.1 | 40.5 | 4.8 | 6,032.4 | |
| Insurance technical reserves | |||||
| Reserves of pension funds and life | 3,289.2 | 21.8 | -18.6 | 3,292.4 | |
| General insurance payments | 159.0 | 1.4 | 0.0 | 160.4 | |
- nil or rounded to zero
Flow of funds diagrams
Net transactions during September quarter 2023
Image

Description
Financial corporations borrowed $55.7b from households. They lent $46.7b to non-financial corporations, $32.9b to general government and $9.5b to rest of world.
Household borrowed $1.8b from rest of world. They lent $6.7b to non-financial corporations and $3.9b to general government.
General government borrowed $2.0b from rest of world and lent $3.0m to non-financial corporations.
Rest of world lent $3.2b to non-financial corporations.
Amounts outstanding at end of September quarter 2023
Image
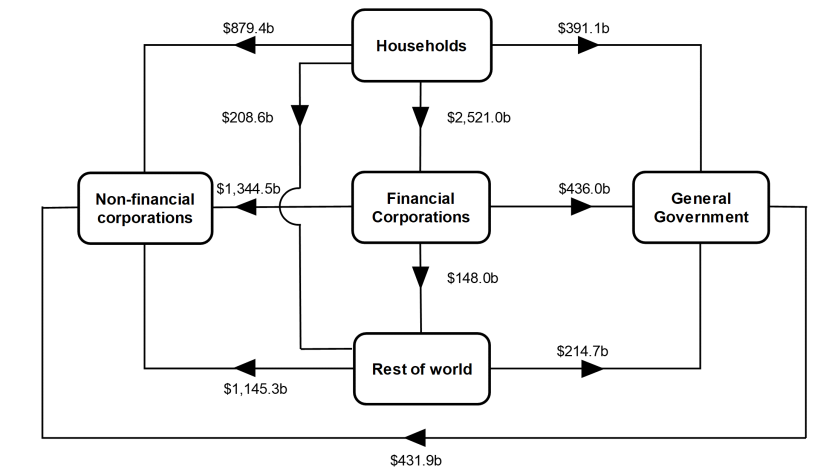
Description
Net claims on non-financial corporations were $1,344.5b from financial corporations, $879.4b from households, $1,145.3b from rest of world and $431.9b from general government.
Net claims on general government were $436.0b from financial corporations, $214.7b from rest of world and $391.1b from households.
Net claims on rest of world were $148.0b from financial corporations and $208.6b from households.
Net claims on financial corporations were $2,521.0b from households.
National investment
National investment decreased by $5.8b to $156.4b in the September quarter.
- General government investment decreased by $10.9b to $23.5b driven by decreases in gross fixed capital formation for both state and local general government and national general government.
- Non-financial corporations' investment increased by $5.5b to $79.5b, driven by an increase in private non-financial corporations' change in inventories.
- Households' investment decreased by $0.2b to $50.3b, driven by a decrease in change in inventories.
Financial investment
Australia was a net borrower of $3.4b from rest of world (ROW). The main contributors were a:
- $18.0b acquisition by ROW of equity issued by Australia.
- $14.3b acquisition by ROW of debt securities issued by Australia.
- $7.2b placement of deposits by ROW.
- Partly offset by $24.4b acquisition by Australia of debt securities issued by ROW.
- $7.9b repayment of loans borrowed by Australia from ROW.
Banks continued issuing both one-name paper and long-term debt securities this quarter to meet funding requirements with acquisition by ROW reflecting their participation in that issuance activity. Acquisition of equity issued by Australia reflected that ongoing export revenues earned by foreign-owned resource companies were being reinvested, as well as merger and acquisition activity. The acquisition by Australia of long-term debt securities issued by ROW reflected increased demand for overseas bonds by ADIs and pension funds.
Households
Households $57.2b net lending position was due to a $75.5b acquisition of financial assets, offset by $18.4b incurrence of liabilities. The acquisition of assets was driven by:
- $50.6b in deposits
- $26.4b in net equity in superannuation
While liabilities were driven by:
- $14.0b in loan borrowings
Deposit assets grew strongly this quarter with households receiving proceeds from tax returns and favoured placing excess funds in deposit accounts to take advantage of higher interest rates. Contributions into pension funds rose year on year, reflecting legislative changes to compulsory superannuation and strength in employment.
General government
General government’s $25.4b net borrowing position was due to $7.8b disposal of financial assets and $17.6b incurrence of liabilities.
Assets were driven by:
- $10.9b withdrawal of deposits
- $4.9b disposal of short-term debt securities
Liabilities were driven by:
- $9.7b issuance of bonds
- $7.9b in loan borrowings
The national general government drew down on its deposits to fund increased social benefits paid to households and the payment of tax returns. Bond issuance remains below the rate of issuance during the pandemic, reflecting the improvement in the national general government’s balance sheet. State and territory governments borrowed funds from their respective central borrowing authorities to fund investment into health and transport infrastructure.