Australian National Accounts: Finance and Wealth

This is not the latest release View the latest release

Contains quarterly data for household sector, credit market, intersectoral financial flows, financial market, sectoral analysis and capital investment

Reference period
March 2020
Released
25/06/2020

Key statistics

  • National investment declined by $22.9b this quarter to $99.7b.
  • Household net worth decreased 1.8%.
  • Demand for credit was the highest since September quarter 2018, driven by other private non-financial corporations and general government.

Main features

March key figures

Financing resources and investment, original, current prices

 Non-financial corporationsFinancial corporationsGeneral governmentHouseholdTotal NationalRest of world
$b$b$b$b$b$b
Financing resources      
 Net saving (a)-12.716.44.219.126.9-9.2
 plus Consumption of fixed capital42.93.211.031.288.2-
 Gross saving30.219.515.250.2115.1-9.2
 plus Net capital transfers0.8--2.01.0-0.20.2
 less Statistical discrepancy (b)----6.2-
 Total financing resources31.019.513.251.2108.7-9.1
Uses of financing (Investment)     
 Capital formation      
  Gross fixed capital formation46.23.017.135.6101.9-
  plus Change in inventories-2.6-0.8-0.4-2.2-
  plus Net acquisition of non-produced non-financial assets-0.1-0.1---
  Total capital formation43.53.018.035.299.7-
 plus Financial investment     
  Acquisition of financial assets54.0146.131.427.641.129.7
  less Incurrence of liabilities55.0143.843.94.929.741.1
  Net financial investment (Net lending (+) / net borrowing (-))-1.02.2-12.522.711.4-11.4
 less Net errors and omissions11.5-14.4-7.76.72.4-2.4
 Total investment31.019.513.251.2108.7-1.7

- nil or rounded to zero (including null cells)
a. Net saving for the Rest of world is the balance on the external income account.
b. The statistical discrepancy is not able to be distributed among the sectors.
 

National investment experiences largest fall on record

National investment declined by $22.9b this quarter to $99.7b. The fall this quarter was the largest on record and brings investment down to its lowest level since March 2017. In seasonally adjusted terms the decline was $1.1b.


Non-financial corporations investment fell by $11.4b to $43.5b, with private non-financial corporations driving the decline. A run down in inventories contributed to the fall with increased sales of household goods in response to COVID-19 lockdown measures.

Household investment declined by $8.2b to $35.2b, with demand for new housing remaining weak.

General government investment declined by $3.0b to $18.0b, following asset purchases from the public corporations sector last quarter.

Australia at its strongest net lending position

National net lending was $11.4b in March quarter 2020, the strongest net lending position on record, and Australia's fourth consecutive quarter as a net lender. The net lending position was driven by a record net acquisition of financial assets from the rest of the world of $41.1b, which outweighed the incurrence of $29.7b in liabilities.

Australia's net lending position was driven by a $39.6b decrease in non-resident holdings of Australian bonds, due to a major sell off of Commonwealth government bonds and a net maturity of corporate bonds. Authorised deposit taking institutions (ADIs) also made significant purchases of bonds issued by non-residents, further contributing to the strength in net lending.

Australia lent a record $40.9b to non-residents, predominantly made up of loans from ADIs to related overseas entities. This was offset by Australia borrowing record amounts through loans from non-residents ($47.2b), also driven by ADIs.


Households were net lenders, accruing $13.7b in deposits and $18.5b in net equity in reserves of pension funds (superannuation). During the March quarter, the impacts of COVID-19 on superannuation contributions were minimal. Households' loan borrowings were $2.0b for the quarter. Long term loan borrowing ($7.7b) was driven by modest growth in mortgages, while the fall in short term loans borrowing (-$5.6b) was the strongest on record, due to falls in demand for motor vehicles, travel and accommodation, which in part is a response to the pandemic and imposed lock downs.

General government was a net borrower of $12.5b, driven by bond issuance of $14.4b by national general government, and loan borrowing of $18.4b by state and local general governments. These funds were used for bushfire recovery and COVID-19 support packages.

Non-financial corporations were net borrowers of $1.0b. Private non-financial corporations loan borrowing increased by a record $47.0b, as businesses drew down on existing lines of credit . However, a large proportion of these funds were placed in deposit accounts ($46.1b), as businesses sought to ensure sufficient liquidity to cover expenses in anticipation of the impacts of COVID-19 next quarter.
Household sector summary

Household accumulation of wealth

 Amount outstanding at endTransactions duringOther changes in volume during (a)Holding gains (+)/losses (-) duringAmount outstanding at end
Dec Qtr 2019Mar Qtr 2020Mar Qtr 2020Mar Qtr 2020Mar Qtr 2020
$b$b$b$b$b
Non-financial assets    
 Land and dwellings7 174.25.38.3132.27 320.0
 Other non-financial assets671.2-1.2-3.7673.7
Financial assets5 841.727.6--361.25 508.1
Liabilities2 491.64.9-13.82 510.3
Net worth11 195.426.78.3-239.110 991.5
Memorandum item    
 Consumer durables (b)410.51.8-2.2414.5

- nil or rounded to zero (including null cells)
a. Not all other changes in volume are separately identifiable. Some have been shown as holding gains.
b. Consumer durables are not included in net worth.
 

Household net worth

Household net worth (wealth) decreased $204.0b (-1.8%) in the March quarter due to a $333.6b decrease in financial assets, driven by superannuation reserves (-$268.2b) and shares and other equity (-$57.6b), reflecting the impact of COVID-19 on the Australian and international financial markets from late February 2020. These falls were partly offset by an increase in deposits ($17.2b), reflecting households’ preference for safe and liquid assets in times of economic uncertainty and the low levels of consumption on non-essential goods and services due to COVID-19 restriction measures. The fall in financial assets was partly offset by a $145.8b increase in land and dwellings. There were no significant impacts from COVID-19 containment measures, such as government restrictions on auctions and open house inspections on growth in land and dwellings, as these measures came into effect during the last week of the quarter.

Household wealth per capita decreased $9,982 to $428,585, the largest fall since September quarter 2011. Quarterly growth in household wealth was negative for the first time since December quarter 2018, however through the year growth was 6.6%, driven by the strong rebound in residential property prices over the past year.


Household liabilities grew $18.7b (0.8%), following moderate growth in the previous quarter. Total household liabilities were $2,510b, 92% of which are long term loans. The 0.9% growth in long term loans this quarter was due to rises in owner occupier (0.9%) and unincorporated business loans (1.0%), partly offset by falls in investor housing loans (-0.3%). Short term loan borrowings by households decreased 7.2% this quarter, the largest fall in the history of the time series, reflecting weak expenditure on non-essential goods and services due to COVID-19 restriction measures and bushfire impacts as well as a continuation of a long term decline driven by tighter serviceability requirements on mortgages and interest rates not changing despite cash rate cuts.

The wealth effect

Household gross disposable income adjusted for other changes in real net wealth (wealth effect) decreased from $445.5b to $89.3b, and household net saving adjusted for other changes in real net wealth was negative this quarter, decreasing from $125.3b to -$209.2b. The falls in gross disposable income and household net saving when adjusted for other changes in net wealth are due to the significant real holding losses of $360.4b in financial assets this quarter, this is the strongest negative result in the time series.

This quarter the household saving ratio increased from 1.2 to 6.7 (original basis), driven by a large fall of 7.6% in final consumption expenditure. Gross disposable income fell by 2.0% this quarter, partly offset by a 0.8% increase in consumption of fixed capital. The decline in household consumption expenditure was due to both the bushfires and COVID-19.

Household debt to assets ratios

The household debt to assets ratio increased from 19.1 to 19.6, as the fall in household assets (-1.4%) outweighed the rise in household debt (0.8%). The ratio of mortgage debt to residential land and dwellings decreased from 28.0 to 27.6, as the value of land and dwellings (2.0%) owned by households (which had no significant impacts from COVID-19) outgrew mortgage debt (0.6%) for the third consecutive quarter.

The household debt to liquid assets ratio grew strongly this quarter, from 109.6 to 112.5. The rise was driven by large falls in ownership of shares and other equity, which were impacted by COVID-19 effects on financial markets.

Credit market summary

Non-financial domestic sectors

 Credit market outstandings at endDemand for credit duringOther changes duringCredit market outstandings at end
Dec Qtr 2019Mar Qtr 2020Mar Qtr 2020Mar Qtr 2020
$b$b$b$b
Non-financial corporations   
 Investment funds467.30.1-58.9408.6
 Other private3 727.241.0-316.03 452.2
 Public137.05.1-142.0
General government   
 National647.920.221.4689.5
 State and local183.518.20.1201.8
Households2 363.11.513.82 398.5
Total7 546.086.1-339.57 292.6

- nil or rounded to zero (including null cells)


Demand for credit

Demand for credit ($86.1b) was the highest since September quarter 2018, driven by other private non-financial corporations ($41.0b) and general government ($38.4b), while households' demand for credit ($1.5b) continued to be subdued.


Loan borrowings ($43.7b) by other private non-financial corporations (private trading corporations) were the highest on record in March quarter 2020. Net maturities of corporate bonds ($8.7b), predominantly with the rest of the world, were the highest since March quarter 2017, as companies let existing bonds mature this quarter and issued less due to low investor demand and widening spreads in yields. Equity raising ($5.9b) was the second lowest since December quarter 2012, with equity placements subdued this quarter.

Net bond issuances of $14.5b drove national general government's demand for credit ($20.2b). The RBA increased their holdings of Commonwealth government bonds by a record $42.2b, reflecting the central bank's monetary stimulus measures announced in March in response to COVID-19. State and local general government's demand for credit ($18.2b) was also the highest on record, due to increased funding requirements for bushfire recovery and COVID-19 support packages. This is consistent with strong bond issuance by central borrowing authorities this quarter.

Households' restrained demand for loans continued this quarter ($2.0b). Long term loan borrowing ($7.7b) was the second weakest since September quarter 2012, while the fall in short term loan borrowing (-$5.6b) was the strongest on record.


Credit market outstanding

Despite the strong increase in demand for credit during the quarter, significant valuation decreases caused credit market outstanding to fall 3.4% (-$253.4b), the largest decrease on record. The fall was driven entirely by valuation losses on shares and other equity of other private non-financial corporations (-$340.7b) and private non-financial investment funds (-$60.9b), reflecting significant falls on the stock market during the quarter, largely in reaction to the evolving and anticipated economic impacts of COVID-19.

Intersectoral financial flows

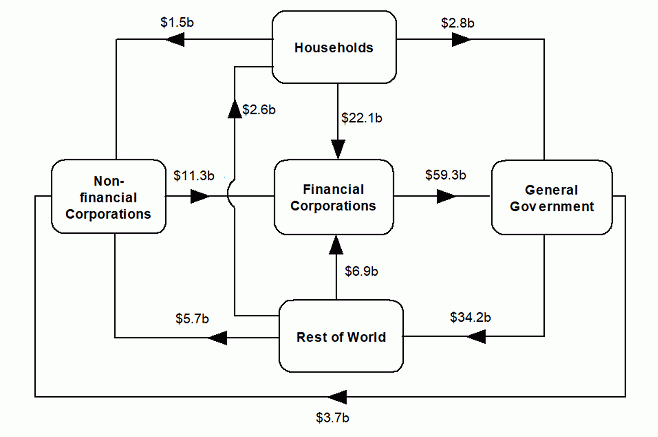
Net transactions during March quarter 2020

During March quarter 2020, the general government sector borrowed a net $59.3b from the financial sector driven by financial corporations' purchasing $45.3b of government bonds and issuing $18.7b in loans. These were partly offset by governments placing $19.3b in deposits with financial corporations.

The financial sector borrowed a net $11.3b from the non-financial sector, consisting of $45.1b in non-financial corporations deposits, partly offset by financial corporations providing $39.8b in loans.

Financial corporations borrowed a net $22.1b from households this quarter, consisting of $14.1b in household deposits and $11.0b in superannuation reserves.

Rest of world borrowed a net $34.2b from general government driven by rest of world selling a net $30.2b in government bonds.

Diagram shows Net transactions during March quarter 2020
This is a flowchart that shows the intersectoral financial flows of net transactions during the 2020 March quarter. From Households, $22.1 billion flows into Financial Corporations, $1.5 billion flows into Non-financial Corporations and $2.8 billion flows into General Government. From Financial Corporations, $59.3 billion flows into General Government. From General government, $3.7 billion flows into Non-financial corporations and $34.2 billion flows into Rest of the World. From Non-financial corporations $11.3 billion flows to Financial corporations. From the Rest of World, $5.7 billion flows into Non-financial corporations, $6.9 billion flows into Financial corporations and $2.6 billion flows into Households.

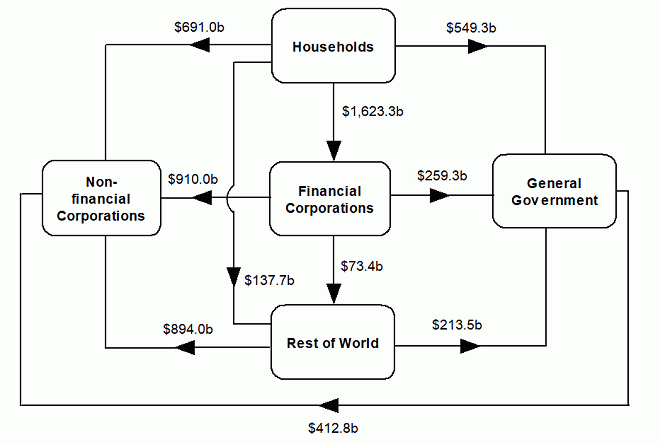
Amounts outstanding at end of March quarter 2020

Net claims on non-financial corporations were $910.0b from financial corporations, $894.0b from rest of world, $691.0b from households and $412.8b from general government.

Net claims on financial corporations from household were $1,623.3b. These were mainly comprised of superannuation reserves of $2,486.2b and deposits of $1,129.8b, partly offset by household loan liabilities of $2,232.0b.


Diagram shows Amounts outstanding at end of March quarter 2020
This is a flowchart that shows the intersectoral financial flows of amounts outstanding at the end of the 2020 March quarter. From households $1,623.3 billion flows to financial corporations, $691.0 billion flows to non-financial corporations, $549.3 billion flows to general government, and $137.7 billion to the rest of the world. From financial corporations $259.3 billion flows to general government, $910.0 billion flows to non-financial corporations and $73.4 billion flows to the rest of the world. From general government $412.8 billion flows to non-financial corporations Finally, from the rest of the world $213.5 billion flows to general government, and $894.0 billion flows to non-financial corporations.

Financial market summary

Australian financial market

 Outstanding at endTransactions duringOther changes duringOutstanding at end
Dec Qtr 2019Mar Qtr 2020Mar Qtr 2020Mar Qtr 2020
$b$b$b$b
Currency and deposits    
 Currency88.11.4-89.5
 Transferable deposits1 140.8205.97.61 353.4
 Other deposits1 478.817.630.61 527.0
Short term debt securities    
 Bills of exchange19.5-1.4-18.1
 One name paper509.8-4.520.9526.3
Long term debt securities    
 Bonds, etc.2 714.9168.396.12 979.3
Derivatives    
 Derivatives678.1-38.5612.01 251.6
Loans and placements    
 Short term410.845.35.5461.6
 Long term3 965.0118.929.24 113.2
Shares and other equity    
 Listed2 106.83.1-521.31 588.6
 Unlisted5 048.0-27.5-321.94 707.5
Insurance technical reserves    
 Reserves of pension funds and life offices2 790.211.1-311.52 489.8
 General insurance prepayments and reserves130.31.0-131.3

- nil or rounded to zero (including null cells)


Strong contraction in the share market

The shares and other equity market contracted 12.0% in the March quarter. Listed shares and other equity fell 24.6% driven by valuation decreases due to significant falls in the domestic stock market. Unlisted shares and other equity also fell (-6.7%) due to valuation decreases as a result of poor economic conditions both on and offshore.


Other notable events in financial markets that occurred during the quarter include:

  • The deposits market increasing 10.0% with positive growth in both transferable deposits (18.7%) and other deposits (3.3%).
  • The bonds market having the largest growth (9,7%) since the height of the GFC in December quarter 2008 where growth was 14.6%.
  • The derivatives market increasing 84.6% due a depreciation of the Australian dollar against major overseas currencies.

Sectoral analysis

Private non-financial corporations increase liquidity through record loan borrowing

Private non-financial corporations sourced $41.8b worth of funds through record loan borrowings of $47.0b, with businesses drawing down on existing lines of credit. This was partly offset by a $9.6b net maturity in bonds, the largest maturity in three years. Deposits of private non-financial corporations grew by a record $46.1b, as the demand for liquidity increased significantly. Funds sourced through raising of equity was $4.8b, the lowest amount since December quarter 2012.


The debt to equity ratio on an adjusted basis increased from 0.67 to 0.69, reflecting the large increase in loan borrowings this quarter. On a non-adjusted basis the ratio increased significantly from 0.50 to 0.61, reflecting the substantial revaluation losses on equity caused by the declines in the stock market, as a result of the uncertainty created by the pandemic.


Financial assets and liabilities of financial corporations

 Outstanding at endTransactions duringOther changes duringOutstanding at end
Dec Qtr 2019Mar Qtr 2020Mar Qtr 2020Mar Qtr 2020
$b$b$b$b
Assets of financial corporations   
 Central bank184.281.713.6279.6
 Authorised deposit taking institutions4 046.4194.6259.34 500.3
 Other broad money institutions194.117.52.8214.4
 Pension funds2 504.614.3-268.02 250.9
 Life insurance corporations263.0-9.6-27.9225.5
 Non-life insurance corporations240.33.0-13.8229.5
 Money market investment funds41.23.40.144.8
 Non-money market investment funds1 036.9-36.9-88.4911.6
 Central borrowing authorities411.729.7-3.1438.3
 Securitisers500.1165.40.1665.5
 Other financial corporations82.65.9-8.280.2
Liabilities of financial corporations   
 Central bank185.986.88.6281.4
 Authorised deposit taking institutions4 162.4165.2155.44 483.0
 Other broad money institutions159.78.2-2.4165.5
 Pension funds2 706.221.4-269.82 457.8
 Life insurance corporations260.1-9.2-32.0218.9
 Non-life insurance corporations255.01.6-15.0241.7
 Money market investment funds41.23.40.144.8
 Non-money market investment funds1 193.4-9.4-114.11 070.0
 Central borrowing authorities400.126.03.3429.3
 Securitisers508.8171.45.6685.9
 Other financial corporations189.61.2-11.4179.4

- nil or rounded to zero (including null cells)


Financial corporations' assets increased $185.6 to $6,641.7b this quarter. The rise was driven by increases in derivatives ($250.5b), loans and placements ($119.7b) and bonds ($74.4b), offset by a decrease in equities (-$301.3b). Liabilities rose $45.2b, driven by increases in deposits ($115.8b) and derivatives ($266.5b), offset by decreases in insurance technical reserves (-$299.4b) and equities (-$94.5b).

Authorised deposit taking institutions (ADIs) deposit funding increases

ADIs funding from deposits increased 6.9% during the quarter. The rise in deposits was due to most sectors, but was driven by other private non-financial corporations (private trading corporations) ($45.5b), pension funds ($35.5b) and households ($14.7b), in response to increased liquidity requirements due to COVID-19. Funding from loans ($37.2b) and bonds ($46.0b) also increased this quarter, while funding from equity fell due to negative movements in the stock market.


ADIs undergo record amount of internal securitisation in response to RBA's repurchase agreement program

Lending from ADIs to households fell by 9.9% this quarter as major banks sold pools of mortgages internally to their securitiser arms in exchange for debt securities that can be sold to the RBA as part of its repurchase agreement program. This led to a 36.6% increase in lending from securitisers to households.

The overall growth rate in loans to households from ADIs and securitisers remains weak, up $8.9b this quarter. With the exception of September quarter 2019, this was the smallest increase in household loan balances since September quarter 2012. The slowdown, reflects households with outstanding loans taking advantage of low interest rates by paying down their debt, along with poor economic conditions and a negative economic outlook.


Volatility in the stock market drives pension fund assets down

Total financial assets of pension funds (superannuation) fell $253.7b (-10.1%) driven by valuation decreases in shares and other equity (-$263.0b). There were valuation losses in both listed and unlisted equity due to poor performance as a result of weakened economic conditions caused by COVID-19. Pension funds sold off their equity (-$14.0b) and bond assets (-$9.7b) while increasing deposits ($38.2b) both to accommodate members switching to defensive investment options and increase liquidity. This quarters 16.4% growth in deposits is the largest since June quarter 2007. The rise in deposits of pension funds was also in preparation for member's requests for early access to superannuation funds with implementation in the next two quarters.


Pension funds are indirectly exposed to equities and debt securities through non-money market financial investment funds (NMMF). NMMF assets fell 12.1% due to poor economic conditions as well as liquidation of assets. Liquidation was required to accommodate increased redemptions by investors reflected in -$7.6b transactions of unlisted equity liabilities. A large majority of these redemptions are attributable to pension funds withdrawing equity to increase their own liquidity.

Households claims on net equity in reserves of superannuation (pension funds) was $2,385.9b at the end of the quarter.

National general government experiences largest increase in long term debt liability on record

Net issuance of national general government bonds was $14.4b, the strongest result since 2017. This follows eight quarters of weak issuance and net maturities as gross saving of national general government, in annualised terms, began to strengthen to pre-GFC levels. The value of national general government bonds increased by $21.3b as interest rates fell to historic lows, which caused Commonwealth government bond yields to fall, with the 3 year bond yield halved to 0.38% by the end of the quarter. The combination of net issuance and increased value of national general government bonds resulted in a $35.7b increase in total bond liabilities, the strongest increase in the time series.

Monetary policy measures announced in response to COVID-19, resulted in a significant increase in demand for national general government bonds by the RBA. The RBA purchased $42.2b worth of national general government bonds, a majority of which were acquired through outright purchases in the secondary market, as required under the yield target measure. The RBA also made temporary acquisitions of national general government bonds through repurchase agreements with ADIs in exchange for deposits in the form of exchange settlement accounts. This prompted significant repurchasing activity between the rest of the world and ADIs, where ROW sold $30.2b worth of national general government bonds. By the end of the quarter, ADIs' total holdings increased by $15.0b and are eligible to be sold to the RBA under repurchase agreements in upcoming quarters. The RBA's holdings as a proportion of total national general government bonds more than doubled to 12.1%, while ROW holdings decreased to 51.5%, the lowest proportion since 2004.


State and local general government increased borrowing in response to bushfire relief and COVID-19

State and local general government borrowed a record $18.4b in loans from central borrowing authorities, driving the $22.3b increase in total liabilities this quarter. Significant funding was required by state governments due to increased expenditure on bushfire disaster relief efforts and in reaction to the immediate impacts of the COVID-19 pandemic on state and local economies. Loan borrowing by state and local government is consistent with the $18.7b raised through net issuance of bonds and one name paper by central borrowing authorities, providing funds for expenditure by respective state governments as required. The RBA also purchased $12.7b worth of bonds issued by central borrowing authorities through outright purchases in the secondary market and repurchase agreements with ADIs to facilitate smooth functioning of the Australian bond market. Deposit assets of state and local general government increased $5.6b, reflecting excess funds held for expenditure on economic support packages in future quarters.


Rest of world continues to borrow from Australia

The net financial position of rest of the world at the end of March quarter 2020 was $808.1b. This is a $101.4b decrease from the previous quarter and was due to net valuation decreases of $90.0b and net transactions (net change in financial position) of -$11.4b, resulting in the strongest net lending position by Australia in recent years.

Australia's net lending position was driven by rest of the world selling off $30.2b in Commonwealth government bonds, and ADIs purchasing debt securities issued by non-residents.

There were significant valuation changes across assets and liabilities of rest of world with Australia. Liabilities of rest of world increased in value by $211.1b due to the depreciation of the Australian dollar against most major foreign currencies having significant impacts on the value of derivative contracts, loans and deposits. This was partly offset by valuation falls in equity issued by rest of world, due to deteriorating global financial market conditions. Assets of rest of the world experienced valuation increases of $121.1b, driven by derivatives and bonds issued offshore, which are also subject to changes in foreign exchange rates.

Capital investment

Australia's net lending reaches a record high

Australia's net lending position increased from $1.6b to $8.2b in the March quarter, predominantly due to a $3.4b increase in national net saving.

At the sector level, net lending by households increased by $7.5b to $9.6b. This was predominantly due to net saving, which was impacted by the first wave of social assistance benefits for COVID-19 and weather related non-life insurance claims. A contraction in household final consumption expenditure also contributed to the increase, impacted by social distancing measures.

The rise in social assistance benefits, as well as higher government final consumption expenditure in response to bushfires and the onset of COVID-19 contributed to general government net borrowing increasing by $2.9b.

Private non-financial corporations were net lenders this quarter, the first time this has occurred since September 1993. The switch to net lending was driven by an increase in net saving and supported by a rundown in inventories. Primary income payable by private non-financial corporations declined, while higher commodity prices supported an increase in gross operating surplus.


National capital investment remains at a historic low

National capital investment decreased to 22.2% as a proportion of GDP, continuing its downward trend since December quarter 2017.

Investment by non-financial corporations fell to 10.0% of GDP. This is the eighth consecutive quarterly decline in the ratio. Private sector non-mining investment led the fall this quarter.

Household investment declined slightly to 7.7% of GDP, continuing its downward trajectory from its most recent peak in June 2016. Dwelling investment is driving this weakness, reflected in dwelling approvals remaining at low levels over the past 2 years.

Impacts of COVID-19 on finance and wealth estimates

The March quarter 2020 saw a series of extraordinary events buffet the Australian economy, starting with bushfires and other natural disasters, followed by the outbreak of COVID-19 and the subsequent imposition of restrictions. These events had an impact on many, perhaps most, of the macroeconomic statistics produced by the ABS, as discussed in detail in The Australian Statistician’s analytical series (cat. no. 1016.0).

This spotlight examines these impacts on the March quarter for household wealth and superannuation. The impact of RBA and government policy interventions on financial markets in response to these developments, is also described.

Australian and international financial markets experienced significant disruption from late February 2020 as a result of uncertainty surrounding the effects of COVID-19. Global equities markets declined during the quarter including the Australian Stock Exchange (-24.9%) and corporate debt markets became impaired.

RBA monetary policy brought the cash rate and 3-year commonwealth bond yields down, which resulted in the Commonwealth government bond markets stabilising. Significant amounts of government bonds were issued during the quarter, and large amount of debt securities including significant amounts of government bonds were purchased by the RBA to ensure the financial markets remain liquid. These events impacted all sectors of the economy.

The RBA and Government policies were announced and implemented in mid to late March. While there were initial impacts from these policies in March, the most significant impacts will come through in June quarter.

Households

During the March quarter 2020, household net worth declined $204.0b (1.8%). Average household net worth decreased $9,982 per person, the largest decrease since the September quarter 2011.


The impacts from COVID-19 on the Australian and international financial markets from late February 2020 caused much of this decline in household net worth, with declines in superannuation and equity holdings of private trading corporations and banks (Figure 1). These declines were partly offset by an increase in the value of land and dwellings (residential assets) and a fall in liabilities from short term loans. The fall in short term loans was a result of a decline in expenditure on travel, accommodation, restaurants, and recreational and cultural services due to COVID-19 restriction measures and bush fires.

Restrictions on auctions and open house inspections, which were implemented in the last week of the quarter, had no significant negative impact on the value of residential assets in the quarter. By contrast, at the end of the first quarter of the global financial crisis (GFC), household net worth declined 2.6%, from December 2007 to March 2008, due to negative impacts on both residential and financial markets.

At the end of March 2020, household net worth was $11.0 trillion, comprising $7.3 trillion of land and dwellings, superannuation assets, and other financial assets, offset by housing loans (Figure 2).


Superannuation

At the end of March 2020, total assets of superannuation (pension funds) fell 9.2%, the largest quarterly fall since the time series began in June 1988. The decline was slightly larger than the 9.0% decline at the height of the GFC in December 2008.

The largest assets invested in by superannuation are equities (67.8%) (either directly held or through units in investment funds), deposits (11.5%) and debt securities (7.2%).


The primary contributors to the 9.2% decline in superannuation assets were falls in equity units held in investment funds, directly held domestic equity, and foreign equity holdings. Debt securities also fell, driven mainly by redemptions of government bonds. These declines were partially offset by an increase in deposits (Figure 3).

While superannuation funds sold off some equity holdings, valuation losses drove most of the decline in value (Figure 4).


In response to COVID-19, superannuation funds partly shifted from debt and equity securities into deposits. There were a number of reasons for this. Funds received the redemptions of equity units from non-financial and non-money market investment funds, and there were more member requests to switch from high to low risk investment options. Further, funds paid variation margins on derivatives used to hedge foreign currency assets, and prepared for members to request early access to their superannuation entitlements, which was part of the Government’s stimulus package and took effect from April 2020.

Reserve Bank of Australia (RBA)

In early March, in response to the deteriorating economic outlook and financial market volatility arising from COVID-19, the RBA announced several policies to keep funding costs low and credit available to households and businesses. These included:

  • A 25 basis point target for both the cash rate and the three-year Australian Government bond yield.
  • A substantial increase in the amount and maturity of its daily market operations, in response to the increased demand for liquidity.
  • Remuneration of exchange settlement balances (deposits) at the Reserve Bank to 10 basis points to mitigate the cost to Authorised deposit taking institutions (ADIs) associated with the large increase in settlement balances at the RBA.
  • A three year Term Funding Facility (TFF) at a fixed rate of 0.25 percent for ADIs to provide credit in particular to small and medium-sized businesses.


These interventions resulted in increased holdings of bond assets issued by government, ADIs and securitisers, and a large increase in ADI deposit liabilities (Figure 5).

​​​​​​​Government policy response

During the March quarter, national and state governments issued net $38.1b in debt securities, an increase of $31.4b from the net issuance in December quarter 2019 (Figure 6). The increase in debt was used to fund government expenditure in the March quarter on the bushfire response in Victoria and New South Wales, and the government measures in response to COVID-19.


Government policies implemented in April 2020 have had no impact on the March quarter outcome. The implications of these policies will be seen in the June quarter. These policies included the early release of superannuation entitlements, loan repayment deferrals for businesses and households, actions by the Australian Office of Financial Management to support non-ADI financial sector (small lenders and securitisers), and a $40b loan guarantee scheme for small and medium businesses.

Authorised deposit taking institutions and Securitisers

ADIs which predominantly include banks, are the key intermediaries that provide loans and deposits to households and businesses. Securitisers mainly provide household housing loans.

While the majority of the implications of the RBA and government policies implemented in late March will be captured in the June quarter, there was some early impacts on the loan and deposit estimates for private non-financial corporations and households (Figure 7 and 8).

Private non-financial corporations, primarily large corporations, utilised their existing credit lines with ADIs to draw down on new loan commitments from earlier months. They also increased their credit limits from revolving credit facilities (and drew down on these).

Large corporations placed the extra credit drawn during the quarter into deposit accounts with ADIs to prepare to fund operational expenses and possible capital investment in deteriorating domestic and international financial markets.


The significant slowdown in household loans during the quarter was driven largely by ADI credit card loans, reflecting the weak expenditure on non-essential goods and services associated with COVID 19 restriction measures and bush fire impacts.

Housing loans grew modestly, with drawdowns of new loan commitments for owner-occupier loans offset by existing borrowers paying down their loans ahead of schedule payments. This reflects households taking advantage of the very low interest rate environment.

Household deposits with ADIs increased by 1.3% in the quarter, reflecting households’ preference for safe and liquid assets in times of economic uncertainty and the low levels of consumption of non-essential goods and services due to COVID-19 restriction measures. Unincorporated businesses placed the extra credit drawn during the quarter into deposits accounts with ADIs in preparation for funding operational expenses in deteriorating domestic financial markets.

Changes to this issue

Table 53. Nominal Value of Short Term Loans and Placements Market ($ million) and Table 54. Nominal Value of Long Term Loans and Placements Market ($ million) have been reinstated following some quality assurance work.

Revisions in this issue

There have been revisions to previously published aggregates due to:

  • Quality assurance reviews affecting the published aggregates after March quarter 2018, in addition to amendments to data collected in the ABS Survey of Financial Information, ABS Survey of International Investment and to data derived from Australian Prudential Regulation Authority (APRA) administrative data sets.
  • Revisions to the sectoral capital accounts are due to more up-to-date data being incorporated and concurrent seasonal adjustment.
     

Inquiries

For further information about these and related statistics, contact the National Information and Referral Service on 1300 135 070 or National accounts by email national.accounts@abs.gov.au.
 

Privacy policy

The ABS Privacy Policy outlines how the ABS will handle any personal information that you provide to us.

Data downloads

Table 1. Credit market outstandings ($ million)

Table 2. Demand for credit ($ million)

Table 3. National capital account, current prices ($ million)

Table 4. National financial assets and liabilities ($ million)

Table 5. Non-financial corporations capital account, current prices ($ million)

Table 6. Financial assets and liabilities of non-financial corporations ($ million)

Table 7. Private non-financial corporations capital account, current prices ($ million)

Table 8. Financial assets and liabilities of private non-financial corporations ($ million)

Table 9. Financial assets and liabilities of private non-financial investment funds ($ million)

Table 10. Financial assets and liabilities of other private non-financial corporations ($ million)

Table 11. Public non-financial corporations capital account, current prices ($ million)

Table 12. Financial assets and liabilities of public non-financial corporations ($ million)

Table 13. Financial corporations capital account, current prices ($ million)

Table 14. Financial assets and liabilities of financial corporations ($ million)

Table 15. Financial assets and liabilities of the central bank ($ million)

Table 16. Financial assets and liabilities of authorised deposit taking institutions ($ million)

Table 17. Financial assets and liabilities of other broad money institutions ($ million)

Table 18. Financial assets and liabilities of pension funds ($ million)

Table 19. Financial assets and liabilities of pension funds - self-managed superannuation funds ($ million)

Table 20. Financial assets and liabilities of life insurance corporations ($ million)

Table 21. Financial assets and liabilities of non-life insurance corporations ($ million)

Table 22. Financial assets and liabilities of money market financial investment funds ($ million)

Table 23. Financial assets and liabilities of non-money market financial investment funds ($ million)

Table 24. Financial assets and liabilities of central borrowing authorities ($ million)

Table 25. Financial assets and liabilities of securitisers ($ million)

Table 26. Financial assets and liabilities of other financial corporations ($ million)

Table 27. General government capital account, current prices ($ million)

Table 28. Financial assets and liabilities of general government ($ million)

Table 29. National general government capital account, current prices ($ million)

Table 30. Financial assets and liabilities of national general government ($ million)

Table 31. State and local general government capital account, current prices ($ million)

Table 32. Financial assets and liabilities of state and local general government ($ million)

Table 33. Household capital account, current prices ($ million)

Table 34. Financial assets and liabilities of households ($ million)

Table 35. Household balance sheet, current prices ($ billion)

Table 36. Analytical measures of household income, consumption, saving and wealth, current prices ($ billion)

Table 37. Rest of world capital account, current prices ($ million)

Table 38. Financial assets and liabilities of rest of world ($ million)

Table 39. The currency market ($ million)

Table 40. The transferable deposits market ($ million)

Table 41. The other deposits market ($ million)

Table 42. The bills of exchange market ($ million)

Table 43. The one name paper market ($ million)

Table 44. The bonds market ($ million)

Table 45. The derivatives and employee stock options market ($ million)

Table 46. The short term loans and placements market ($ million)

Table 47. The long term loans and placements market ($ million)

Table 48. The listed shares and other equity market ($ million)

Table 49. The unlisted shares and other equity market ($ million)

Table 50. Accounts payable/receivable ($ million)

Table 51. Financial accounts summary of bank deposits and lending split by household subsectors ($ million)

Table 52. Financial accounts summary of loan outstandings to households for housing by type of lending institution ($ million)

Table 53. Nominal value of short term loans and placements market ($ million)

Table 54. Nominal value of long term loans and placements market ($ million)

All time series spreadsheets

Previous catalogue number

This release previously used catalogue number 5232.0

Back to top of the page