Australian National Accounts: Finance and Wealth

This is not the latest release View the latest release

National, public and private corporations, government and household financial and capital accounts, and household balance sheets.

Reference period
June 2022
Released
29/09/2022

Key statistics

  • Household wealth fell $484.0b (3.3%) to $14,383b
  • Demand for credit was $134.9b, a fall of $88.1b from the record high last quarter
  • Australia's net lending position rose $11.3b to $18.7b
  • Capital investment as a proportion of GDP fell to 22.2%

Main features

Financing resources and investment table

Financing resources and investment June quarter 2022, original, current prices, $b
  Non-financial corps Financial corps Government Households Total national Rest of world
Financing resources      
 Net saving (a) 36.13.15.112.556.8-23.2
 plus Consumption of fixed capital 45.73.211.633.393.8-
 Gross saving 81.86.316.745.8150.6-23.2
 plus Net capital transfers 0.90.0-2.51.4-0.30.3
 less Statistical discrepancy (b) -----17.2-
 Total financing resources 82.76.314.247.2167.6-22.9
Uses of financing (investment) 
 Capital formation 
  Gross fixed capital formation 63.13.330.449.2146-
  plus Changes in inventories -1.20.01.5-1.5-1.3-
  plus Net acquisition of non-produced non-financial assets -0.4-0.3---
  Total capital formation 61.53.332.247.7144.6-
 plus Financial investment 
  Aquistition of financial assets 49.682.528.555.5-46.8-65.5
  less Incurrence of financial liabilities 31.860.250.055.4-65.5-46.8
  Net Financial investment (Net lending (+) / net borrowing (-)) 17.722.3-21.50.118.7-18.7
 less Net errors and omissions-3.519.2-3.40.6-4.34.3
 Total investment82.76.314.247.2167.6-23.0

- nil or rounded to zero
(a) Net saving for the rest of world is the balance on the external income account.
(b) The statistical discrepancy is not able to be distributed among the sectors.

Financial market summary table

Financial market summary, $b
 Amounts outstanding,
Mar-22
Transactions,
Jun-22
Other changes,
Jun-22
Amounts outstanding,
Jun-22
Currency and deposits 
  Currency 106.30.3-106.6
  Transferable deposits 2,227.4-1.712.02,237.7
  Other deposits 1,403.469.612.11,485.1
Short term debt securities 
  Bills of exchange 8.0-0.5-7.5
  One name paper 507.620.28.7536.5
Long term debt securities 
  Bonds, etc. 3,215.9112.6-97.53,231.0
Derivatives 
  Derivatives 915.2-244.7590.21,260.6
Loans and placements 
  Short term 406.636.96.8450.3
  Long term 4,342.0101.38.54,451.9
Shares and other equity 
  Listed 2,710.1-4.3-358.52,347.3
  Unlisted 5,633.65.9-94.25,545.3
Insurance technical reserves 
  Reserves of pension funds and life 3,213.439.2-246.43,006.3
  General insurance payments 150.2-0.40.0149.8

- nil or rounded to zero 

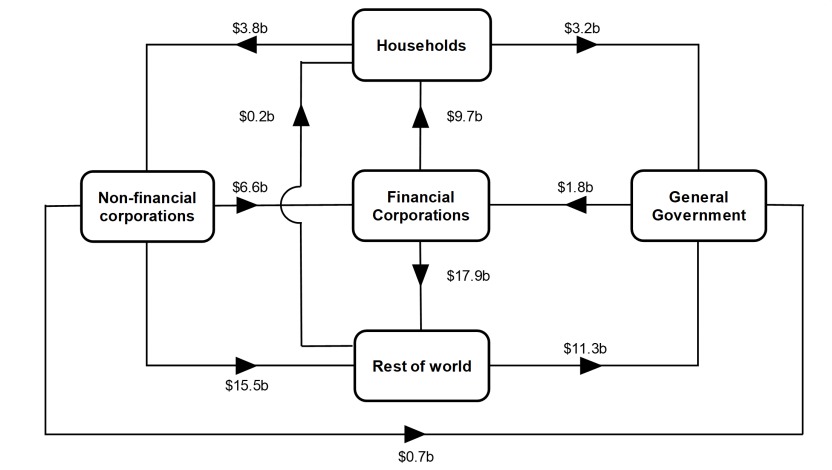
Flow of funds diagrams

Net transactions during June quarter 2022

This is a flowchart that shows the intersectoral financial flows of net transactions during the June quarter 2022.
Financial corporations borrowed $6.6b from non-financial corporations and $1.8b from general government. They lent $9.7b to households and $17.9b to rest of world. Rest of the world borrowed $15.5b from non-financial corporations. They lent $11.3b to general government and $0.2b to household. General government borrowed $3.2b from households and $0.7b from non-financial corporations. Households lent $3.8b to non-financial corporations.

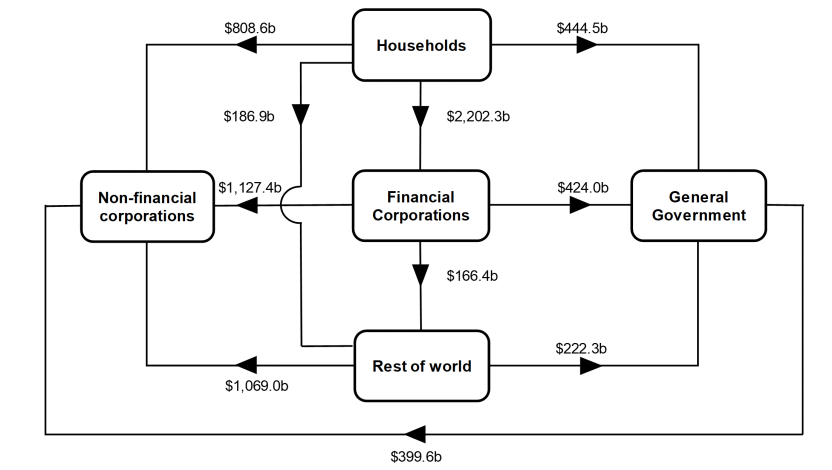
Amounts outstanding at end of June quarter 2022

This is a flowchart that shows the intersectoral financial flows of amounts outstanding at the end of the June quarter 2022.
Net claims on non-financial corporations were $1,127.4b from financial corporations, $808.6b from households, $1,069.0b from rest of world and $399.6b from general government. Net claims on general government were $424.0b from financial corporations, $222.3b from rest of world and $444.5b from households. Net claims on rest of world were $166.4b from financial corporations and $186.9b from households. Net claims on financial corporations were $2,202.3b from households.

National investment

National investment increased $19.4b to $144.6b in the June quarter. 

  • General government investment increased by $10.3b to $32.2b driven largely by an increase in gross fixed capital formation in both state and local general government and national general government.
  • Non-financial corporations' investment increased by $5.4b to $61.5b, driven largely by an increase in gross fixed capital formation in private non-financial corporations and public non-financial corporations. This was partially offset by a decrease in inventories in private non-financial corporations. 
  • Household investment increased by $3.3b to $47.7b, driven by an increase in gross fixed capital formation. This was partially offset by a decrease in inventories.

Financial investment

Australia was a net lender of $18.7b to rest of world (ROW). The main contributors were a: 

  • $26.4b withdrawal by ROW of deposits accepted by the central bank and authorised deposit taking institutions (ADIs)
  • $22.5b in loans and placements lent to ROW
  • partly offset by $40.8b ROW holdings of debt securities, driven mainly by bonds issued by national general government (NGG), ADIs, and securitisers

Funding requirements between resident ADIs and their ROW subsidiaries drove ROW loan borrowing from ADIs. ROW remains a significant holder of bond issued by both NGG and ADIs.

Households

Households' $0.1b net lending position was due to a $55.5b acquisition of financial assets, offset by a $55.4b incurrence of liabilities.
The acquisition of assets was driven by: 

  • $38.0b in net equity in pension funds
  • $5.3b in deposits  

While liabilities were driven by:

  • $53.2b in loan borrowings

Deposit assets grew modestly as spending increased following the lifting of COVID-19 restrictions. Increased contributions into pension funds reflected continued growth in employment and additional personal contributions made by households prior to the end of financial year. Demand for home loan borrowing remained elevated this quarter reflecting continued momentum in housing markets from both owner-occupiers and investors. 

Non-financial corporations

Non-financial corporations' $17.7b net lending position was due to a $51.5b acquisition of financial assets, offset by $33.8b incurrence of liabilities. The acquisition of assets was driven by: 

  • $45.9b in deposits
  • $9.5b in equities

While liabilities were driven by: 

  • $18.0b in loan borrowing 
  • $13.6b in equities

The increase in non-financial corporations’ deposits reflect strong operating surpluses supported by favourable terms of trade. Loan borrowing by private non-financial corporations was driven by machinery and equipment investment with the agricultural and vehicle rental and hiring industries expanding their productive capacity.

General government

General government's $21.5b net borrowing position was due to a $50.0b incurrence of liabilities partly offset by a $28.5b acquisition of assets. Liabilities were driven by:

  • $28.1b net issuance of bonds
  • $18.7b in loans

The Commonwealth government continued to issue bonds over the quarter to finance government expenditure in national defence and transfers to state governments for natural disaster relief payments. Net issuance of bonds remained elevated during the quarter due to fewer bond maturities over the quarter. Funds raised by central borrowing authorities were passed on to their respective state and territory governments for capital expenditure on transport and health infrastructure.

Demand for credit

Demand for credit table

Demand for credit non-financial domestic sectors, $b
 Credit market outstandings,
Mar-22
Demand for credit,
Jun-22
Other changes,
Jun-22
Credit market outstandings,
Jun-22
Non-financial corporations 
 Investment funds 550.611.6-36.5525.7
 Other private 4,261.125.4-140.64,145.8
 Public 153.8-0.1-0.1153.6
General government 
 National 877.326.0-43.4859.9
 State and local 310.518.8-13.3316.1
Households2,632.253.14.72,690.0
Total8,785.5134.9-229.28,691.2

- nil or rounded to zero


Demand for credit was $134.9b in the June quarter, of which:

  • households borrowed $53.1b
  • general government borrowed $44.9b
  • other private non-financial corporations borrowed $25.4b

Credit market outstanding fell $94.3b (1.1%) of which $229.2b was revaluation losses. The domestic share market suffered heavy losses on fears of surging inflation and further interest rate hikes from the central bank which resulted in holding losses on the equity of other private non-financial corporations of $151.7b. Bond yields continued to climb this quarter which drove holding losses on Commonwealth government bonds of $43.4b. 

Households

Household demand for credit of $53.1b was the second highest on record, driven by demand for new housing loans as auction volumes remained elevated maintaining momentum in the housing market. Both owner-occupiers and investors contributed to housing credit growth. This was supported by borrowing from unincorporated businesses that took advantage of existing government tax incentives for investment prior to the end of the financial year. This was reflected in:

  • $53.5b of long term loan borrowings
  • partly offset by $236m repayment of short term loans

General government

National general government's demand for credit of $26.0b was driven by issuance of bonds to finance investment in defence and transfers to state governments for natural disaster relief payments. State and local general government's demand for credit was $18.8b as funds raised through semi-government bonds were passed on by their respective central borrowing authorities through loans. Investment in road and rail infrastructure and construction of health and education building projects drove their appetite for credit. Funds of government were raised through:

  • $27.5b bond issuance by national general government 
  • $18.3b in loan borrowings by state and local general governments

Private non-financial corporations

Business credit continued to pick up with loan borrowing the highest since March quarter 2020. The agriculture industry borrowed to invest in machinery and equipment in anticipation of a bumper harvest season while car rental businesses restocked their fleets in response to increased interstate travel. Business equity expanded as foreign owned resource companies reinvested their retained profits following a record trade surplus. Businesses financed their activity through:

  • loan borrowings of $18.0b
  • equity raising of $6.3b

Households

Balance sheet

Household balance sheet, $b
 Amounts outstanding,
Mar-22
Transactions,
Jun-22
Other changes (a),
Jun-22
Holding gains/losses,
Jun-22
Amounts outstanding,
Jun-22
Non-financial assets 
 Land and dwellings 10,151.712.67.3-169.410,002.2
 Other non-financial assets 727.21.7-3.9732.8
Financial assets 
 Superannuation reserves 3,630.342.0--294.33,378.0
 Shares and other equity 1,245.31.9--21.21,226.0
 Currency and deposits 1,497.85.3-2.01,505.1
 Other financial assets 383.76.4--22.0368.1
Liabilities 
 Loans 2,627.253.2-4.72,685.1
 Other liabilities 141.72.2--144.0
Wealth (Net worth)14,867.114.47.3-505.714,383.0
Memorandum item 
 Consumer durables (b) 478.94.7--486.8

- nil or rounded to zero
(a) Not all other changes in volume are separately identifiable. Some have been shown as holding gains.
(b) Consumer durables are not included in net worth.

Financial assets

Household selected financial assets, $b
 Transactions,
Dec-21
Amounts outstanding,
Dec-21
Transactions,
Mar-22
Amounts outstanding,
Mar-22
Transactions,
Jun-22
Amounts outstanding,
June-22
Total assets 85.66,755.856.86,757.255.56,477.2
Deposits46.11,413.835.21,448.15.31,455.5
Shares and equity3.11,224.2-1.91,245.31.91,226.0
Net equity in reserves24.93,265.726.13,220.039.33,011.3
 Pension funds25.23,111.025.23,066.038.02,878.1
Other assets11.5852.0-2.6843.78.9784.3

Liabilities

Household selected liabilities, $b
 Transactions,
Dec-21
Amounts outstanding,
Dec-21
Transactions,
Mar-22
Amounts outstanding,
Mar-22
Transactions,
Jun-22
Amounts outstanding,
Jun-22
Total liabilities 56.92,725.643.42,769.255.42,829.3
Short term loans 1.559.5-0.958.5-0.258.3
Long term loans 52.72,525.143.52,568.753.52,626.8
Other liabilities 2.7141.00.9142.02.2144.2

Household wealth fell 3.3% ($484.0b) to $14,383.0b at the end of the June quarter. This was the first decline in household wealth since the beginning of the pandemic in March 2020 and was driven by weakness in the housing market and revaluation losses in superannuation assets. 

Wealth per capita fell 3.5% (-$20,151) to $553,954 per person.

Non-financial assets

Non-financial assets owned by households decreased 1.3% (-$143.9b), driven by a:

  • $149.5b fall in land and dwellings

Holding losses on residential land and dwellings reflected falls in property prices over the quarter, particularly in Victoria and New South Wales.

Financial assets

Financial assets of households fell 4.1% (-$280.0b), driven by a:

  • $252.3b fall in superannuation reserves
  • $19.3b fall in shares and other equity, offset by a
  • $7.3b rise in currency and deposits

Poor performance across domestic and overseas share markets this quarter drove the falls in superannuation and equity assets. Superannuation losses were partially offset by strong contributions ($38.0b) reflecting improved labour market conditions and a rise in voluntary contributions towards the end of the financial year. 

Total household deposits increased at a subdued rate of 0.5%. Other deposit balances rose as households took advantage of higher interest rates on term deposit accounts, while transferable deposit balances fell, reflecting increased spending opportunities and cost of living pressures. 

Liabilities

Household liabilities increased 2.2% ($60.2b), driven by a: 

  • $39.7b rise in housing loans, offset by a
  • $0.2b fall in short term loans

The growth in housing loans reflects continued activity in the property market over the quarter, despite increases in interest rates and falling house prices in some states. The rise continues to be driven by both owner-occupier and investor loans, which increased by $27.7b and $12.0b respectively. 

Private non-financial corporations

Financial assets

Private non-financial corporations' selected financial assets, $b
 Transactions,
Dec-21
Amounts outstanding,
Dec-21
Transactions,
Mar-22
Amounts outstanding,
Mar-22
Transactions,
Jun-22
Amounts outstanding,
Jun-22
Total assets36.11,841.8140.51,902.649.01,959.7
Deposits14.4758.412.8768.144.8820.4
Shares and equity24.8653.0126.1689.89.5685.1
Other accounts receivable-4.2219.3-2.4226.7-1.3226.2
Other assets1.1211.14.0217.9-3.9227.9

Liabilities

Private non-financial corporations' selected liabilities, $b
 Transactions,
Dec-21
Amounts outstanding,
Dec-21
Transactions,
Mar-22
Amounts outstanding,
Mar-22
Transactions,
Jun-22
Amounts outstanding,
Jun-22
Total liabilities41.84,861.2171.45,033.531.74,898.3
Total debt securities0.5287.46.2275.93.8279.8
Loans3.5941.417.7958.920.3989.8
 Authorised deposit taking institutions20.0616.327.4641.821.2667.3
 Rest of world-14.8233.10.9235.8-4.6237.5
Shares and equity40.73,378.3143.73,534.513.63,360.6
 Households6.1800.83.1813.63.8808.3
 Rest of world26.11,251.3118.21,364.7-6.41,305.9
Other liabilities-3.0254.13.8264.2-6.0268.1

Private non-financial corporations demand for credit of $31.7b, was driven by:

  • $20.3b borrowing of loans,
  • $13.6b issuance of equity, and
  • $3.8b issuance of debt securities.

Private non-financial corporations favoured increasing debt over the raising of equity to source funds. This resulted in:

  • the debt-to-equity ratio (adjusted for price changes) remained unchanged at 0.62.

Growth in loan borrowings outweighed equity this quarter as firms borrowed to increase investment in machinery & equipment. Equity raising on the listed share market was low this quarter, though there was continued strength in retained earnings reflecting businesses' strong gross operating surplus. 

Financial corporations

Financial assets and liabilities

Financial corporations' financial assets, $b
 Amounts outstanding,
Mar-22
Transactions,
Jun-22
Other changes,
Jun-22
Amounts outstanding,
Jun-22
Central bank671.23.5-10.5664.2
Authorised deposit taking institutions4,731.362.9257.75,051.9
Other broad money institutions185.69.9-2.3193.2
Pension funds2,893.430.4-203.22,720.6
Life insurance corporations191.01.3-17.0175.3
Non-life insurance corporations271.25.5-12.9263.8
Money market investment funds35.4-5.00.130.4
Non-money market investment funds1,174.4-20.1-84.01,070.3
Central borrowing authorities526.127.8-15.7538.2
Securitisers800.49.30.3810.1
Other financial corporations113.8-27.429.5116.0

- nil or rounded to zero

Financial corporations' liabilities, $b
 Amounts outstanding,
Mar-22
Transactions,
Jun-22
Other changes,
Jun-22
Amounts outstanding,
Jun-22
Central bank672.6-1.0-6.2665.4
Authorised deposit taking institutions4,897.65.1198.55,101.2
Other broad money institutions154.75.4-4.7155.4
Pension funds3,115.531.3-204.52,942.3
Life insurance corporations188.11.6-22.1167.7
Non-life insurance corporations278.3-2.02.2278.6
Money market investment funds35.4-4.90.030.4
Non-money market investment funds1,298.16.6-84.51,220.1
Central borrowing authorities508.329.9-18.1520.1
Securitisers814.328.8-7.1836.0
Other financial corporations218.1-24.931.8225.0

Authorised deposit-taking institutions (ADIs)

Financial assets

Authorised deposit taking institutions' selected financial assets, $b
 Transactions,
Dec-21
Amounts outstanding,
Dec-21
Transactions,
Mar-22
Amounts outstanding,
Mar-22
Transactions,
Jun-22
Amounts outstanding,
Jun-22
Total assets 68.24,577.224.44,731.362.95,051.9
Deposits 34.3502.415.5517.2-15.5502.7
Bonds 11.9713.587.1775.760.6817.3
 Securitisers 16.9360.985.0441.015.6454.2
 National general government -14.188.4-10.073.37.878.0
Loans 86.92,733.4-6.22,720.2102.32,834.6
Other assets -64.9627.8-72.1718.2-84.5897.3

Liabilities

Authorised deposit taking institutions' selected liabilities, $b
 Transactions,
Dec-21
Amounts outstanding,
Dec-21
Transactions,
Mar-22
Amounts outstanding,
Mar-22
Transactions,
Jun-22
Amounts outstanding,
Jun-22
Total liabilities56.34,732.814.64,897.65.15,101.2
Deposits72.92,864.656.02,912.463.52,991.9
 Other private non-fin corps9.8699.510.6707.843.0756.7
 Pension funds-3.8238.11.1238.923.5263.1
 Households45.71,393.434.71,427.74.81,433.5
Bonds7.8443.326.8441.819.5462.2
Shares and equities-5.1608.5-5.9630.7-1.5537.1
Other liabilities-19.3816.4-62.4912.8-76.41,109.9

ADIs acquired $60.6b of bonds and $15.0b of short-term debt securities during June quarter 2022 in order to build their holdings of high quality liquid assets in response to the wind-down of the Committed Liquidity Facility over 2022. ADI deposit assets with the Reserve Bank of Australia (RBA) decreased $19.1b this quarter and this is the first fall since September quarter 2020, reflecting the cessation of the RBA’s bond purchase program on 10 February. This resulted in a: 

  • $19.1b reduction in deposits with the central bank 
  • $4.7b acquisition of bonds issued by the national general government
  • $22.4b acquisition of bonds issued by central borrowing authorities 
  • $4.8b acquisition of one name paper issued by central borrowing authorities 
  • $7.7b acquisition of one name paper issued by national general government 

ADIs loan assets increased significantly, with a:

  • $38.7b increase in loans to households 
  • $35.0b increase in loans to rest of world 
  • $23.6b increase in loans to other private non-financial corporations 

Liabilities of ADIs grew $203.6b, driven by a:

  • $79.5b increase in deposits
  • $152.6b increase in derivatives as a result of global market volatility, offset by
  • $93.5b decrease in equity as a result of falls in the value of equity of listed ADIs

 ADIs' funding from deposits (transactions) grew $63.5b, with a: 

  • $43.0b increase from other private non-financial corporations 
  • $23.5b increase from pension funds 
  • $4.8b increase from households 

Pension (superannuation) funds

Financial assets

Pension (superannuation) funds' selected financial assets, $b
 Transactions,
Dec-21
Amounts outstanding,
Dec-21
Transactions,
Mar-22
Amounts outstanding,
Mar-22
Transactions,
Jun-22
Amounts outstanding,
Jun-22
Total assets17.72,943.223.02,893.430.42,720.6
Deposits-4.5248.32.1249.723.5274.6
Bonds-3.4110.26.6107.48.3107.9
Shares and equity28.72,453.69.22,383.9-1.22,195.5
 Other private non-fin corps10.3417.712.2438.16.1395.6
 Non-money market investment funds-10.5990.2-9.8947.5-5.0871.0
 Rest of world22.4546.46.7502.2-7.3471.5
Net equity in life offices-1.616.0-0.415.51.714.9
Other assets-1.6115.15.5136.8-1.9127.8

Liabilities

Pension (superannuation) funds' selected liabilities, $b
 Transactions,
Dec-21
Amounts outstanding,
Dec-21
Transactions,
Mar-22
Amounts outstanding,
Mar-22
Transactions,
Jun-22
Amounts outstanding,
Jun-22
Total liabilities20.93,162.022.73,115.531.32,942.3
Net equity in reserves25.33,115.725.43,070.638.22,882.2
 Households25.23,111.025.23,066.038.02,878.1
Other liabilities-4.446.2-2.644.8-7.060.1

Total financial assets of pension (superannuation) funds decreased 6.0% (-$173.7b), with a:

  • $188.4b decrease in shares and other equity
  • $24.9b increase in deposits
  • $500m increase in bonds

Economic conditions in the overseas and domestic markets drove valuation losses of $187.2b due to rising inflation and anticipation of further rate increases from central banks. Pension funds sold off $1.2b in shares and other equity particularly from overseas, non-money market funds, authorised deposit taking institutions and money market funds. The divestment from overseas shares (-$7.3b) was the first since the June quarter 2020. Deposit levels increased as pension funds sought protection from volatility in share markets. Pension funds also acquired $8.3b in bonds while increased bond yields drove valuation losses of $7.8b in these assets. 

Government

National general government financial assets

National general government selected financial assets, $b
 Transactions,
Dec-21
Amounts outstanding,
Dec-21
Transactions,
Mar-22
Amounts outstanding,
Mar-22
Transactions,
Jun-22
Amounts outstanding,
Jun-22
Total assets2.6678.312.1662.923.2681.7
Deposits7.398.53.5101.632.8135.2
 Central bank6.969.8-1.968.034.0102.0
 Authorised deposit taking institutions0.421.94.126.0-1.125.1
One name paper1.146.4-2.443.0-7.335.9
Shares and equity-0.7201.92.1175.04.6178.2
Other assets-5.1331.58.9343.3-7.0332.5

National general government liabilities

National general government selected liabilities, $b
 Transactions,
Dec-21
Amounts outstanding,
Dec-21
Transactions,
Mar-22
Amounts outstanding,
Mar-22
Transactions,
Jun-22
Amounts outstanding,
Jun-22
Total liabilities18.21,412.016.01,372.130.11,317.9
One name paper6.134.9-5.929.0-1.527.5
Bonds10.2887.020.5849.027.5833.1
 Central bank25.9282.217.3281.82.7273.2
 Authorised deposit taking institutions-14.188.4-10.073.37.878.0
 Rest of world-7.1399.216.6386.615.7377.3
Other liabilities1.9490.11.4494.14.1457.3

State and local general government financial assets

State and local general government selected financial assets, $b
 Transactions,
Dec-21
Amounts outstanding,
Dec-21
Transactions,
Mar-22
Amounts outstanding,
Mar-22
Transactions,
Jun-22
Amounts outstanding,
Jun-22
Total assets-4.7575.8-2.2576.65.2589.2
Deposits1.789.70.189.8-1.188.7
Loans and placements4.064.3-1.962.45.768.1
Shares and equity-11.1389.50.0393.21.6402.6
 State and local PNFCs0.0309.60.0313.50.0325.2
 Other private non-fin corps-11.239.0-0.338.70.438.2
Other assets0.732.4-0.431.2-0.929.8

- nil or rounded to zero

State and local general government liabilities

State and local general government selected liabilities, $b
 Transactions,
Dec-21
Amounts outstanding,
Dec-21
Transactions,
Mar-22
Amounts outstanding,
Mar-22
Transactions,
Jun-22
Amounts outstanding,
Jun-22
Total liabilities10.1544.30.0521.319.8507.8
Loans and placements7.0321.5-1.4303.518.5309.2
 Central borrowing authorities8.6299.7-2.3280.813.4281.4
Unfunded superannuation claims1.0147.10.9142.21.0123.1
Other liabilities2.275.80.475.70.375.5

General government

General government (national, and state and local) were net borrowers of $21.5b, driven by

  • $28.1b in bond issuance
  • $13.1b in loan borrowings

National general government bond issuance rose to fund investment in defence equipment and capital transfers to state governments for disaster relief payments. Loan liabilities of state and local government grew to fund investment in road and rail infrastructure and buildings for health and education.

The total value of government bonds outstanding ($840.9b) continued to fall due to further increases in bond yields. 

Deposit assets increased $32.4b, driven by stronger than expected income tax revenue and proceeds from debt issuance being reserved to pay a bond line maturity in July. 

Capital investment

Figures in the capital investment section are in seasonally adjusted current prices.

Net lending (+) / borrowing (-)

Australia's net lending position increased by $15.6b to $18.2 this quarter. This was driven by a: 

  • $11.3b increase in national net saving
  • $6.6b decrease in change in inventories

Partially offset by:

  • $3.0b increase in gross fixed capital formation

National net lending as a proportion of GDP increased this quarter driven by a rise in net savings and a fall in change in inventories 

  • Financial corporations' net lending increased by $13.8b to $15.1b 
  • Non-financial corporations' net lending increased by $5.4b to $8.9b
  • General government net borrowing increased by $2.6b to $22.9b
  • Households' net lending decreased by $7.3b to $16.0b 

Notable drivers were: 

  • Financial corporations' net lending was driven by an increase in net saving due to a rise in interest receivable, with rises in interest rates across all loan products in line with the cash rate increases, and an increase in dividends receivable.
  • Non-financial corporations' net lending was driven by an increase in net savings and a decrease in change in inventories.
  • Households' net lending was driven by a decrease in net saving driven by a large rise in household consumption 

Capital Investment

National capital investment decreased to 22.2% as a proportion of GDP. 

Relative to GDP: 

  • Household investment decreased to 7.9%
  • Non-financial corporations' investment was flat at 9.9%
  • Financial corporations' investment was flat at 0.5%
  • General government investment increased 4.1%

While national capital investment fell as a proportion of GDP, it increased 2.3% in current price seasonally adjusted terms. 

In current price seasonally adjusted terms:  

  • Non-financial corporations' investment increased, driven by an increase in public and private non-financial corporations. 
  • General government investment increased, driven by an increase in both national and state and local general government
     

Data downloads

Time series spreadsheets

Data files

Previous catalogue number

This release previously used catalogue number 5232.0

Revisions and changes

Revisions in this issue

There have been revisions to previously published aggregates due to:

  • Quality assurance reviews affecting the published aggregates after March quarter 2020, in addition to amendments to data collected in the ABS Survey of Financial Information, ABS Survey of International Investment and to data derived from Australian Prudential Regulation Authority (APRA) administrative data sets.
  • Revisions to the sectoral capital accounts are due to more up-to-date data being incorporated and seasonal adjustment processes.
     
Back to top of the page