Articles
This quarter's Finance and Wealth includes the following articles:
Financing resources and investment table
| Non-financial corps | Financial corps | Government | Households | Total national | Rest of world | |||
|---|---|---|---|---|---|---|---|---|
| Financing resources | ||||||||
| Net saving (a) | 43.7 | 3.0 | -37.4 | 33.7 | 43.0 | -12.8 | ||
| plus Consumption of fixed capital | 44.2 | 3.2 | 11.4 | 31.6 | 90.4 | - | ||
| Gross saving | 87.8 | 6.2 | -26.0 | 65.3 | 133.4 | -12.8 | ||
| plus Net capital transfers | 1.0 | 0.0 | -2.2 | 1.0 | -0.2 | 0.2 | ||
| less Statistical discrepancy (b) | - | - | - | - | -0.4 | - | ||
| Total financing resources | 88.8 | 6.2 | -28.1 | 66.3 | 133.6 | -12.6 | ||
| Uses of financing (investment) | ||||||||
| Capital formation | ||||||||
| Gross fixed capital formation | 52.1 | 2.8 | 21.1 | 41.5 | 117.5 | - | ||
| plus Changes in inventories | 0.2 | 0.0 | 0.9 | 2.4 | 3.5 | - | ||
| plus Net acquisition of non-produced non-financial assets | -0.3 | - | 0.3 | - | - | - | ||
| Total capital formation | 52.0 | 2.8 | 22.2 | 43.9 | 121.0 | - | ||
| plus Financial investment | ||||||||
| Aquistition of financial assets | 39.5 | 10.8 | -24.5 | 64.7 | 21.5 | 11.7 | ||
| less Incurrence of financial liabilities | 13.6 | 13.6 | 28.8 | 24.8 | 11.7 | 21.5 | ||
| Net Financial investment (Net lending (+) / net borrowing (-)) | 25.9 | -2.7 | -53.2 | 39.9 | 9.8 | -9.8 | ||
| less Net errors and omissions | -10.9 | -6.1 | -2.9 | 17.6 | -2.8 | 2.8 | ||
| Total investment | 88.8 | 6.2 | -28.1 | 66.3 | 133.6 | -12.6 | ||
- nil or rounded to zero
(a) Net saving for the rest of world is the balance on the external income account.
(b) The statistical discrepancy is not able to be distributed among the sectors.
Financial market summary table
| Amounts outstanding, Sep-20 | Transactions, Sep-20 | Other changes, Dec-20 | Amounts outstanding, Dec-20 | ||
|---|---|---|---|---|---|
| Currency and deposits | |||||
| Currency | 99.5 | 3.3 | - | 102.8 | |
| Transferable deposits | 1,465.2 | 90.2 | -3.3 | 1,552.1 | |
| Other deposits | 1,499.7 | -61.4 | -14.0 | 1,424.3 | |
| Short term debt securities | |||||
| Bills of exchange | 14.2 | -1.8 | - | 12.4 | |
| One name paper | 480.9 | 9.5 | -6.3 | 484.1 | |
| Long term debt securities | |||||
| Bonds, etc. | 3,235.2 | 2.2 | -40.8 | 3,196.6 | |
| Derivatives | |||||
| Derivatives | 895.1 | -76.1 | 132.2 | 951.2 | |
| Loans and placements | |||||
| Short term | 402.6 | -16.2 | -2.2 | 384.2 | |
| Long term | 4,083.7 | 17.9 | -6.9 | 4,094.7 | |
| Shares and other equity | |||||
| Listed | 1,943.8 | 22.0 | 286.6 | 2,252.4 | |
| Unlisted | 4,882.7 | 77.0 | 70.4 | 5,030.1 | |
| Insurance technical reserves | |||||
| Reserves of pension funds and life | 2,682.7 | 20.7 | 157.7 | 2,861.0 | |
| General insurance payments | 134.3 | 4.7 | 0.0 | 139.0 | |
- nil or rounded to zero
Flow of funds diagrams
Net transactions during December quarter 2020
Image
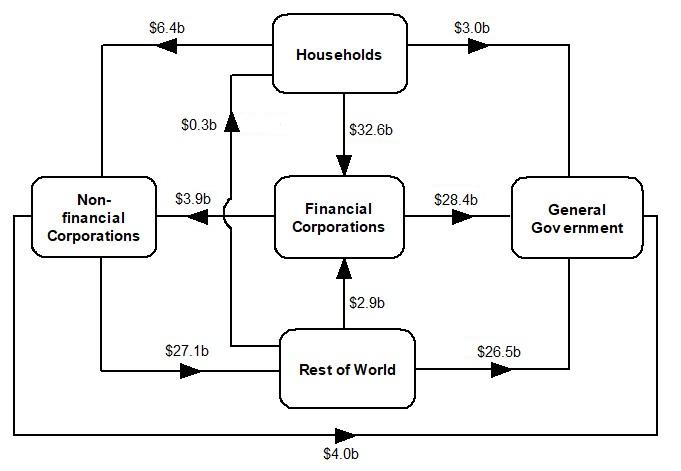
Description
Amounts outstanding at end of December quarter 2020
Image
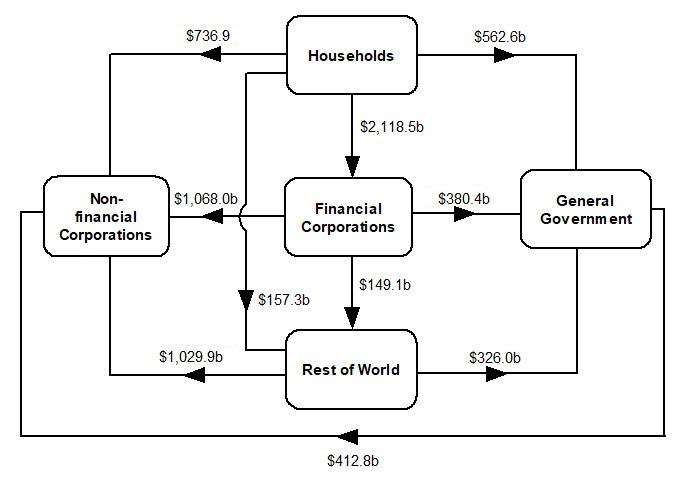
Description
National investment
National investment rose by $12.0b to $121.0b in the December quarter.
General government investment increased by $4.1b to $22.2b driven by an increase in state and local capital investment.
Non-financial corporations' investment increased slightly by $48m to $52.0b, driven by an increase in gross fixed capital formation.
Household investment rose $7.7b to $43.9b, from $36.2b in the previous quarter.
Financial investment
Australia was a net lender of $9.8b, the seventh consecutive quarter of net lending. The main contributors were a:
- $53.7b increase in rest of world equities, driven by pension funds and non-money market funds
- $12.3b repayment of loans driven by other private non-financial corporations (OPNFC)
Pension funds and non-money market funds sought increased returns in overseas markets as economic conditions continued to improve. OPNFC repaid debt and sought to raise funds through equity
Households
Households' $40.0b net lending position was the result of a $64.7b acquisition of assets and a $24.8b incurrence of liabilities, driven by a:
- $28.1b increase in deposits
- $19.7b increase in net equity in pension funds
- $22.8b increase in loan borrowings
The increase in deposits reflects increased household saving due to ongoing government income support packages such as JobKeeper and economic support payments, although they were scaled back during the quarter. With economic conditions improving and interest rates at record lows households increased their loan borrowings. Net equity in pension funds increased as less households withdrew funds under the early access to superannuation policy.
Non-financial corporations
Non-financial corporations' $25.9b net lending position was due to a $39.5b acquisition of financial assets and a $13.6b increase in liabilities. The increase in assets was driven by a:
- $18.0b increase in share and other equity investments
- $9.9b increase in deposits
With continued recovery of onshore and overseas financial markets , non-financial corporations increased their holdings of equity. Deposits increased as non-financial corporations continued to save.
General government
General government's $53.2b net borrowing position was due to a $24.5b decrease in assets and $28.8b increase in liabilities and driven by:
- $32.7b decrease in deposit assets
- $23.5b net issuance of bonds
- $18.1b increase in loan borrowings
Government drew down on deposits to finance expenditure and reduced their debt issueance and loan borrowings