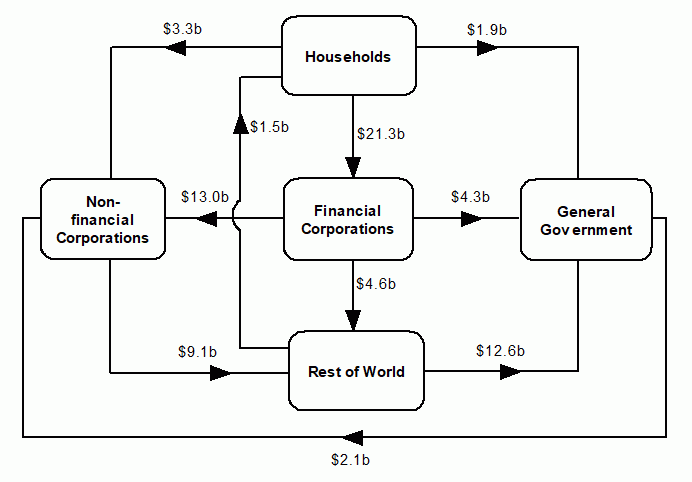
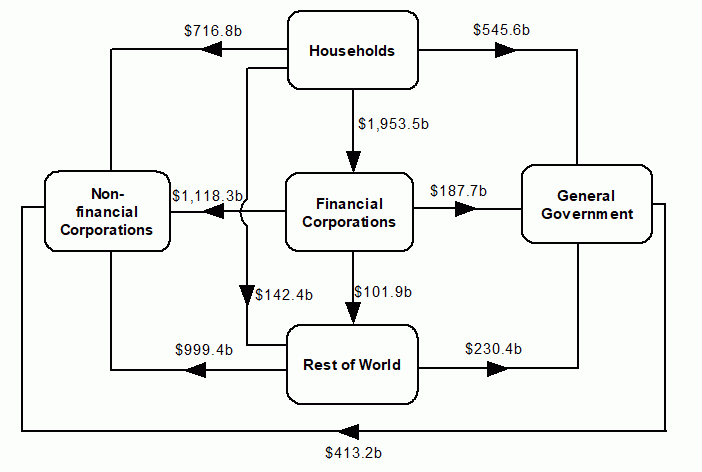
Australian National Accounts: Finance and Wealth

This is not the latest release View the latest release

Contains quarterly data for household sector, credit market, intersectoral financial flows, financial market, sectoral analysis and capital investment

Reference period
December 2019
Released
26/03/2020

Key statistics

  • National investment rose by $10.2b this quarter to $122.9b.
  • Household net worth increased 3.3%.
  • Demand for credit was the weakest for a December quarter since 2012.

Main features

December key figures

Financing resources and investment, original, current prices

   Non-financial corporationsFinancial corporationsGeneral governmentHouseholdTotal NationalRest of world
   $b$b$b$b$b$b
Financing resources      
 Net saving (a)23.3-2.96.24.230.8-1.8
 plus Consumption of fixed capital42.43.110.830.987.3-
 Gross saving65.70.217.135.2118.1-1.8
 plus Net capital transfers0.8--1.60.7-0.20.2
 less Statistical discrepancy (b)-----6.6-
 Total financing resources66.50.215.435.8124.5-1.7
Uses of financing (Investment)      
 Capital formation      
  Gross fixed capital formation53.33.420.841.0118.5-
  plus Change in inventories1.8-0.12.54.4-
  plus Net acquisition of non-produced non-financial assets-0.2-0.2---
  Total capital formation54.83.421.143.6122.9-
 plus Financial investment      
  Acquisition of financial assets4.820.32.143.5-6.3-7.9
  less Incurrence of liabilities21.717.29.520.6-7.9-6.3
  Net financial investment (Net lending (+) / net borrowing (-))-17.03.1-7.422.91.7-1.7
 less Net errors and omissions-28.66.3-1.730.6--
 Total investment66.50.215.435.8124.5-1.7

- nil or rounded to zero (including null cells)
a. Net saving for the Rest of world is the balance on the external income account.
b. The statistical discrepancy is not able to be distributed among the sectors.
 

National investment reaches a record high

National investment rose by $10.2b this quarter to $122.9b, the highest level on record.

Household investment grew to $43.6b, up from $38.9b in the previous quarter.

General government investment increased by $4.1b this quarter to $21.1b. This was impacted by the purchase of assets from the public corporations sector.

Non-financial corporations investment increased by $1.2b to $54.8b. There was a stronger than usual build up of mining inventories this quarter. Inventories of coal increased as production returned to more typical levels following planned and unplanned maintenance during the September quarter.

Australia is a net lender for a third consecutive quarter

National net lending was $1.7b in December quarter 2019, a slowdown from the $6.1b and $3.1b recorded in the June and September quarters 2019. Australia repaid $7.9b of liabilities with non-residents and disposed $6.3b of financial assets.

The decrease in Australia's liabilities to rest of the world of $53.4b was driven by the settlement of $41.5b in derivative contracts by authorised deposit taking institutions (ADIs). This was partly offset by non-residents acquiring private non-financial corporations' shares and other equity ($9.9b) and short term debt securities ($25.7b) issued by ADIs. Australia's transactions of financial assets during the quarter was -$6.3b as residents settled $42.3b of ADI derivative contracts with the rest of world, this was partly offset by acquisition of $21.2b in overseas shares and lending of $9.5b in loans to rest of world.

Non-financial corporations were net borrowers of $17.0b, driven by issuance of equity ($23.5b).

The general government was a net borrower of $7.4b, driven by the disposal of currency and deposit assets ($9.1b) and the issuances of short term debt securities ($7.5b) and loan borrowings ($6.0b).

Households were net lenders of $22.9b, accumulating $11.7b in deposits and accruing $19.3b in net equity in reserves of pension funds (superannuation), these were offset by loan borrowings of $19.8b.

Household sector summary

Household accumulation of wealth

  Amount outstanding at endTransactions duringOther changes in volume during (a)Holding gains (+)/losses (-) duringAmount outstanding at end
  Sep Qtr 2019Dec Qtr 2019Dec Qtr 2019Dec Qtr 2019Dec Qtr 2019
  $b$b$b$b$b
Non-financial assets     
 Land and dwellings6 989.58.68.3275.27 281.6
 Other non-financial assets666.04.0-1.3671.4
Financial assets5 762.643.5-41.85 847.9
Liabilities2 470.020.6-1.22 491.9
Net worth10 948.135.58.3317.111 309.0
Memorandum item     
 Consumer durables (b)406.45.2--1.1410.5

- nil or rounded to zero (including null cells)
a. Not all other changes in volume are separately identifiable. Some have been shown as holding gains.
b. Consumer durables are not included in net worth.
 

Household wealth

Household net worth (wealth) increased $360.9b (3.3%) in December quarter 2019 driven by a $382.8b increase in total assets. This was partly offset by a $21.8b increase in total liabilities. Household wealth per capita increased $12,809 to $442,705, the largest increase since December quarter 2009. With quarterly growth in household wealth at its highest in ten years, through the year growth in household wealth has recovered from the negative results seen in 2018-19.

The increase in total assets was driven by residential land and dwellings. The value of residential land and dwellings rose $282.0b (4.3%) driven by real holding gains of $233.4b. This is the strongest real holding gain on residential land and dwellings since December quarter 2009.

The value of household financial assets increased 1.5%, a moderate result given the record growth in early 2019. This reflects smaller holding gains on financial assets, while net financial transactions were steady. While holdings in pension fund assets are at a high of 55.7% of total household financial assets, the share of deposits remain at a nine year low of 19.4%. The long term decline in deposits as a proportion of financial assets is in line with record low interest rates, with the cash rate cut by 25 basis points in October, following the 25 basis point cuts in both June and July.

The growth in financial assets was driven by reserves in pension funds, which increased $51.7b, of which $19.3b were due to transactions and $32.4b were due to revaluations. As 77.4% of reserves in pension funds were invested in shares, the movement is influenced by the performance of the domestic and overseas stock markets.

Household liabilities grew 0.9%, following soft growth last quarter. Total household sector liabilities were $2,491b, 92% of which were long term loans. The 0.9% growth in long term loans was due to a pick up in owner occupier and unincorporated business loans, partly offset by falls in investor loans.

Long term loans from authorised deposit taking institutions (ADIs) made up $18.1b of total transactions in long term loans. Short term loan borrowing by households increased 0.2%, driven by an increase in transactions with other broad money institutions ($0.3b). Net transactions in short term loans borrowed from ADIs, which includes borrowing through credit cards, fell $0.2b, the first negative result for a December quarter since 2015.

Household transactions in net worth were $35.5b. Financial transactions were the largest component contributing $22.9b, driven by a net acquisition of financial assets of $43.5b, and partly offset by a net incurrence of liabilities of $20.6b. Net capital formation contributed $12.6b to household transactions in net worth and was driven by land and dwellings ($8.6b) and other non-financial assets ($4.0b).

Household debt to assets ratios

The household debt to assets ratio decreased from 18.4 to 18.1, as growth in household assets (2.9%) outgrew household debt (0.9%), indicating households' gearing ratio fell this quarter. This is largely a reflection of the value of land and dwellings owned by households outgrowing mortgage debt. The ratio of mortgage debt to residential land and dwellings decreased from 28.4 to 27.5 this quarter. The decrease in the ratio is driven by the strongest increase in the value of residential land and dwellings since December quarter 2009, with growth in mortgage debt still relatively weak.

The household debt to liquid asset ratio decreased from 109.9 to 109.6, as growth in household liquid assets (1.1%) slightly outweighed growth in household debt (0.9%). The fall in the ratio reflects an improvement in households' ability to extinguish debts using liquid assets (currency, deposits, debt securities, and equity) quicker.

The wealth effect

The household saving ratio decreased from $10.7b to $1.4b in December quarter 2019. The $9.2b decrease was driven by a decrease in gross disposable income ($14.9b), partly offset by increases in final consumption expenditure ($13.5b) and consumption of fixed capital ($0.2b). The decrease in gross disposable income was driven by a $11.8b decrease in dividends received and a $13.9b increase in income tax payable.

Household gross disposable income adjusted for other changes in real net wealth (wealth effect) increased from $532.5b to $585.4b, and household net saving adjusted for other changes in real net wealth increased from $226.2b to $265.3b. The increases in gross disposable income and household net saving when adjusted for other changes in net wealth are due to total real holding gains of $252.2b, the strongest result since December quarter 2009.

Credit market summary

Non-financial domestic sectors

  Credit market outstandings at endDemand for credit duringOther changes duringCredit market outstandings at end
  Sep Qtr 2019Dec Qtr 2019Dec Qtr 2019Dec Qtr 2019
  $b$b$b$b
Non-financial corporations    
 Investment funds468.75.0-0.8472.9
 Other private3 655.016.829.83 701.6
 Public137.4-0.4-137.0
General government    
 National661.56.0-19.4648.1
 State and local176.67.0-0.1183.5
Households2 362.619.61.22 383.5
Total7 462.054.010.67 526.6

- nil or rounded to zero (including null cells)
 

Demand for credit

Demand for credit ($54.0b) was the weakest for a December quarter since 2012, and follows the softest September quarter ($39.6b) since 2004. In annualised terms, demand for credit in 2019 was the lowest in 7 years.

Demand for credit this quarter was driven by households ($19.6b) and other private non-financial corporations ($16.8b). Households borrowed $21.0b this quarter, as their demand for credit rebounded from last quarter, which was negative for the first time since March quarter 1993. Equity raising of $18.9b by other private non-financial corporations, $7.5b of issuance of one name paper by national general government and $5.9b of loan borrowings by state and local general government were the other drivers of demand for credit.

Household's weak demand for credit over most of 2019 reflected the impact of a soft housing market over the first half of 2019 and tight lending environment for residential property loans. However, the year ended with strengthening of the housing market that resulted in an increase in household long term loans with ADIs during the quarter ($18.1b), the strongest rise since September quarter 2018. This growth was driven entirely by owner occupiers as investor loan balances continued to fall.

Demand for credit by other private non-financial corporations over 2019 was the softest since 2012, and coincides with the lowest annual equity raising by the sector since 2012. Loan borrowings by the sector have also been subdued through the year.

General government's demand for credit in 2019 was the highest since 2017. The demand was driven by relative strength in both state and local general government borrowings from central borrowing authorities, and national general government issuance of one name paper over the year. Net bond issuance by national general government in 2019 was the lowest annual amount since 2008.

Valuations increases in bonds and equities drive credit market outstanding in 2019

Credit market outstanding rose 0.9% this quarter, following last quarter’s 1.3% increase. The growth was driven mainly by demand for credit with the exception of other private non-financial corporations, which exhibited revaluation gains on its shares and other equity. The revaluation losses on government bonds during the quarter was a result of increasing yields following several quarters of falls.

Despite subdued demand for credit over 2019, significant valuation increases over the year pushed through the year growth in credit market outstanding of non-financial domestic sectors to 7.5%. Strong price increases in the Australian stock market and falling bond yields, particularly over the first 3 quarters of the year, were the main contributors to the growth.

Intersectoral financial flows

Net transactions during December quarter 2019

During December quarter 2019, financial corporations borrowed a net $21.3b from households, consisting of $12.0b in deposits and $19.3b in net equity in pension fund reserves, partially offset by $19.0b in household loan borrowings.

General government borrowed a net $12.6b from the rest of the world. This was driven by rest of world purchasing $10.4b of government bonds.

The rest of world sector borrowed a net $9.1b from the non-financial sector. This was primarily through increases in rest of world loan borrowings from non-financial corporations of $6.8b and non-financial corporations' purchases of rest of world equities of $6.3b, partially offset by a $4.4b decrease in non-financial corporations' deposits held by the rest of world sector.

Diagram shows Net transactions during December quarter 2019
This is a flowchart that shows the intersectoral financial flows of net transactions during the 2019 December quarter. From Households, $21.3 billion flows into Financial Corporations, $3.3 billion flows into Non-financial Corporations and $1.9 billion flows into General Government. From Financial Corporations, $13 billion flows into Non-financial Corporations, $4.6 billion to the Rest of World and $4.3 billion into General Government. From General government, $2.1 billion flows into Non-financial corporations. From Non-financial corporations $9.1 billion flows to Rest of World. From the Rest of World, $12.6 billion flows into General Government and $1.5 billion flows into Households.

Amounts outstanding at end of December quarter 2019

Net claims on non-financial corporations were $1,118.3b from financial corporations, $999.4b from rest of world, $716.8b from households and $413.2b from general government.

Net claims on financial corporations from household were $1,953.5b. These were mainly comprised of superannuation reserves of $2,793.0b and deposits of $1,115.2b, partly offset by household loan liabilities of $2,229.4b.

Diagram shows Amounts outstanding at end of December quarter 2019
This is a flowchart that shows the intersectoral financial flows of amounts outstanding at the end of the 2019 December quarter. From households $1,953.5 billion flows to financial corporations, $716.8 billion to non-financial corporations, $545.6 billion to general government, and $142.4 billion to the rest of the world. From financial corporations $187.7 billion flows to general government, $1,118.3 billion to non-financial corporations and $101.9 billion to the rest of the world. From general government $413.2 billion flows to non-financial corporations Finally, from the rest of the world $230.4 billion flows to general government, and $999.4 billion to non-financial corporations.

Financial market summary

Australian financial market

  Outstanding at endTransactions duringOther changes duringOutstanding at end
  Sep Qtr 2019Dec Qtr 2019Dec Qtr 2019Dec Qtr 2019
  $b$b$b$b
Currency and deposits    
 Currency85.22.9-88.1
 Transferable deposits1 121.820.6-2.31 140.0
 Other deposits1 493.6-12.7-6.41 474.6
Short term debt securities    
 Bills of exchange21.5-2.0-19.5
 One name paper473.241.1-4.6509.8
Long term debt securities    
 Bonds, etc.2 772.1-5.7-51.92 714.5
Derivatives    
 Derivatives781.0-99.10.5682.5
Loans and placements    
 Short term402.510.1-0.9411.7
 Long term3 944.527.0-5.53 966.0
Shares and other equity    
 Listed2 094.514.6-3.12 106.1
 Unlisted4 938.629.965.05 033.5
Insurance technical reserves    
 Reserves of pension funds and life offices2 741.522.033.22 796.7
 General insurance prepayments and reserves125.74.5-130.3

- nil or rounded to zero (including null cells)
 

Negative growth in the bonds market

The bonds market contracted 2.1% mainly due to revaluations of -$51.9b resulting from increases in government bond yields in December quarter 2019. Net maturities of $5.7b also contributed to the negative growth.

Other notable events in financial markets during the quarter include:

  • growth in the derivatives market of -12.6% due to settlement of derivative contracts (-$99b)
  • flat growth in the deposits market, with growth in transferable deposits (1.6%) offset by negative growth in other deposits (-1.3%)
  • increase of 7.7% in the one name paper market due to increases in issuance offshore

Sectoral analysis

Private non-financial corporation's debt to equity ratio decreases

The debt to equity ratio for private non-financial corporations adjusted for price changes decreased slightly from 0.69 to 0.68. The ratio has stabilised at this level over the past 2 years, and has not been this low since March quarter 2005. On a non-adjusted basis, the debt to equity ratio decreased by 2 basis points to 0.50. The non-adjusted ratio is relatively volatile due to the impact of valuation changes in shares and other equity.

Private non-financial corporations' funding through debt and equity shifted this quarter, with the sector seeking funding through raising of equity ($23.5b), while paying down debt (-$1.8b). This reduction in debt was driven by net maturities of long-term debt securities held by rest of world and short-term debt securities held by authorised deposit taking institutions.

Financial assets and liabilities of financial corporations

  Outstanding at endTransactions duringOther changes duringOutstanding at end
  Sep Qtr 2019Dec Qtr 2019Dec Qtr 2019Dec Qtr 2019
  $b$b$b$b
Assets of financial corporations    
 Central bank186.51.1-3.3184.3
 Authorised deposit taking institutions4 087.5-25.9-15.44 046.2
 Other broad money institutions189.26.2-0.9194.5
 Pension funds2 467.915.326.42 509.6
 Life insurance corporations--0.7-
 Non-life insurance corporations238.43.50.3242.2
 Money market investment funds42.2-0.9-0.141.2
 Non-money market investment funds1 023.44.1-2.91 024.5
 Central borrowing authorities408.92.9-0.1411.7
 Securitisers496.63.0-499.5
 Other financial corporations84.1-2.00.582.7
Liabilities of financial corporations    
 Central bank186.11.5-1.6186.0
 Authorised deposit taking institutions4 246.1-30.5-52.94 162.6
 Other broad money institutions156.04.6-2.7157.9
 Pension funds2 661.119.230.92 711.2
 Life insurance corporations--2.0-
 Non-life insurance corporations258.22.5-3.3257.4
 Money market investment funds42.2--1.041.2
 Non-money market investment funds1179.4-4.416.41 191.4
 Central borrowing authorities400.34.1-4.2400.2
 Securitisers511.07.1-8.1510.1
 Other financial corporations185.70.12.6188.4

- nil or rounded to zero (including null cells)
 

Financial corporations' assets increased $39.3b to $6,450.4b this quarter. The rise was driven by increases in loans and placements ($33.2b), and shares and equity ($65.4b), offset by decreases in bonds (-$23.7b) and derivatives (-$41.0b). Liabilities rose $9.0b, driven by increases in net equity in reserves ($55.2b) and one name paper issued offshore ($27.4b), offset by decreases in derivatives (-$41.4b) and bonds issued offshore (-$24.5b).

Authorised deposit taking institutions (ADIs) deposit funding increases

ADIs largest funding source, deposits, increased to 58.3% this quarter, while equity and long term debt securities fell. The fall in equity funding reflects large negative price changes and the fall in long term debt securities was due to a large number of bond maturities, bringing the bond funding source to its lowest level in 14 years. Financing through short term debt securities rose to 8.0%.

Household loan balances increased over the quarter

Long term loans to households from ADIs and securitisers grew 0.8% ($17.6b) this quarter. The growth was driven entirely by lending from ADIs ($18.1b), as household loans with securitisers decreased slightly (-$0.5b). The growth in lending from ADIs is the strongest since September quarter 2018, and reflects a gradually recovering housing market and increasing loan commitments over the second half of 2019. However, part of the increase is being moderated by households maintaining their mortgage repayment amounts despite the multiple rate cuts over the year reducing the minimum required repayment. Despite the strength this quarter, the weakness in through the year growth in loan balances (-2.8%) reflects the tight lending conditions and weak housing market through the majority of 2019.

Both ADIs and securitisers need to be considered when assessing movements in loans assets of ADIs. Securitisers are trusts or corporations that pool various types of assets, such as property loans or credit card debt, and package them as collateral backing for bonds or short-term debt securities. Graph 4 includes both 'on market' and internal securitisation. 'On market' securitisation is used by ADIs as a way to move loan assets off their balance sheets to fund their lending business, while the purpose of internal securitisation is to use the securities as collateral with the RBA in its repurchase agreement program.

Rise of self-managed superannuation funds (SMSF)

Graph 5 shows that SMSF financial assets as a proportion of the pension funds sector have grown since the inception of these funds in December quarter 1999 (14%) to a peak in September 2012. As at 31 December 2019 they are 24% of total financial assets of pension funds, with a value of $610.0b.

Total pension fund (superannuation) assets rose $41.6b (1.7%) driven by valuation increases in shares and other equity ($24.8b). Valuations were subdued due to weak performance of the ASX. Equity remains the largest financial asset held by pension funds (77.4%).

Pensions funds are also indirectly exposed to equities and debt securities through non-money market financial investment funds (NMMF). Pension funds holdings in NMMF equity represent 42.3% of their total investment in equities. This quarter NMMF assets increased 0.1%, subdued growth was due to negative revaluations in holdings of bonds (-$3.7b) detracting from positive transactions ($4.1b).

Households claims on net equity in reserves of superannuation (pension funds) was $2,664.0b at the end of the quarter.

National general government experiences largest decrease in long term debt liability

Maturities of national general government bonds were greater than issuances, resulting in a net maturity of $2.2b. This is the second quarter of net maturity since the global financial crisis (GFC) when net bond issuance by government began trending upwards. In annualised terms, issuance over recent quarters has gradually fallen, and growth in government bond balances now remains at a low rate. This is in line with national general government gross saving strengthening to levels seen prior to the GFC. The majority of bond maturities this quarter was driven by ADIs reducing their holdings, while bond issuances were predominantly purchased by rest of world.

Total bond liabilities decreased $17.0b, driven by negative revaluations as the Commonwealth Government 10 year bond yield increased for the first time since March quarter 2018. This, combined with the net maturities resulted in the largest quarterly decrease of national general government bond liabilities within the time series.

State and local general government continue to borrow for capital investment

State and local general government continued to borrow, with an increase of $5.5b in total liabilities this quarter. The rise in liabilities was driven by long term loan borrowing from central borrowing authorities which increased $5.4b. This is consistent with the $5.8b raised through net bond issuance by central borrowing authorities, providing funds for expenditure by respective state governments. Balances of loans and placements with central borrowing authorities grew 17.8% through the year, maintaining its highest growth since March quarter 2013, as state governments borrowed funds to finance strong capital investment.

Rest of world continues to borrow from Australia

The net financial position of rest of world at the end of December 2019 was $891.5b. This $83.4b decrease from the previous quarter was due to valuation decreases of $81.8b and net transactions (net change in financial position) of -$1.7b, resulting in the third consecutive quarter of net lending by Australia.

Rest of word investment in Australia fell 1.3% due to negative valuations ($45.4b) and transactions (-$7.9b) resulting in a decrease in rest of world holdings of assets to $3,903.8b. Negative valuations in holdings of bonds($28b) were driven by increased yield in government issued bonds combined with appreciation of the Australian dollar against almost all major trading currencies. Other contributors to valuation decreases were equities ($6.2b), deposits ($4.7b) and loans and placements ($3.1b). Negative transactions were driven mainly by settlements of derivatives issued by ADIs ($41.4b) and repayments of loans and placements ($7.2b), partly offset by increased holdings of one name paper ($32.2b) and equities ($13.4b).

Rest of world increased their liabilities to Australia $3,012.3b, recording valuations of $36.4b and transactions of -$6.3b. Positive valuations were wholly driven by equities ($48.6b) as overseas equity markets out performed the domestic share market. Negative transactions were driven by derivatives settlements ($39.7b), partially offset by issuance of equities ($21.2b) and loans and placements ($9.5b).

Capital investment

Australia's net lending position weakens

Australia's net lending position declined from $6.3b to $0.8b. This was predominantly due to a $4.5b decline in national net saving.

At a sector level, net lending by households fell. A decline in net saving drove the result, as income tax payable returned to more typical levels after being impacted by the Low and Middle Income Tax Offset (LMITO) policy introduced in the September quarter. The increase in income tax payable by households contributed to the general government sector recording a corresponding increase in net saving and a decline in net borrowing.

Non-financial corporations experienced a $3.0b increase in net borrowing this quarter. Private non-financial corporation returned to a net borrowing position, as gross savings declined. The decline in saving was impacted by lower profits for the Mining industry, linked to falls in commodity prices.

National capital investment remains at a historic low

National capital investment decreased to 22.5% as a proportion of GDP, continuing its downward trend since December quarter 2017.

Investment by non-financial corporations fell to 10.1% of GDP. This is the ninth consecutive quarterly decline in the ratio. In addition to weaker private sector non-mining investment, public corporations saw a fall due to the sale of assets to the general government sector. Correspondingly, general government investment increased as a proportion of GDP.

Investment by households remained unchanged at 7.8% of GDP. Weaker investment in dwellings was partly offset by ownership transfer costs.

Changes to this issue

Table 53. Nominal Value of Short Term Loans and Placements Market ($ million) and Table 54. Nominal Value of Long Term Loans and Placements Market ($ million) are available in this release following quality assurance work.

Revisions in this issue

This issue contains revisions to the original estimates of the capital accounts back to September quarter 2014 and concurrent seasonal adjustment.

There have been revisions to the financial accounts and balance sheets due to quality assurance reviews affecting the published aggregates after December quarter 2017, in addition to amendments to data collected in the ABS Survey of Financial Information, ABS Survey of International Investment and to data derived from Australian Prudential Regulation Authority (APRA) administrative data sets.

Inquiries

For further information about these and related statistics, contact the National Information and Referral Service on 1300 135 070 or National accounts by email national.accounts@abs.gov.au.

Privacy policy

The ABS Privacy Policy outlines how the ABS will handle any personal information that you provide to us.

Data downloads

Table 1. Credit market outstandings ($ million)

Table 2. Demand for credit ($ million)

Table 3. National capital account, current prices ($ million)

Table 4. National financial assets and liabilities ($ million)

Table 5. Non-financial corporations capital account, current prices ($ million)

Table 6. Financial assets and liabilities of non-financial corporations ($ million)

Table 7. Private non-financial corporations capital account, current prices ($ million)

Table 8. Financial assets and liabilities of private non-financial corporations ($ million)

Table 9. Financial assets and liabilities of private non-financial investment funds ($ million)

Table 10. Financial assets and liabilities of other private non-financial corporations ($ million)

Table 11. Public non-financial corporations capital account, current prices ($ million)

Table 12. Financial assets and liabilities of public non-financial corporations ($ million)

Table 13. Financial corporations capital account, current prices ($ million)

Table 14. Financial assets and liabilities of financial corporations ($ million)

Table 15. Financial assets and liabilities of the central bank ($ million)

Table 16. Financial assets and liabilities of authorised deposit taking institutions ($ million)

Table 17. Financial assets and liabilities of other broad money institutions ($ million)

Table 18. Financial assets and liabilities of pension funds ($ million)

Table 19. Financial assets and liabilities of pension funds - self-managed superannuation funds ($ million)

Table 20. Financial assets and liabilities of life insurance corporations ($ million)

Table 21. Financial assets and liabilities of non-life insurance corporations ($ million)

Table 22. Financial assets and liabilities of money market financial investment funds ($ million)

Table 23. Financial assets and liabilities of non-money market financial investment funds ($ million)

Table 24. Financial assets and liabilities of central borrowing authorities ($ million)

Table 25. Financial assets and liabilities of securitisers ($ million)

Table 26. Financial assets and liabilities of other financial corporations ($ million)

Table 27. General government capital account, current prices ($ million)

Table 28. Financial assets and liabilities of general government ($ million)

Table 29. National general government capital account, current prices ($ million)

Table 30. Financial assets and liabilities of national general government ($ million)

Table 31. State and local general government capital account, current prices ($ million)

Table 32. Financial assets and liabilities of state and local general government ($ million)

Table 33. Household capital account, current prices ($ million)

Table 34. Financial assets and liabilities of households ($ million)

Table 35. Household balance sheet, current prices ($ billion)

Table 36. Analytical measures of household income, consumption, saving and wealth, current prices ($ billion)

Table 37. Rest of world capital account, current prices ($ million)

Table 38. Financial assets and liabilities of rest of world ($ million)

Table 39. The currency market ($ million)

Table 40. The transferable deposits market ($ million)

Table 41. The other deposits market ($ million)

Table 42. The bills of exchange market ($ million)

Table 43. The one name paper market ($ million)

Table 44. The bonds market ($ million)

Table 45. The derivatives and employee stock options market ($ million)

Table 46. The short term loans and placements market ($ million)

Table 47. The long term loans and placements market ($ million)

Table 48. The listed shares and other equity market ($ million)

Table 49. The unlisted shares and other equity market ($ million)

Table 50. Accounts payable/receivable ($ million)

Table 51. Financial accounts summary of bank deposits and lending split by household subsectors ($ million)

Table 52. Financial accounts summary of loan outstandings to households for housing by type of lending institution ($ million)

Table 53. Nominal value of short term loans and placements market ($ million)

Table 54. Nominal value of long term loans and placements market ($ million)

All time series spreadsheets

Back to top of the page