This publication contains statistics of revenue collected by all levels of government in Australia in the form of taxes. The taxation revenue statistics presented are for the general government sector and include taxes received from public corporations (i.e. government owned/controlled corporations). This publication also contains a section on adjusted measures of government revenue, which provides analytical measures designed to facilitate an understanding of the level of government at which revenue is used rather than collected.
A feature of the Australian federal system is that the Commonwealth Government levies and collects all income tax, from individuals as well as taxes on profits from enterprises. It also collects a portion of other taxes, including taxes on the provision of goods and services. Income taxes levied on individuals and enterprises by the Commonwealth Government continue to provide well over half of taxation receipts collected by all levels of government in Australia. State governments revenue base consists of taxes on property, on employers' payroll, and on the provision and use of goods and services. Local governments sole source of taxation revenue is taxes on property.
Taxation reforms by government and changes across the Australian economy will influence the growth or decline in taxation receipts for individual tax categories over time.
Concept and definitions
The concepts and definitions underlying the statistics in this publication are described in detail in Australian System of Government Finance Statistics: Concepts, Sources and Methods, 2015 (AGFS15).
The main purpose of the Concepts, Sources, and Methods publication is to serve as a reference manual for users of GFS statistics who require a detailed understanding of the concepts, sources, and methods to analyse and interpret the information that the statistics convey. It contains a copy of the Taxes Classification, which dissects this major form of government revenue according to the type of tax collected.
Taxes classification
A tax is a compulsory levy imposed by the government, mainly to raise revenue. There is usually no clear and direct link between the payment of taxes and the provision of particular goods and services by government. Taxes are levied, inter alia, on income, wealth, production, sale and/or use of goods and services and the performance of activities.
Governments may regulate certain activities by issuing licences for which fees are payable. If the issue of such licences involves little or no work by the government then the revenue raised is deemed to be taxation revenue. However, if the government uses the issue of licences to exercise some proper regulatory function, such as checking the competency or qualifications of a would-be licensee, then the revenue raised is deemed not to be taxation revenue, but revenue from the sale of services by government unless it is clearly out of all proportion to the costs of providing the services.
The Taxes Classification (TC) is used to classify by detailed type all transactions in governments’ operating statements which are classified to the following economic type framework categories:
- taxes on income
- other current taxes
- taxes on products
- other taxes on production
- capital taxes.
The TC has been developed to provide sufficient detail for international reporting. The five groups of the TC, which represent the broad bases on which taxes are levied in Australia, are:
- taxes on income
- employers’ payroll taxes
- taxes on property
- taxes on the provision of goods and services
- taxes on the use of goods and performance of activities.
These tax groups are divided into fifteen subgroups according to the type of entities, property, activities, goods or services being taxed. The subgroups are further subdivided into sixty-eight classes, generally describing the specific type of tax collected in Australia.
Consolidation
To compile financial statistics for a specific level of government or any other grouping of public sector units, transactions and lending/borrowing relationships between units within the chosen grouping (sector or subsector) must be matched and eliminated to avoid double counting. The process of matching and eliminating these items within the chosen group is known as 'consolidation'.
Other aggregates used
Gross domestic product (GDP) is defined as the total market value of goods and services produced in Australia within a given period after deducting the cost of goods and services used up in the process of production, but before deducting allowances for the consumption of fixed capital (depreciation). The current price estimate of GDP is used to calculate the GDP ratios in this publication, see note "Taxation revenue as a proportion of gross domestic product (GDP)".
Interstate comparisons
As well as showing the variety of types of taxes levied in Australia, the tables in this publication have been designed to show the relative importance of the tax system of the Commonwealth, state, and local levels of government. They have also been designed to show the extent and composition of taxation levied by each state government (including subsidiary authorities). In this latter connection, it should be noted that interstate comparison of tax collections by state or local governments separately can be misleading unless account is taken of state-to-state variations in the range of activities for which these two levels of government are responsible. In the Australian Capital Territory, for example, only a state level of government exists, and several functions performed by it are undertaken by local government authorities in other jurisdictions.
Historical comparisons
GFS taxation statistics are presented on an accrual accounting basis. Due to changes associated with the introduction of accrual accounting, data for 1998-99 and subsequent years have been compiled on a different methodological basis to that of previous years which were compiled using a cash accounting methodology. Consequently, data for 1998-99 and following years are not directly comparable with the data for 1997-98 and earlier periods.
Taxation revenue as a proportion of gross domestic product (GDP)
The current price estimate of GDP is used to calculate the GDP ratios in this publication. This is obtained by reflating the average chain volume estimate, derived from the three independent approaches, by the implicit price deflator derived from the expenditure-based estimates. GDP is as published in Table 36, Expenditure on Gross Domestic Product (GDP), Chain volume measures and current prices in the December quarter issue in the relevant year of Australian National Accounts: National Income, Expenditure and Product (formerly known as cat. no. 5206.0).
Taxation per capita
The population estimates used to calculate the taxation per capita figures in this publication are Estimated Resident Population at 31 December of the relevant year, as published in National, State and Territory Population (formerly known as cat. no. 3101.0). The annual average taxation per capita is calculated by dividing the total taxation revenue by the Estimated Resident Population, for each jurisdiction.
Adjusted measures of government revenue
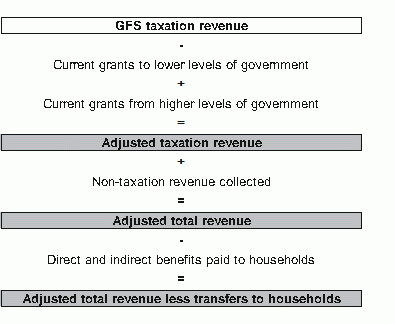
Adjusted taxation revenue offers an alternative presentation of revenue which considers the level of government at which revenue is used rather than simply collected. The analysis considers the flows, by way of current grants, that occur between the levels of government in Australia, and the impact that this has on revenue at each of these levels. Also considered is the effect of direct and indirect transfers to households on total revenue. To aid in the understanding of these flows, the following analytical measures of revenue have been derived. Users should note that these measures are not themselves part of the GFS framework.
Adjusted taxation revenue is equal to GFS taxation revenue collected by each level of government, plus current grants received from higher levels of government, less current grants paid to lower levels of government. This measure is designed to give a clearer indication of the levels of government at which taxation revenue is used or spent. The source for a significant amount of the current grants distributed between levels of government is taxation revenue, such as the GST. However, some of the revenue distributed may have come from a source other than taxation. Further, it should be noted that some of the current grants transferred from Commonwealth Government to the state and local governments are Specific Purpose Payments (SPPs). Unlike the GST-related grants, these payments are 'tied' to specific policy areas as agreed between the two levels of government. Similar arrangements exist between state and local government. SPPs for current purposes are included with other current grants in deriving adjusted taxation revenue.
Adjusted total revenue is equal to adjusted taxation revenue plus all other non-taxation sources of revenue. Non-taxation revenue includes revenue from sales of goods and services, property income (interest, dividends, income tax equivalents, land rents and royalties), fines, capital transfers, and current transfers other than grants. Current grants are excluded from non-taxation revenue because these have already been accounted for in deriving adjusted taxation revenue.
An important role of government is the redistribution of income, by way of direct and indirect 'benefits', to individual households. These transfers can be deducted from adjusted total revenue to derive adjusted total revenue less transfers to households. Direct benefits are regular cash payments made to households by government without any requirement to provide goods and services in return (e.g. welfare payments). Indirect benefits are non-cash benefits and services provided by government to individual households (e.g. concessions for transport and utilities, medical and pharmaceutical benefits, and natural disaster relief).
The three derived measures explained above are illustrated in the following diagram:
Diagram: Adjusted total revenue less transfers to households
Image
Description
Revisions
Statistical revisions are carried out regularly in Government Finance Statistics to reflect the most current information and data available.
Related publications
- Australian National Accounts: Finance and Wealth (formerly known as cat. no. 5232.0) - issued quarterly
- Australian National Accounts: National Income, Expenditure and Product (cat. no. 5206.0) - issued quarterly
- Australian System of Government Finance Statistics: Concepts, Sources and Methods, 2005 (AGFS05)
- Australian System of Government Finance Statistics: Concepts, Sources and Methods, 2015 (AGFS15)
- Australian System of National Accounts (formerly known as cat. no. 5204.0) - issued annually
- Government Finance Statistics, Annual (formerly known as cat. no. 5512.0) - issued annually
- Government Finance Statistics, Australia (formerly known as cat. no. 5519.0.55.001) - issued quarterly
- Government Finance Statistics, Education, Australia (formerly known as cat. no. 5518.0.55.001) - ceased 2021
- Government Financial Estimates, Australia (cat. no. 5501.0.55.001) - ceased 2014
- Information Paper: Accruals-Based Government Finance Statistics (cat. no. 5517.0) - issued March 2000
- Information Paper: Developments in Government Finance Statistics (cat. no. 5516.0) - issued February 1997