Experimental Environmental-Economic Accounts for the Great Barrier Reef

Latest release

The Environment and Agriculture Branch produced a set of Experimental Environmental-Economic and Ecosystem accounts for the Great Barrier Reef Region

Reference period
2017
Released
21/08/2017
Next release Unknown
First release

Summary of findings

This publication should be considered experimental, as improvements to methods and new data sources continue to become available. The ABS will be seeking input from key stakeholders with the intention of addressing issues and concerns in future updates.

Overview

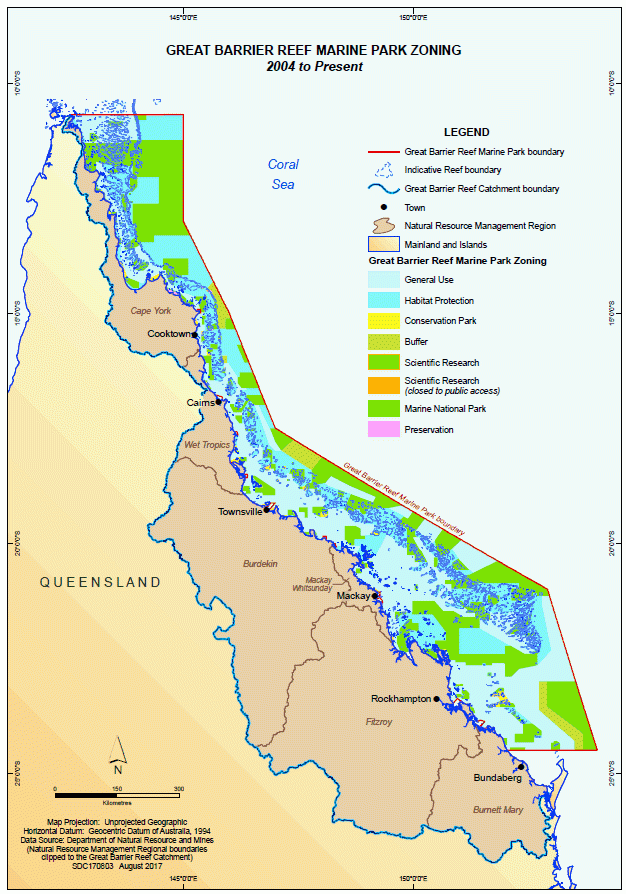
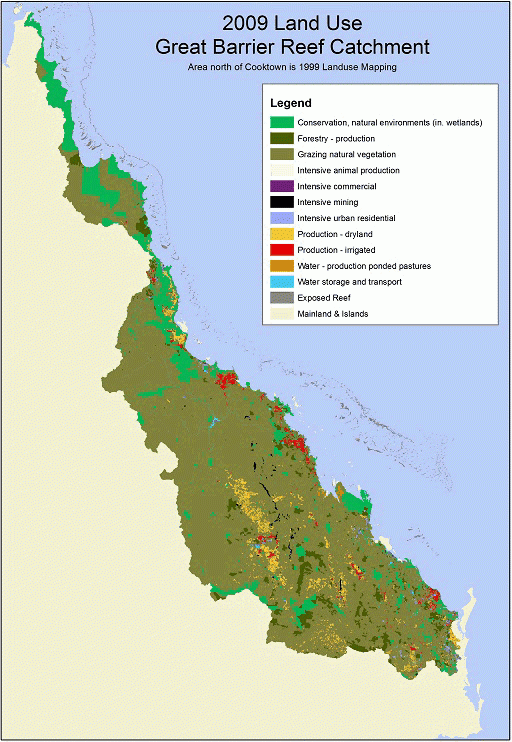
The Great Barrier Reef (GBR) is a globally significant area located in the Coral Sea off the coast of Australia. It extends for more than 2,300 kilometres along the north-eastern coast near the Australian state of Queensland. It is the world’s largest coral reef ecosystem and is listed on the register of World Heritage sites. The terrestrial (Great Barrier Reef Catchment Area) and marine (the Reef) ecosystems provide a number of benefits to humans through the generation and use of ecosystem services. The GBR Region consists of the GBR Marine Park along with the GBR Catchment Area, made up of six Natural Resource Management Regions (NRMRs), including Burdekin, Burnett Mary, Cape York, Fitzroy, Mackay Whitsunday and Wet Tropics.

Table 1. NRMR profiles, GBR region, 2011-2016

 NRMR Catchment Area20112016
Total PopulationPopulation densityAboriginal and Torres Strait Islander People %Total PopulationPopulation densityAboriginal and Torres Strait Islander People %
 sq km’000Person per sq km% of total000’Person per sq km% of total
Burdekin135 251222.11.67.1232.61.77.9
Burnett Mary55 612301.15.43.7316.95.74.4
Cape York101 72113.80.154.915.40.255.4
Fitzroy157 834227.81.44.8235.51.55.6
Mackay Whitsunday9 264131.514.24.1136.714.84.8
Wet Tropics20 861237.411.410.2253.312.110.1
Total GBR Region480 5591 133.62.46.61 190.42.57.2

NRMRs are meshblock approximations of the Department of the Environment and Energy's Natural Resource Management regions to align with Australian Statistical Geography Standard.
Source: Terrestrial Extent and Condition section, 2011 Census of Housing and Population and 2016 Census of Housing and Population.
 

This publication uses the System of Environmental-Economic Accounting: Experimental Ecosystem Accounting (SEEA-EEA) international framework to integrate and track changes for complex biophysical data, economic data and other human activity. As an example, a key finding of this publication is the determination of ecosystem services input and tourism rent using a resource rent methodology. These estimate the value an ecosystem contributes to production after human inputs (such as labour, taxes, capital costs) are accounted for. Ecosystem services inputs were calculated for the Agriculture, Forestry, Fishing and Aquaculture industries and tourism rent was calculated for tourism activity.

Condition summary

A summary of the condition of the GBR Region from 2007-08 to 2014-15 is shown in Table 2.

Table 2. Ecosystem condition summary, GBR region, 2007-08 to 2014-15

 Units2007-082008-092009-102010-112011-122012-132013-142014-15
Marine condition (inshore)
 Coral (a)Score4748474338394044
 Seagrass (a)Score3533282119283433
 Water Quality (a)Score4744443137373443
Climate
 Mean annual sea surface temperature (b)Degrees Celsius24.725.025.724.524.925.124.925.2
 Mean annual sea surface temperature anomaly (b)Degrees Celsius-0.270.300.53-0.38-0.160.12-0.110.24
 Mean annual rainfallmm1 0701 0909461 6331 100903869760
Pollutant Loads in selected monitored areas (c)
 Total Suspended SolidsKilotonnes18 788.012 639.06 889.819 647.05 532.09 559.01 243.32 074.6
 Total NitrogenKilotonnes57.636.929.3101.027.533.710.18.9
 Total PhosphorusKilotonnes16.29.29.232.07.79.31.52.5

a. Marine condition scores were sourced from the Reef Water Quality Protection Plan, Great Barrier Reef Report Card series (2015 issue).
b. Mean annual sea surface temperature and mean annual sea surface temperature anomaly are reported in calendar years from 2008 to 2015. These measures were sourced from the Bureau of Meteorology, eReefs Marine Water Quality Dashboard, Commonwealth of Australia.
c. Pollutant loads were sourced from the Department of Science, Information Technology and Innovation, Queensland Government.
 

Marine

Terrestrial

Biodiversity

Ecosystem services

Expenditure of environmental goods and services

Tourism

Fishing and aquaculture

Water

Carbon

Marine extent and condition

The SEEA-EEA defines ecosystem assets as 'spatial areas containing a combination of biotic and abiotic components and other characteristics that function together' (para 4.1 SEEA-EEA). Ecosystem assets can be measured in terms of extent and condition as well as expected ecosystem service flows. This section presents marine use and condition accounts for the Great Barrier Reef marine area (the Reef), using detailed information from the Great Barrier Reef Report Card series, the Bureau of Meteorology (BoM) and the Australian Institute of Marine Sciences (AIMS). The Great Barrier Reef (GBR) provides economic and community benefits in the form of tourism, employment, cultural services (tourism and participation in cultural activities) and provisioning services (aquaculture, fish, etc.). Marine condition is likely to impact the future economic and community benefits provided by this unique ecosystem.

Asset

While an asset account is not presented for the Reef marine area, the following areas were reported by the Great Barrier Reef Marine Park Authority (GBRMPA) in 2013 for the extent of marine assets:

  • Mangroves - 2,070 km²
  • Seagrass meadows
    • Shallow (<15m from surface) - 5,700 km²
    • Deep (>15m from surface) - 40,000 km²
  • Coral reefs - 26,000 km²
  • Lagoon floor - 210,000 km²
  • Shoals - 278 km².
     

Marine use

A marine use account, analogous to the land use accounts, was developed using zoning data from the GBRMPA. Zoning offers insights into the various uses of the marine area, in lieu of the more detailed information available for terrestrial areas which can be compiled into land accounts. The Great Barrier Reef Marine Park Zoning Plan 2003, which came into effect on 1 July 2004, was enacted to improve protection for the biodiversity within the park. The plan helps 'to ensure that a diverse range of other benefits and values of the Marine Park, including recreational, cultural, educational and scientific values are protected' (Zoning, Permits and Plans, GBRMPA).

Table 1 below sets out the area of each zone type before and after 1 July 2004, while Figure 1 displays the current zoning in a map. The 2004 re-zoning resulted in a large decline in the amount of area classified as 'General Use', with large increases in the area of 'Habitat Protection' and 'Marine National Park'. Data on uses within the Marine Park are present in other sections. The Fishing and Aquaculture section presents information on commercial fishing within the GBR Region and the Tourism section presents data on visits to the Marine Park, including Environmental Management Charge information.

Table 1. Marine zoning (use) account, GBR marine park, at 01 July 2004

Zone TypeOpening Area pre 2004 Rezoning sq kmNet change in AreaClosing Area post 2004 Rezoning sq km
Preservation Zone344344688
Marine National Park15 84298 843114 685
Scientific Research34310344
Conservation Park3449 6439 988
Buffer2 0663 1005 166
Habitat Protection52 34944 77197 120
General Use268 288-157 012111 276
Total GBR Marine Park339 2680339 268

sq km - square kilometres
Source: Table 6.4 Changes in Zone Area following 2004 Rezoning, GBRMPA, 2009, p.126.
 

Figure 1. GBR marine park zoning, 2004 - present

Figure 1. GBR marine park zoning, 2004 - present
Image of a map showing the Great Barrier Reef Marine Park zoning, 2004 to present. The map shows the area of Queensland containing the Great Barrier Reef Marine Park boundary, Indicative Reef boundary, Great Barrier Reef Catchment boundary, Towns, Natural Resource Management Region, Mainland and Islands. Within the Great Barrier Reef Marine Park boundary the map shows the zones of; general use, habitat protection, Conservation Park, buffer, Scientific research, Scientific research (closed to public access), Marine National Park and Preservation. Map projection: Unprojected Geographic Horizontal Datum: Geocentric Datum of Australia, 1994 Data source: Department of Natural Resource and Mines (Natural Resource Management Regional boundaries clipped to the Great Barrier Reef Catchment) August 2017

Source: Great Barrier Reef Marine Park Authority (GBRMPA)

Marine condition

For the purpose of this section marine condition was established using the following key characteristics of the Marine Park ecosystems:

  • Water Quality
  • Coral
  • Seagrass
  • Fish Abundance.
     

Data on these characteristics were retrieved from a variety of sources.

Water quality

Coral

Seagrass

Fish abundance

Marine condition drivers

Sea surface temperature

Severe weather events

Crown-of-thorns starfish

Footnotes

Terrestrial extent and condition

The Terrestrial Extent and Condition section presents information on the extent and condition of the terrestrial landscape of the Great Barrier Reef (GBR) Catchment Area through the use of land accounts and river loads data.

Land account

River loads

Pesticide loads

Biodiversity

For the state of Queensland, all threatened fauna experienced a shift from having more species in the least threatened categories to having more species in the most threatened categories. For example, the number of Endangered species rose from 59 to 67 species while Near Threatened species decreased from 146 to 35 species.

For threatened species in the Great Barrier Reef (GBR) Region, there were four extinctions and ten new species described between 1994 and 2017. Birds and Reptiles had little overall movement between threat categories; Mammals saw four extra species added to the Vulnerable category, Fish saw two species added to the Endangered category, and Invertebrates saw three species added to the Endangered category. Frogs fared worst of all with ten species added to the Endangered category, one species to the Vulnerable category and five species to the Near Threatened category. The primary threat to each faunal group was habitat loss and degradation; other key threats across all groups were feral species and climate change.

Biodiversity is the variety of plant and animal life in a particular habitat, the different plants, animals and micro-organisms, the genetic information they contain and the ecosystems they form. Threatened species accounts can be used as an indicator of biodiversity in the broader ecosystem accounting context.

The Great Barrier Reef Biodiversity Strategy 2013 and Great Barrier Reef Vulnerability Assessment 2007 both looked specifically at the vulnerability and status of key species and species groups in the GBR Marine Park.

For the following summaries and species accounts of threatened species in the GBR Region, the differing threat categories used in state, national and international listings were broadly concorded to form a new set of categories for the purpose of comparison between the three geographical scales of the contributing datasets. The International Union for the Conservation of Nature (IUCN) Red List of Threatened Species (hereafter the ‘Red List’) is used for international listings of threatened fauna, the Commonwealth Environmental Protection Biodiversity Conservation Act 1999 (hereafter the ‘EPBC’) for national listings, and the Queensland Nature Conservation Act 1992 (hereafter the ‘NCA’) for state listings.

Table 1 presents a broad alignment of the categories from the three lists, from the most severe listing (grouped together as the revised category of ‘Extinct’) to species either being considered as of 'least concern' or not listed at all (grouped together as ‘Not listed’). Species in scope are those deemed threatened according to the NCA, with a distribution range within the GBR Region. Therefore species deemed threatened by either the EPBC or the Red List, but not by the NCA, were not considered.

Table 1. Concorded categories for threatened fauna

NCAEPBCRed ListRevised category
Extinct in the WildExtinct Extinct in the WildExtinct Extinct in the Wild Regionally ExtinctExtinct
EndangeredCritically Endangered EndangeredCritically Endangered EndangeredEndangered
VulnerableVulnerableVulnerableVulnerable
Near ThreatenedConservation DependentLower Risk Near ThreatenedNear Threatened
Least Concern (unlisted)(unlisted)Data deficient Least Concern (unlisted)Not listed


Graph 1 provides a snapshot comparison between state, national and international listings of species considered threatened for frogs, reptiles, birds, mammals and invertebrates, illustrating the reporting discrepancies between each of the lists.

Graph 2 depicts changes for all Queensland faunal listings, from 2007 to 2015, and shows a shift from more species in the least threatened categories to more species in the most threatened categories. The number of species in the Near Threatened category decreased from 146 in 2007 to 35 to 2015, while the number of species in the Vulnerable category increased from 79 to 129 over the same period, and the number of species in the Endangered category increased from 59 to 67.

Source(s): State of the Environment, Department of Environment and Heritage Protection, Queensland Government.

Threatened species accounts

Species accounts are often used as an indicator of biodiversity in ecosystem accounting. For this publication, threatened bird, reptile, mammal, fish and invertebrate species accounts have been prepared for the GBR Region. Species have not been separated into terrestrial and marine groups due to the difficulties separating species that inhabit both zones, such as species found in estuaries, or species that use different ecosystems depending on their life cycle stage.

Species accounts enable understanding of movement between threat categories between two points in time (for example the number of species moving from a category of Endangered to Vulnerable). The threatened species accounts contained in this release present these changes according to additions and reductions for each threat category (Extinct, Endangered, Vulnerable, Near Threatened, Not Threatened and Not Listed) between 1994 and 2017.

These accounts have been created for each key faunal group (for which data exists) in the GBR Region; they are based on the list of threatened species in the NCA, but fauna unsuitable for inclusion have been omitted. For example, the Percy Island Flying Fox has been omitted due to unclear taxonomic status and an uncertain identification of the specimen used to describe the species. Please refer to the Methodology for more details on omitted species. However, when a species falls into the category of Not Listed, this indicates that it appears on the NCA threatened species list but not on the Red List; for example, the Kroombit Tree Frog is listed as Endangered by the NCA, but is not currently on the Red List.

For some threatened fauna there may be a lag in the detection of significant population declines. Sometimes there is a delay between when a species has been subject to significant threatening processes and when the subsequent extinction of that species resulting from the impact of this occurs; this is termed extinction debt. Species most vulnerable to extinction debt are usually long-lived species or species with specific habitat requirements. For example, individual animals may live for a long time without reproducing successfully, perhaps due to unsuitable breeding habitat, and the population would appear to be healthy; however, when those individuals die, the population suddenly experiences an irreversible downturn. Therefore, extinction debt should be taken into consideration when viewing threatened species accounts, as such accounts may take time to accurately reflect the true status of threatened species.

Birds

Mammals

Fish

Reptiles

Frogs

Invertebrates

Employment and business profile of the GBR region

The Reef 2050 Long-Term Sustainability Plan divides economic activity in the Great Barrier Reef (GBR) Region into “reef-dependent” and “reef-associated” activities. Reef-dependent activities include activities such as fishing and tourism, which are covered in detail elsewhere in this publication. Reef-associated industries are other economic activities which due to their proximity and nature, can impact on the Reef, but do not directly depend on the Reef.

Some industries can impact the Reef due to their potential to degrade conditions in the Marine Park, either directly via runoff of pollution into the reef, or indirectly through their influence on the health and filtration capacity of terrestrial ecosystems. Among the activities of potential concern are agriculture, mining, manufacturing, construction, ports and shipping, and wastewater management. This publication does not identify a specific, prescriptive list of reef-associated industries.

Most economic activities in the GBR Region are not directly “reef-dependent”. Other sections of this publication focus on specific industries that rely on terrestrial or marine ecosystem services. This section focuses on available small-area information to profile the economy of the region as a whole, with a focus on jobs and employee income. For all topics covered in this section, data cubes are available with more comprehensive tables, in the Data downloads section of the publication.

Industries in the GBR region

Recent trends in regional employment

Mining in focus

Aboriginal and Torres Strait Islander peoples

There are more than seventy Aboriginal and Torres Strait Islander Traditional Owner groups that have long continuing relationships with the Great Barrier Reef Region and its natural resources. The groups that express connections to the Great Barrier Reef Marine Park are situated along the Queensland coast, from the Torres Strait Islands in the north, to near Bundaberg in the south. Traditional Owners and their continuing connection to their sea country play an integral role in the health of the Great Barrier Reef (GBR). The engagement of Traditional Owners in the management of the GBR and its biodiversity reflects and recognises past generations of Aboriginal and Torres Strait Islander peoples for whom nature is inseparable from cultural identity. This section includes information on Aboriginal and Torres Strait Islander peoples' participation in economic activity within the GBR Region and participation in cultural activities associated with the Reef.

We recognise the Traditional Owners of the Great Barrier Reef Region as custodians of these lands and acknowledge their management of and connection to the region's land and sea.

Economic participation

Cultural services

Expenditure on environmental goods and services

Environmental goods and services include a wide range of economic products that are used with the intent of protecting the environment or maximising the efficient use of resources. The Australian, Queensland and Local Governments have all undertaken expenditure in support of protection and management activities within the Great Barrier Reef (GBR) Region. Private industry and households have also contributed to expenditures to protect the GBR Marine Park (the Reef). The range and extent of expenditures on environmental goods and services reflect various public policies and initiatives intended to protect and enhance the Reef. Data on these expenditures are therefore an important complement to data on the condition of the Reef, as both sets of data are required to assess the success of public policies and initiatives.

Environmental goods and services statistics provide: indicators of the production of environmental goods, services and technologies; the contribution of this production within the economy as a whole; and the extent of related employment and investment (SEEA-CF, para 4.93).This publication tests the application of accounting for environmental goods and services and aligns its data outputs to the objectives and targets for investment as described in the Reef 2050 Long-Term Sustainability Plan (the Plan). These are as follows:

  • EBO3: Reef-associated industries are planned and managed in such a way as to protect the Reef’s Outstanding Universal Value and are sustainable, productive and profitable.
  • EBO4: Reef-dependent industries are productive and profitable based on a healthy Reef and are ecologically sustainable.
  • EBT5: The relationship between Reef health and the viability of Reef-dependent Industries (e.g. tourism and fishing) is understood and considered in planning and development decisions.
  • WQO1: Over successive decades the quality of water entering the Reef from broadscale land use has no detrimental impact on the health and resilience of the Great Barrier Reef.
  • WQO2: Over successive decades the quality of water in or entering the Reef from all sources including industrial, aquaculture, port (including dredging), urban waste and stormwater sources has no detrimental impact on the health and resilience of the Great Barrier Reef.
     

Table 1 presents expenditures on Environmental Goods and Services aimed at protecting the Reef, by type of good or service, as reported in the Reef 2050 Plan - Investment Baseline (footnote 1). Local government was the largest contributor to these expenditures, accounting for $229 million (46% of total), followed by the Australian government with $145 million (29% of total), Queensland government $78 million (16% of total) and non-government sources $41 million (8% of total). Please note that for local government and non-government sources, these are estimates only.

Table 1. Expenditure on environmental goods and services in the GBR region ($m), 2014-15

Environmental goods and servicesAustralian GovernmentQueensland GovernmentLocal GovernmentNon-governmentTotal
Environment specific services (a)110.167218.911.7403.8
Integrated technologies (b)31.8112.633.578.9
Sole-purpose products (c)nanananana
Adapted goods (d)nanananana
End-of-pipe technologies (e)nanananana
Total environmental goods and services expenditure (f)145.478228.941.3493.6
Intermediate consumptionnanananana
Gross value addednanananana
Compensation of employeesnanananana
Gross fixed capital formationnanananana
Imports for environmental goods and servicesnanananana
Exports of environmental goods and servicesnanananana
Employment (thousands of people)nanananana

na – data not available.
Any discrepancies between totals and sums of components in this publication are due to rounding.
a. Environment specific services are environmental protection and resource management specific services.
b. Integrated technologies are technical processes, methods or knowledge used in production processes that are less polluting and less resource-intensive than the equivalent “normal” technology used by other national producers. Their use is less environmentally harmful than relevant alternatives.
c. Sole-purpose products are goods (durable or non-durable) or services whose use directly serves an environmental protection or resource management purpose and that have no use except for environmental protection or resource management.
d. Adapted goods are goods that have been specifically modified to be more “environmentally friendly” or “cleaner” and whose use is therefore beneficial for environmental protection or resource management.
e. End-of-pipe (pollution treatment) technologies are mainly technical installation equipment produced for measurements, control, treatment and restoration/correction of pollution, environmental degradation, and/or resource depletion.
Source: Reef 2050 Plan - Investment Baseline, June 2015, Department of the Environment and Energy, Commonwealth of Australia.
f. Data is an estimate only for Local Government (where some organisations reported expenditure data differently) and for Non-Government (where some organisations were unable to provide a complete response for inclusion in the baseline).
 

An estimated $79 million (16% of total expenditures) was allocated to ‘Integrated technologies’ or production processes to improve water quality in 2014-15. An example of this type of investment was, for example, on programs designed to promote best agricultural management practices. However, the majority of expenditures, $404 million (84% of total expenditures), addressed ‘Environment specific services’ related to the Reef. These services include such things as monitoring of catchment loads and Crown-of-thorns starfish control programs. 'Environment specific services' are intended for the purposes of protecting the environment and the efficient use of natural resources.

Footnote

Tourism cultural services

Tourism has become the largest economic activity in the Great Barrier Reef Marine Park (the Reef), and a major economic activity in the Great Barrier Reef (GBR) Region. A significant share of Tourism activity in the region is related to the Great Barrier Reef and natural features such as beaches, rivers and rainforests also feature prominently among the region's attractions.

Tourist expenditure is far higher in the Wet Tropics natural resource management region (NRMR) than elsewhere even though visit numbers are not proportionately higher. This reflects the status of Cairns as a major point of origin for marine tourism activity in the Reef, especially for international travellers.

Tourism and cultural ecosystem services

Tourism satellite accounts

Terrestrial tourism services

Marine park tourism

Fishing and aquaculture

Fishing and aquaculture are important economic and social activities in the Great Barrier Reef (GBR) Region. This section provides information on current structure and major trends in data on commercial, charter and harvest fishing, as well as aquaculture. While there is some data available on recreational fishing in the GBR Region, it is not included in this publication.

Commercial and harvest fishing within the GBR World Heritage Area is part of the East Coast Fishery area in Queensland. Fishing methods used include line, net, pot, otter trawl and beam trawl, along with various harvest methods. Species targeted in the area include Spanish mackerel, coral trout, sharks, crabs, scallops, bugs, barramundi, sea cucumber and aquarium fish.

Ecosystem services inputs significantly contribute to the value of fishing and aquaculture production, alongside human inputs such as labour and capital. This contribution includes the habitat for fish, breeding stock and water quality. Ecosystem services such as these are inputs into gross catch and to conditions required for aquaculture farms. This publication presents estimates of ecosystem value for the fishing and aquaculture industries, referred to as resource rent.

Fishing

Aquaculture

Agriculture and forestry

The Agriculture and Forestry industries are key components of the economy of the Great Barrier Reef (GBR) Catchment Area. The terrestrial ecosystem services that support the Agriculture and Forestry industries include the capture, storage, and cycling of soil water and nutrients and pollination. These contribute to the production and harvest of crops, fodder for livestock and generation of plantation stock. This section presents physical production and value of production for key agriculture and forestry outputs. Ecosystem services input is also presented, which estimates the monetary value of the ecosystem services provided for the production of outputs.

Agriculture

Forestry

Water

This section details the use of water by the agriculture industry in the Great Barrier Reef (GBR) Catchment Area. In 2014-15, the ABS Water Account, Australia (cat. no. 4610), showed that around 60% of water consumption in Queensland was by the agriculture industry – this proportion is estimated to be higher in the GBR Catchment Area because of the relative concentration of Queensland agricultural production in this region.

Graph 1 below shows average annual rainfall in the GBR Catchment Area from 2010-11 to 2015-16. It shows that recorded rainfall peaked during the extreme weather events in 2010-11 and decreased across subsequent years. Graph 2 shows that, in contrast, the use of irrigated water for agricultural activities in the GBR Catchment Area has increased steadily between 2010-11 to 2015-16, by an estimated 135%, from 773,979 ML in 2010-11 to 1,821,593 ML in 2015-16. This illustrates that farms have a greater need for irrigation when rainfall is low.

Graph 3 below shows the increase in water use in the GBR Catchment Area between 2010-11 and 2015-16 was mostly due to the increase in the Burdekin NRM region. Burdekin was the NRM which accounted for the largest proportion of water use in the GBR Catchment Area, representing 58% of water used for agricultural activity in 2015-16. Agricultural water use in the Burdekin region increased steadily from 2010-11 to 2015-16, from 395,868 ML to 1,049,465 ML, an increase of 165%. In 2015-16 the region received the lowest amount of recorded rainfall in the GBR Catchment Area (see Table 4.1 in the Data downloads section), explaining the higher use of irrigation water.

Graph 4 below displays the gross value of selected irrigated agricultural commodities for the GBR Catchment Area between 2010-11 and 2014-15. Sugar had the highest value of irrigated production, 32% of the total in 2014-15. The value of sugar production increased sharply after the 2010-11 cane crop was damaged in the flooding in 2010-11, from $365.4 million in 2010-11 to $634.6 million in 2011-12.

In 2014-15, sugar accounted for 69% of total water applied to agricultural activity and 90% of agricultural production by tonnage (see the Agriculture and Forestry section). After sugar, fruit and nut production had the next highest gross value of irrigated production with 28% of the total in the GBR Catchment Area in 2014-15.

Table 1 reports estimated water storage held in large urban and rural dams in the GBR Catchment Area. Of the recorded dams, the Fitzroy NRM region has the highest proportion of urban storage as of June 2016, representing 81% of total recorded urban storage in the GBR Catchment Area. In terms of rural storage the Burdekin NRM region recorded the highest share with 42% of the total for the GBR Catchment Area in 2016.

Between 30 June 2014 and 30 June 2016, holding of water in urban storages in the GBR Catchment Area decreased by 21%, while the holding of water in rural storages decreased by 8%.

Table 1. Water storage in large dams, by NRM region, GBR catchment area, 2014-2016

 201420152016
MLMLML
 Urban200 099101 06261 220
BurdekinRural1 865 2141 472 5371 865 214
 Urban39 65057 95045 750
Burnett MaryRural1 140 9051 311 1971 216 527
 Urbannanana
Cape YorkRuralnanana
 Urban685 167685 167618 981
FitzroyRural718 335881 422610 766
 Urbannanana
Mackay WhitsundayRural657 297532 844496 241
 Urban34 69834 69834 698
Wet TropicsRural415 739371 977240 691
 Urban959 613878 877760 649
Total GBRRural4 797 4904 569 9774 429 438

na not available
Source: Bureau of Meteorology.
 

Carbon

This section presents biocarbon stock accounts for the Great Barrier Reef (GBR) Region, estimating the amount of carbon stored in Australia’s terrestrial ecosystems in each year since 1989. The ability to store carbon in soil and vegetation (biocarbon) is referred to as a regulating ecosystem service, because the removal of excessive atmospheric carbon by storing it in the biosphere benefits the economy and society through climate regulation. This information can be combined with economic information to help shape priorities for the use of Australia’s land and marine assets.

To demonstrate this, the ABS presents analysis by the Department of the Environment and Energy on a biocarbon stock account for carbon stored in above ground biomass, below ground biomass, and harvested wood products within the GBR Region (note that offshore islands including the Torres Strait are in scope for this analysis). Greenhouse gas flows, atmospheric carbon stocks and geocarbon (fossil fuel) stocks are out of scope for this publication. Marine ecosystems also have significant capacity to store carbon as biocarbon, particularly seagrass meadows. There are no formal accounts for this storage capacity, and it is not considered in this report, however one estimate has found that seagrass meadows sequester carbon 35 times faster than rainforests.

The GBR Region held 2.8 Gt of biocarbon in the year ending June 2016 - this was a net decrease of 0.14 Gt from the 1989 reference year (Graph 1).

Source(s): Department of the Environment and Energy, Commonwealth of Australia

Graph 2, below, shows the year-to-year change of total biocarbon stocks. The rate of decrease in biocarbon stocks was very rapid between 1989 and 1997, but has slowed in recent years. This reduced rate of loss of biocarbon can be attributed to forest regrowth and slowing of losses from grasslands, resulting in net gain of forest carbon stocks from 2008 to present. Although forest carbon has increased, there has still been an overall net decrease of biocarbon stored in the GBR Region.

Source(s): Department of the Environment and Energy, Commonwealth of Australia

There are differences in vegetation communities’ capacity to store carbon. These differences relate directly to the area covered by each community and to the density of carbon stored above and below ground by that community. As shown in Graph 3 below, 'Forests' stored the greatest amount of carbon above and below ground, with a combined total of 2,134 Mt C (76%) in 2015-16, followed by 'Grasslands' and 'Mangroves', with 435 Mt C (15%) and 149 Mt C (5%) respectively. While 'Mangroves' only accounted for 5% of the total stored carbon in the region, they recorded the highest density, 687 tonnes per hectare, followed by 'Forests' with 108 tonnes per hectare being stored in the year ending June 2016. 'Grasslands' accounted for a large portion of the carbon stocks, due to its expansive land cover, rather than its carbon density.

In 2016, 68% of the total biocarbon was stored below ground in soil stocks.

  1. Forests are defined as being ≥2m in height and ≥20% canopy cover. Where a settlement or wetland is forested on this criteria, it is classified as a forest, unless it is a Mangrove;
  2. Grasslands also includes settlements and inland wetlands that are not also a forest. This includes areas of sparse woody vegetation that do not meet the forest definition;
  3. Mangroves are identified using the same height and canopy criteria for forests along coastal areas;
  4. Croplands includes areas of crop growth and excludes grazing areas that are not part of a rotaiontal cropping and grazing system. Above ground biomass includes perennial horticulture such as orchards, an biomass to account for transient crops such as sugarcane.;
  5. Tidal marshes are principally coastal wetlands that do not meet the definition of a forest.

Source(s): Department of the Environment and Energy, Commonwealth of Australia

The Department of the Environment and Energy included a special topic on biocarbon stocks in the GBR Region in their Quarterly Update of Australia's National Greenhouse Gas Inventory: March 2017.

Regulating ecosystem services

This section presents experimental estimates of regulating ecosystem services in the Great Barrier Reef (GBR) Catchment Area, by NRM region and type of regulating service.

Ecosystems have the capacity to regulate climate, hydrologic and biochemical cycles, earth surface processes, and a variety of biological processes. Where the regulating capacity of an ecosystem contributes to benefits used in human and other activity, a regulating ecosystem service has taken place (footnote 1). Ecosystems vary in both the types of regulatory functions carried out and capacity to carry out these functions. Regulating ecosystem services can vary significantly over time and between ecosystems. For example, a healthy wetland ecosystem has a greater capacity to provide water regulation services than an urban area.

Table 1 below describes some of the regulating services identified in the GBR Catchment Area and examples of benefits that potentially arise from these services.

Table 1. Regulating services and benefits obtained

Regulating serviceExamples of benefits
Erosion ProtectionReduced sediment loads in water and reduced deposition of downstream water basins.
Water quality/purificationCleaner water from pollution control, detoxification and waste assimilation.
Water regulationRestoring natural hydrological flows to allow groundwater recharge and discharge that support groundwater dependant ecosystems, such as wetlands.
Hazard reductionReduction of impacts against extreme natural events like drought, floods and storms.

Sources: SEEA-EEA 2012; Great Barrier Reef Marine Park Authority.
 

Experimental estimates contained in Table 2 (footnote 2) show scores that provide a comparison of each NRM regions' capacity to provide regulating services from pre-clear (pre-European) to 2009 (footnote 3). These scores quantify the capacity of each NRM region to deliver a suite of ecological processes that together represent an indicator of regulating services. Capacity has been measured at a regional level and on a scale of 0.0 (poor capacity) to 5.0 (highest capacity).

Table 2. Ecosystem capacity to provide regulating service, indicator score, by NRM region, GBR catchment area, pre-clear (pre-European) and 2009

Regulating Servicespre-clear Value2009 Value% Change
Erosion protection
 Burdekin3.51.9-46
 Burnett Mary4.12.2-46
 Fitzroy3.02.0-33
 Mackay Whitsunday4.12.7-34
 Wet Tropics4.12.7-34
Water quality/purification
 Burdekin3.11.7-45
 Burnett Mary3.52.2-37
 Fitzroy2.92.2-24
 Mackay Whitsunday3.62.7-25
 Wet Tropics3.62.6-28
Hazard Reduction
 Burdekin3.62.0-44
 Burnett Mary4.51.7-62
 Fitzroy3.62.0-44
 Mackay Whitsunday4.43.0-32
 Wet Tropics4.42.4-46
Water Regulation
 Burdekin3.91.8-54
 Burnett Mary4.21.9-55
 Fitzroy3.81.9-50
 Mackay Whitsunday4.22.9-31
 Wet Tropics4.12.5-39

Notes
Data were not available for Cape York.
Scores are measured on a scale 0.0 (poor capacity) to 5.0 (highest capacity)
Source: Great Barrier Reef Marine Park Authority, 2017
 

Changes in capacity arise from both changes in the extent and types of coastal ecosystems (estuaries, woodlands, etc.) and land use (conservation, urban areas, production grazing, sugar etc.) taking place within each NRM region. Figures 1 and 2 show these landscapes have changed over time. All NRM regions reported significant declines in regulating capacity for erosion protection, water quality, hazard protection and pollination between the period of pre-clear (pre-European) and 2009.

Figure 1. Coastal ecosystems, GBR catchment area, pre-clear and 2009

Figure 1. Coastal ecosystems, GBR catchment area, pre-European and 2009
Image of two comparative maps showing the Coastal ecosystems, Great Barrier Reef catchment area, pre-clear and 2009. The first image on the left shows the Pre-clear Coastal Ecosystems, Great Barrier Reef Catchment area and depicts the Estuaries, Freshwater wetlands, Forested floodplain, Grass and sedgelands, Health and shrublands, Woodlands, Forests, Rainforests, Non-remnant, Exposed Reef, Mainland and islands. The second image on the right shows the 2009 Coastal Ecosystems, Great Barrier Reef Catchment and depicts the Estuaries, Freshwater wetlands, Forested floodplain, Grass and sedgelands, Health and shrublands, Woodlands, Forests, Rainforests, Non-remnant, Exposed Reef, Mainland and islands.

Source: Great Barrier Reef Marine Park Authority

Figure 2. Land use, GBR catchment area, 2009

Figure 2. Land use, GBR Catchment Area, 2009
Image of a map showing the Land use, Great Barrier Reef Catchment Area, 2009. The image shows the 2009 Land Use Great Barrier Reef Catchment. Area north of Cooktown is 1999 Landuse Mapping. The map depicts the areas of; Conservation, natural environments (in wetlands), Forestry - production, Grazing natural vegetation, Intensive animal production, Intensive commercial, Intensive mining, Intensive urban residential, Production - dryland, Production, irrigated, Water - production ponded pastures, Water storage and transport, Exposed reef, Mainland and islands.

Source: Great Barrier Reef Marine Park Authority

Figures 1 and 2 above show that significant portions of 'Grazing natural vegetation' cover non-remnant vegetation areas of the catchment, but also that grazing takes place in areas that retain pre-European coastal ecosystems. This results in the nature of grazing activity and practices having a particularly significant influence over the regulating capacity of the catchment. Data on land use within the GBR Catchment Area is presented in the Terrestrial Extent and Condition section and shows that 32 million hectares are made up of 'Livestock Grazing' of the total 48 million hectares of the GBR Catchment Area. Users should note that this section and the Terrestrial Extent and Condition section use different classifications for land use and also for the NRM boundaries (refer to Methodology).

Estimating and communicating changes in ecological regulating capacity is important for understanding emerging environmental issues and for informing policy related to ecosystem health. It can be used to inform priorities on investment in land use and their management practices, and for ongoing monitoring of effectiveness of these investments.

In response to challenges facing the GBR Region, the Australian and Queensland governments have developed The Reef 2050 Long-Term Sustainability Plan (the Plan). The Plan presents actions to protect Reef values, health and resilience, while allowing ecologically sustainable development and use. A key element of the Plan is developing ecosystem resilience in the face of a variable and changing climate – for both marine and terrestrial ecosystems. To achieve this, the Plan outlines objectives and targets, including Water Quality Objective 1 and Water Quality Targets 1 and 2. In this context, metrics of regulating capacity related to erosion protection, water purification services, and hazard reduction within the landscape, provide important leading indicators of future changes to water quality and the health of the GBR Region.

Footnotes

Data downloads

Table 1. Summary of findings

Table 2. Marine extent and condition

Table 3. Terrestrial extent and condition (land account)

Table 4. Terrestrial extent and condition (river loads)

Table 5. Biodiversity

Table 6. Employment and business profile

Table 7. Aboriginal and Torres Strait Islander peoples

Table 8. Expenditure on environmental goods and services

Table 9. Tourism

Table 10. Fishing and aquaculture

Table 11. Agriculture and forestry

Table 12. Water

Table 13. Carbon

Table 14. Regulating ecosystem services

All data cubes

History of changes

Show all

About environmental-economic accounts for the Great Barrier Reef

The ABS is currently utilising data for this publication that are 'accounts ready' (much of which are already released to the public). This publication should be considered experimental, as improvements to methods and new data sources continue to become available. The ABS will be seeking input from key stakeholders with the intention of addressing issues and concerns in future updates. The ABS offers grateful thanks to those stakeholders and data providers that have already provided valuable input into this publication.

The Great Barrier Reef (GBR) is an Australian icon, listed in 1981 as a world heritage property on the basis of its natural outstanding universal value (OUV). Its natural beauty and representation of major stages in the Earth’s evolutionary history (including anthropogenic interaction with the environment) has prompted its recognition internationally as one of the most precious ecosystems on Earth (GBRMPA, 2014). Our expanding ability to measure the condition, economic activity and social aspects of the GBR supports better decision making for this important Australian region.

The GBR is managed under the Great Barrier Reef Marine Park Act 1975 (Cth) to provide for the multiple uses of the Reef where biodiversity and heritage values are protected, as well as the social and economic aspects of the environment.

The Great Barrier Reef World Heritage Area totals 348,000 km². The Great Barrier Reef Marine Park is slightly smaller at 344,400 km². The remaining 3,600 km² of the World Heritage Area falls under the jurisdiction of the Queensland State Government and includes islands, ports and other internal waters.

In April 2015, the ABS published an Information Paper: An Experimental Ecosystem Account for the Great Barrier Reef Region, 2015 (cat. no. 4680.0.55.001). This publication applied the principles of the United Nations endorsed System of Environmental-Economic Accounts: Experimental Ecosystem Accounts (SEEA-EEA) to the GBR Region for demonstration and learning.

The SEEA framework assures consistency with the System of National Accounts (SNA). Over time, the SEEA framework will assist stakeholders to assess how social, economic and environmental goals can be appropriately balanced. To this end, the ABS uses the SEEA to produce accounts that describe indicators of resource use and environmental intensity, indicators of production, employment and expenditure relating to environmental activities and indicators of environmental assets, net wealth, income and depletion of resources.

This publication extends the scope of the 2015 information paper to inform a wider range of environmental-economic issues. These issues are selected from those nominated in The Reef 2050 Plan or otherwise considered to be important to the region.

The additional accounts include; carbon stock accounts (biocarbon in the GBR landscape), marine water quality accounts, water use accounts and environmental goods and services statistics (investment by government, industry and households to protect the GBR while still achieving economic goals). The inclusion of these accounts has three main aims:

  • to increase the public value of statistics,
  • to demonstrably improve policy-makers’ ability to detect economic problems emerging from changes to environmental assets and
  • to demonstrate the ongoing ability of SEEA-compliant environmental-economic (including ecosystem) accounts to inform programs such as the Reef 2050 Plan.
     

For all topics covered in this publication, datacubes with more comprehensive tables in the form of Excel spreadsheets are available in the Data downloads section.

This publication includes experimental estimates that indicate the changing capacity of ecosystems to regulate water and air quality. Selected Reef 2050 Plan objectives, targets and environmental protection expenditure have been included, prepared in a SEEA-compliant manner and presented in time-series formats.

The ABS is committed to further engaging stakeholders on how best to meet data needs arising from issues emerging or existing within the GBR. Examples of possible future data additions include an analysis of mining impacts and further indicators related to environmental research activity in the region.

Please note the distinction between the following terms to describe the GBR used throughout this publication:

  • Great Barrier Reef Catchment Area (GBR Catchment Area) - describes the mainland terrestrial area lying adjacent to the GBR, comprising of six Natural Resource Management (NRM) regions: Burdekin, Burnett Mary, Cape York, Fitzroy, Mackay Whitsunday and Wet Tropics. These NRM regions are comprised of forty drainage basins which drain directly into the GBR lagoon.
  • Great Barrier Reef Marine Park (the Reef) - the GBR marine ecosystem. Boundaries of the GBR Marine Park were proclaimed under Subsection 31(1) of the GBR Reef Marine Park Act 1975 (Cth).
  • Great Barrier Reef Region (GBR Region) - describes the entire region, both terrestrial and marine.

Previous catalogue number

This release previously used catalogue number 4680.0

Back to top of the page