Small area demolition approvals

Preliminary data on the number of dwelling demolitions approved in New South Wales, Victoria and Queensland

Released
8/10/2020

Key statistics

  • There were 61,562 dwelling demolitions approved in New South Wales, Victoria and Queensland between the March 2016 quarter and the December 2019 quarter.
  • 59,403 dwelling demolitions approved were houses and 2,159 were other residential dwellings.
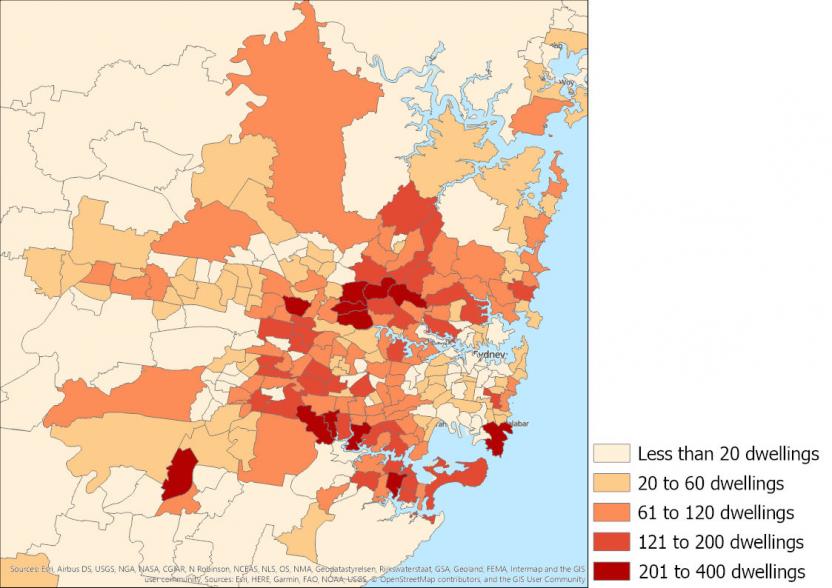
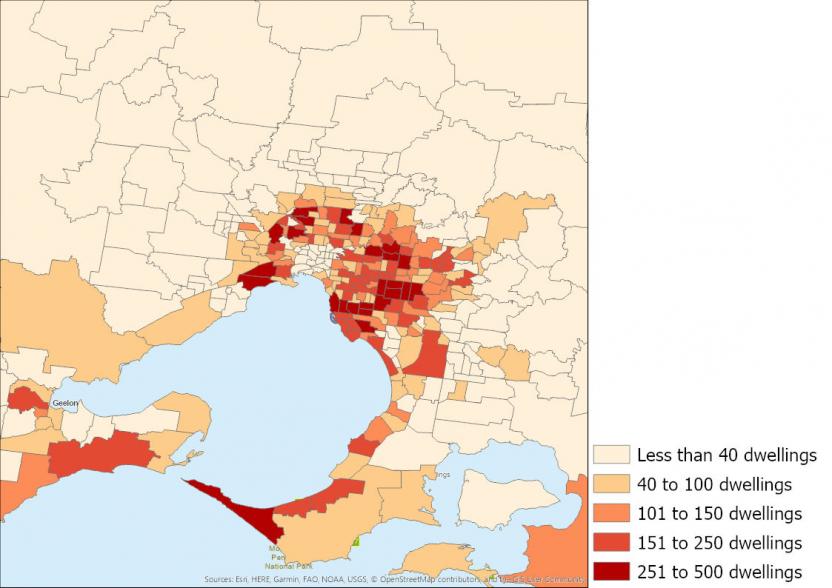
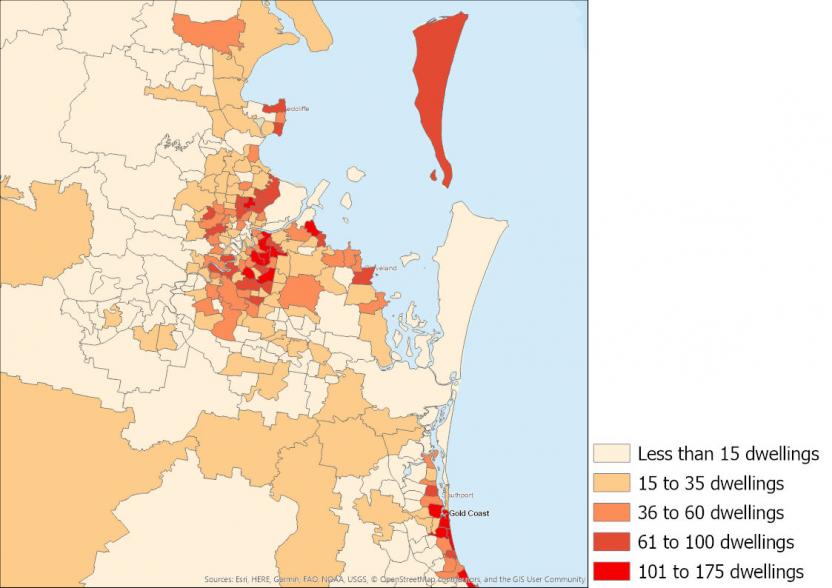
  • Victoria had the highest number of dwelling demolitions approved in this time period (29,986 dwellings), followed by New South Wales (21,390 dwellings) and Queensland (10,186 dwellings). 
  • The ratio of dwelling demolitions approved to new dwellings approved was 1:9 in Victoria, 1:12 in New South Wales and 1:16 in Queensland.

The falls in the number of dwelling demolitions approved in New South Wales and Victoria from the September 2018 quarter were consistent with similar falls in new houses and new townhouses approved (refer Graph 2).

Across the three states between 2016 and 2019, the ratio of dwelling demolitions approved to new dwellings approved was 1:11. Demolition approvals are relatively low for two primary reasons: greenfield residential developments require little-to-no demolition activity, and low-density dwellings are often demolished to make way for medium- and high-density residential buildings.

State results

New South Wales

Figure 1 shows the number of dwelling demolitions approved from 2016 to 2019 in New South Wales by Statistical Area Level 2 (SA2). Demolition activity is highest in the SA2s 10-20km from the Sydney city centre. 

Figure 1: Number of dwelling demolitions approved, New South Wales SA2s, 2016 to 2019

Map showing dwelling demolitions approved in New South Wales by SA2 between 2016 and 2019
Map showing dwelling demolitions approved in New South Wales by SA2 between 2016 and 2019. This data is available in the data downloads section.

The SA2 with the most dwelling demolitions approved in New South Wales between 2016 and 2019 was Ermington - Rydalmere (refer to Table 1). In this area, there were 370 dwelling demolitions approved, 366 of which were houses and 4 of which were other residential dwellings. The proportion of demolitions to new dwellings approved in this SA2 was 28.5%. 

Other SA2s with high numbers of dwelling demolitions approved were Panania - Milperra - Picnic Point (342 dwellings), Macquarie Park - Marsfield (291 dwellings) and Malabar - La Perouse - Chifley (288 dwellings).

Table 1: Highest number of dwelling demolitions approved, New South Wales SA2s, 2016 to 2019
HousesOther Residential (a)Total Dwelling DemolitionsNew Dwellings Approved (b)Demolitions % (c)
Ermington - Rydalmere36643701,30028.5%
Panania - Milperra - Picnic Point340234285739.9%
Macquarie Park - Marsfield322592912,79210.4%
Malabar - La Perouse - Chifley288028859048.8%
Claymore - Eagle Vale - Raby280028041567.5%
Epping - North Epping24702473,1477.8%
Oatlands - Dundas Valley236023647749.5%
Peakhurst - Lugarno222622862536.5%
Miranda - Yowie Bay22502251,56314.4%
Merewether - The Junction214922327481.4%

(a) Other Residential = Townhouses + Apartments
(b) This includes all new residential dwellings approved, not just those as a result of demolition
(c) Demolitions expressed as a percentage of new dwellings

The Local Government Area (LGA) with the most dwelling demolitions approved in New South Wales during the 2018-2019 financial year was Canterbury-Bankstown (refer to Table 2). In this area, there were 485 dwelling demolitions approved, 483 of which were houses and 2 of which were other residential dwellings. The proportion of demolitions to new dwellings approved was 26.6%. 

Other LGAs with high numbers of dwelling demolitions approved were Parramatta (372 dwellings), Cumberland (352 dwellings) and Sutherland Shire (329 dwellings). Of the top 10 LGAs, Randwick had the highest proportion of demolitions to new dwellings (76.3%), with 225 dwelling demolitions approved compared with 295 new dwellings approved.

Table 2: Highest number of dwelling demolitions approved, New South Wales LGAs, 2018-19
HousesOther Residential (a)Total Dwelling DemolitionsNew Dwellings Approved (b)Demolitions % (c)
Canterbury-Bankstown48324851,82326.6%
Parramatta36843724,0839.1%
Cumberland34663522,02617.4%
Sutherland Shire317123291,81418.1%
Georges River2471225969537.3%
Northern Beaches244424848950.7%
Newcastle23392421,13221.4%
Randwick223222529576.3%
Fairfield223022399422.4%
Liverpool16301632,6866.1%

(a) Other Residential = Townhouses + Apartments
(b) This includes all new residential dwellings approved, not just those as a result of demolition
(c) Demolitions expressed as a percentage of new dwellings

Victoria

Figure 2 shows the number of dwelling demolitions approved from 2016 to 2019 in Victoria by SA2. Demolition activity is highest 10-15km from the Melbourne city centre, and particularly concentrated in the city's inner eastern SA2s. 

Figure 2: Number of dwelling demolitions approved, Victoria SA2s, 2016 to 2019

Map showing the dwelling demolitions approved in Victoria by SA2 between 2016 and 2019
Map showing the dwelling demolitions approved in Victoria by SA2 between 2016 and 2019. This data is available in the data downloads section.

The SA2 with the most dwelling demolitions approved in Victoria between 2016 and 2019 was Bentleigh - McKinnon (refer to Table 3). In this area, there were 396 dwelling demolitions approved, 391 of which were houses and 5 of which were other residential. The proportion of demolitions to new dwellings approved in this SA2 was 26.7%. 

Other SA2s with high numbers of dwelling demolitions approved were Balwyn North (384 dwellings), Mount Waverley - South (360 dwellings) and Bentleigh East (North) (357 dwellings). 

Table 3: Highest number of dwelling demolitions approved, Victoria SA2s, 2016 to 2019
HousesOther Residential (a)Total Dwelling DemolitionsNew Dwellings Approved (b)Demolitions % (c)
Bentleigh - McKinnon39153961,48126.7%
Balwyn North384038461462.5%
Mount Waverley - South360036068952.2%
Bentleigh East (North)355235793938.0%
Heidelberg West296493451,33425.9%
Ashwood - Chadstone344034481942.0%
Mount Waverley - North341234357759.4%
Essendon - Aberfeldie327153421,20928.3%
Glen Waverley - West33623381,42223.8%
Pascoe Vale327103371,25326.9%

(a) Other Residential = Townhouses + Apartments
(b) This includes all new residential dwellings approved, not just those as a result of demolition
(c) Demolitions expressed as a percentage of new dwellings

The LGA with the most dwelling demolitions approved in Victoria during the 2018-2019 financial year was Monash (refer to Table 4). In this area, there were 595 dwelling demolitions approved, 589 of which were houses and 6 of were other residential. The proportion of demolitions to new dwellings approved was 24.8%. 

Other LGAs with high numbers of dwelling demolitions approved were Whitehorse (410 dwellings), Booroondara (383 dwellings) and Glen Eira (379 dwellings). Of the top 10 LGAs, Bayside had the highest proportion of demolitions to new dwellings (46.3%), with 331 dwelling demolitions approved compared with 715 new dwellings approved.

Table 4: Highest number of dwelling demolitions approved, Victoria LGAs, 2018-19
HousesOther Residential (a)Total Dwelling DemolitionsNew Dwellings Approved (b)Demolitions % (c)
Monash58965952,40224.8%
Whitehorse40824101,72323.8%
Boroondara37943831,17932.5%
Glen Eira368113791,45026.1%
Mornington Peninsula33223341,13229.5%
Kingston3171533275544.0%
Bayside3211033171546.3%
Moonee Valley305253301,07230.8%
Darebin299029993532.0%
Manningham275222971,53419.4%

(a) Other Residential = Townhouses + Apartments
(b) This includes all new residential dwellings approved, not just those as a result of demolition
(c) Demolitions expressed as a percentage of new dwellings

Queensland

Figure 3 shows the number of dwelling demolitions approved from 2016 to 2019 in Queensland by SA2. Demolition activity is highest in the SA2s surrounding the Brisbane city centre and the Gold Coast.

Figure 3: Number of dwelling demolitions approved, Queensland SA2s, 2016 to 2019

Map showing the number of dwelling demolitions approved in Queensland by SA2 between 2016 and 2019
Map showing the number of dwelling demolitions approved in Queensland by SA2 between 2016 and 2019. This data is available in the data downloads section.

The SA2 with the most dwelling demolitions approved in Queensland between 2016 and 2019 was Camp Hill (refer to Table 5). In this area, there were 164 dwelling demolitions approved, all of which were houses. The proportion of demolitions to new dwellings approved in this SA2 was 46.5%.

Other SA2s with high numbers of dwelling demolitions approved were Palm Beach (159 dwellings), Surfers Paradise (143 dwellings) and Tarragindi (134 dwellings).

Table 5: Highest number of dwelling demolitions approved, Queensland SA2s, 2016-19
HousesOther Residential (a)Total Dwelling DemolitionsNew Dwellings Approved (b)Demolitions % (c)
Camp Hill164016435346.5%
Palm Beach15181591,06814.9%
Surfers Paradise85581431,5579.2%
Tarragindi134013419768.0%
Morningside - Seven Hills1151312863820.1%
Mermaid Beach - Broadbeach83421252,0736.0%
Coorparoo115211741328.3%
Maroochydore - Kuluin105101151,7406.6%
Carina114011439728.7%
Mount Gravatt107210943025.3%

(a) Other Residential = Townhouses + Apartments
(b) This includes all new residential dwellings approved, not just those as a result of demolition
(c) Demolitions expressed as a percentage of new dwellings

The LGA with the most dwelling demolitions approved in Queensland during the 2018-2019 financial year was Brisbane (refer to Table 6). In this area, there were 1,111 dwelling demolitions approved, 1,078 of which were houses and 33 of were other residential. Brisbane also had the highest proportion of demolitions to new dwellings (15.0%).

Other LGAs with high numbers of dwelling demolitions approved were Gold Coast (379 dwellings), Sunshine Coast (186 dwellings) and Moreton Bay (158 dwellings). 

Table 6: Highest number of dwelling demolitions approved, Queensland LGAs, 2018-19
HousesOther Residential (a)Total Dwelling DemolitionsNew Dwellings Approved (b)Demolitions % (c)
Brisbane1,078331,1117,39715.0%
Gold Coast314653795,0127.6%
Sunshine Coast170161864,1064.5%
Moreton Bay15531584,1283.8%
Logan11721193,4393.5%
Redland8308371711.6%
Noosa5905947812.3%
Toowoomba410417535.4%
Ipswich350352,4691.4%
Mackay256313349.3%

(a) Other Residential = Townhouses + Apartments
(b) This includes all new residential dwellings approved, not just those as a result of demolition
(c) Demolitions expressed as a percentage of new dwellings

Methodology

About this release

The Australian Bureau of Statistics (ABS) is working towards the development of quarterly estimates of small area dwelling stock, completions and demolitions for release in 2022. Dwelling stock statistics (the total number of dwellings in a given area at a point in time) are currently available from the Census of Population and Housing every five years. More frequent estimates of dwelling stock are valuable for economic and housing policy development and evaluation, and informing planning and service provision decisions. The newly developed statistics will contain quarterly estimates of demolitions, completions and stock at Local Government Area (LGA) and Statistical Area 2 (SA2) level between June 2016 and June 2021. 

Removals from stock are currently a key data gap. To reduce this gap, this article presents preliminary data on the number of dwellings approved for demolition in New South Wales, Victoria and Queensland from the March 2016 quarter to the December 2019 quarter, by SA2 and LGA. The data has been sourced from the existing Building Approvals collection, and therefore only includes dwellings which have been approved to be fully demolished by a local council or approving authority (see 'Scope and coverage' for more information).

The data does not represent actual demolitions taking place (i.e. it does not account for demolitions that were approved but did not go ahead, or for the time lag between approval and actual demolition). The ABS is developing a method to estimate 'realised' demolitions (i.e. the dwelling approved for demolition is actually demolished) and investigating ways to account for other removals from stock that do not require approval (see 'Future work' for more information). 

Quarterly additions to stock (dwelling completions) are currently available at state level in the ABS publication Building Activity, Australia. The ABS is developing a method to model these estimates down to SA2 level. Experimental small area dwelling completions will be released with the June 2020 edition of Building Activity, Australia on October 14th.

The ABS is interested in receiving feedback from users on the suitability of this preliminary data and the potential for producing ongoing quarterly estimates beyond 2022. If you have any feedback, please email construction@abs.gov.au.

Scope and coverage

Approvals of dwelling demolitions have been sourced from the ABS' Building Approvals collection; a monthly administrative collection that compiles statistics of building work approved from;

  • permits issued by local government authorities and other certifying authorities;
  • contracts and work authorised by commonwealth, state and local government authorities; and
  • major building approvals in areas not subject to normal administrative approval, such as building on remote mine sites.

The statistics compiled from this collection are published monthly in Building Approvals, Australia and are classified to the Australian Statistical Geography Standard (ASGS), 2016 Edition.

The scope of the Building Approvals collection includes all residential building work valued at $10,000 or more and all non-residential building work valued at $50,000 or more and comprises;

  • construction of new buildings;
  • alterations and additions to existing buildings;
  • approved non-structural renovation and refurbishment work; and
  • approved installation of integral building fixtures.

For the purpose of collecting demolition approvals, the scope has been extended to include full demolitions of existing dwellings regardless of the value of the work. Approval authorities were formally requested to begin submitting demolition approvals to the ABS in July 2018. Where necessary, dwelling demolitions approved from 2016 onwards were also requested. 

ABS building statistics (building approvals, building activity and the dwelling stock series currently under development) classify buildings according to the Functional Classification of Buildings. This defines a dwelling as a self-contained suite of rooms, including cooking and bathing facilities intended for long-term residential use. Regardless of whether they are self-contained or not, rooms within buildings offering institutional care (e.g. hospitals) or temporary accommodation (e.g. motels, hostels and holiday apartments) are not defined as dwellings. This differs from the definition used by the Census (a structure which is intended to have people live in it, and which is habitable on Census night), which can include non-permanent structures such as caravans, houseboats and tents, as well as communal or transitory accommodation such as cabins, hotels, prisons and hospitals.

A dwelling demolition is defined as the complete and intentional dismantling of a dwelling, such that none of the structure remains on site. The scope of the data does not include:

  • dwellings demolished without approval;
  • dwellings partially demolished;
  • dwellings destroyed by natural disasters; or
  • dwellings rendered inhabitable by extreme weather events, vandalism, fire damage, modification etc. (except where approval has been granted for the demolition of the remainder of a damaged dwelling).

Data are presented for the following types of dwellings:

  • 'Houses' - defined as detached buildings used for long term residential purposes, consisting of only one dwelling unit and are not a result of alterations or additions to a pre-existing building.
  • 'Townhouses' - defined as semi-detached row or terrace houses attached in some structural way to one or more dwellings, with their own private grounds and no separate dwelling above or below.
  • 'Apartments' - defined as blocks of dwellings that don't have their own private grounds and usually share a common entrance, foyer or stairwell.

Data for new dwellings approved used in this article have been taken from the July 2020 edition of Building Approvals, Australia

Data quality

To assess the completeness of the demolition data, they have been confronted against expected demolitions based on dwelling stock figures from the Census, dwelling completions from Building Activity, Australia and approvals for new residential dwellings from Building Approvals, Australia

Expected demolitions were calculated based on inter-censal growth from 2011 to 2016 compared with the total number of dwellings completed across this time period, and the assumption that the proportion of demolitions to new dwellings approved is consistent from 2011 to 2019, as follows:

Expected Demolitions = ((Census 2011 Dwelling Stock + Dwelling Completions from Sep11 to Jun16 - Census 2016 Dwelling Stock) / New Dwellings Approved from Aug11 to Jul16) *  New Dwellings Approved from Jan16 to Dec19

The number of demolitions approved is similar to the number of expected demolitions at state level (refer Graph 5), indicating over-counts of 885 dwellings in New South Wales (4.3% of expected demolitions), 1,665 dwellings in Victoria (5.9%) and 29 dwellings in Queensland (0.3%).

While this can assist with assessing coverage of demolitions data in each state, there are some limitations of this analysis:

  • the calculation of expected demolitions assumes that the proportion of demolitions to approvals for new dwellings across 2011 to 2016 is the same as the proportion from 2016 to 2019
  • expected demolitions are subject to any existing errors in Census dwelling stock data (see Understanding Census Data Quality for further information), Building Activity dwelling completions data (see Building Activity Methodology) or existing Building Approvals data (see Building Approvals Methodology)
  • expected demolitions are a measure of expected actual demolitions, not expected demolition approvals (i.e. it does not account for demolitions that were approved but did not go ahead, or for the time lag between approval and actual demolition)
  • data on dwelling completions has been taken from September quarter 2011 to June quarter 2016 (i.e. inclusive of the month of July 2011 and exclusive of the month of July 2016), whereas Census figures are point in time measures taken on August 9th 2011 and August 9th 2016
     

Future work

The ABS is working towards producing experimental estimates of the number of dwellings demolished for all states and territories for release in 2021. This will involve:

  • working closely with local councils and state and territory government agencies to improve the quality and completeness of demolition approval information. Where this information is not available or not feasible to collect (i.e. some approval authorities have system limitations in collecting or reporting this information), the ABS will investigate statistical modelling methods and other possible auxiliary data sources to account for missing data or unapproved demolitions. 
  • developing a method to estimate the likelihood that a demolition approval is realised (i.e. the dwelling approved for demolition is actually demolished) and the time lag between demolition approval and actual demolition. Possible data sources that assess whether a demolition has occurred include commencements of new buildings from the Building Activity collection and aerial imagery. 

The ABS is also investigating data sources to capture other reductions in dwelling stock (i.e. dwellings destroyed in natural disasters). However, work so far has indicated that there are a number of logistical challenges associated with the collection of this data, and therefore they will be difficult to incorporate into quarterly dwelling stock estimates in a timely way. 

Data downloads

Data files
Back to top of the page