People moving into or out of employment or unemployment every month

Discusses the monthly movements between employment and unemployment and how they help to understand net changes in the Labour Force level estimates.

Released
15/06/2020

Changes in headline labour force estimates, such as the number of employed people, unemployed people and the unemployment rate, are important indicators of the overall changes in the labour market from month to month.

However, these often relatively small overall ‘net’ changes are based on extensive month-to-month changes, with a much larger number of people entering or leaving employment and unemployment every month.

This article uses labour force 'gross flows' data to highlight the extent of these changes (see footnote), and why they are an important complement to the headline level estimates in understanding underlying labour market activity. This is particularly important at a time of great change, such as the COVID-19 period, when considerable changes are expected to be seen between March and April.
Employment

Around 13 million people are currently employed, with the month-to-month net change in employment averaging around 25,000 over the last three years (in trend terms).

However, often from one month to the next:

  • around 400,000 people move into employment; and 
  • around 400,000 people move out of employment.

Most people who leave employment tend to move to being not in the labour force, rather than into unemployment (as they were not available to work and/or they had not started to actively look for work).

Similarly, there tends to be more people who move from being not in the labour force straight into employment, than move from unemployment to employment. This indicates that for many people who are not in the labour force, once they start looking for work and/or become available for work they quickly transition into working in a job.

Unemployment

Looking at these changes is particularly important when monitoring unemployment and understanding the experiences of unemployed people.

While the number of unemployed people has generally been around 700,000 each month for the last three years, and the monthly (absolute) change in unemployment has averaged around 4,000 (in trend terms):

  • generally around 300,000 people who are unemployed in one month are no longer unemployed in the following month; and
  • almost half of unemployed people in a given month will not have been unemployed in the previous month.

Of those moving out of unemployment each month, around half move into employment, while the other remain jobless (but are now classified as not in the labour force, as, for example, they have stopped looking for work and/or are no longer available for work).

Changes within employment: full-time and part-time

In addition to the month-to-month flows between employment, unemployment and not in the labour force, it is also important to consider the considerable dynamic change within the employed population that underpins net changes in full-time and part-time employment. For example, on average:

  • each month around 400,000 people move from being employed full-time to being employed part-time; and
  • around 400,000 from being employed part-time work to being employed full-time.

There are also additional people who can remain employed full-time from one month to the next, but who actually worked part-time hours in a given month (they are still classified as employed full-time, as they usually work full-time hours). 

Changes in the hours people work can reflect a range of factors (some related to business activity and others reflecting the individual circumstances of individuals). During the COVID-19 period information on people working reduced hours or not working any hours at all will be of increasing importance to labour market analysis, with information available from Labour Force, Australia, Detailed.

Labour Force ‘Gross flows’ data

More data on these month-to-month flows between employment, unemployment and not in the labour force (and full-time and part-time employment) are available monthly from the Labour Force Survey, in datacube GM1 – Labour force status and Gross changes (flows) by Age, Sex, State and Territory, February 1991 onwards in Labour Force, Australia.

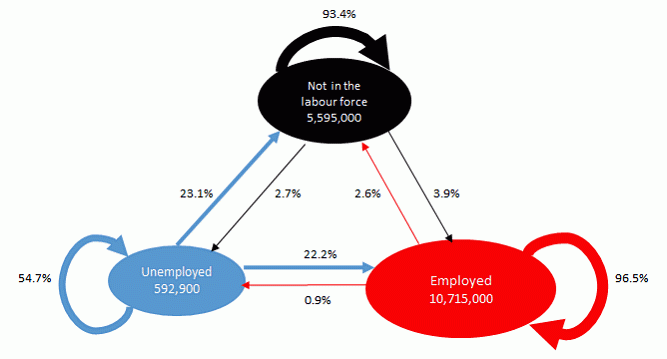
The following diagram shows the proportions of people moving between employment, unemployment and not in the labour force from February to March 2020, based on the “matched sample” data in the gross flows datacube (that is, households that responded to the Labour Force survey in both February and March 2020). While this means that the data is not drawn from the entire sample, it does provide a useful indication of the flows between the three labour force status categories.

This flow chart shows the proportions of people moving between employment, unemployment and not in the labour force from February to March 2020.

Footnote: The figures included in this article should be considered as approximate only, as they represent a simple 'scaling up' of the gross flows data to account for the gross flows being only based on the matched sample (around 80% of the total sample). This has been done to assist in a more direct comparison of the flows with the published monthly estimates of net change in employment and unemployment. This simple scaling up does not take into account weighting, population changes, or the unmatched part of the common sample, but is presented as a simple approach for users to be able to repeat in their own analysis.

Back to top of the page