Financing resources and investment table
| Non-financial corps | Financial corps | Government | Households | Total national | Rest of world | |||
|---|---|---|---|---|---|---|---|---|
| Financing resources | ||||||||
| Net saving (a) | 44.2 | 5.2 | 3.6 | 7.9 | 60.8 | -16.0 | ||
| plus Consumption of fixed capital | 57.6 | 3.7 | 14.6 | 45.9 | 121.7 | - | ||
| Gross saving | 101.8 | 8.9 | 18.1 | 53.8 | 182.6 | -16.0 | ||
| plus Net capital transfers | 0.3 | 0.0 | -1.7 | 1.3 | -0.1 | 0.1 | ||
| less Statistical discrepancy (b) | - | - | - | - | -1.6 | - | ||
| Total financing resources | 102.1 | 8.9 | 16.4 | 55.0 | 184.0 | -15.9 | ||
| Uses of financing (investment) | ||||||||
| Capital formation | ||||||||
| Gross fixed capital formation | 82.7 | 3.3 | 26.9 | 53.7 | 166.7 | - | ||
| plus Changes in inventories | -1.0 | 0.0 | 0.3 | 2.3 | 1.5 | - | ||
| plus Net acquisition of non-produced non-financial assets | 0.3 | - | -0.3 | - | - | - | ||
| Total capital formation | 82.0 | 3.3 | 26.9 | 56.0 | 168.2 | - | ||
| plus Financial investment | ||||||||
| Acquisition of financial assets | 28.2 | -80.2 | 4.6 | 62.5 | -115.5 | -125.1 | ||
| less Incurrence of financial liabilities | 41.2 | -103.8 | 32.4 | 35.8 | -125.1 | -115.5 | ||
| Net Financial investment (Net lending (+) / net borrowing (-)) | -12.9 | 23.6 | -27.8 | 26.8 | 9.6 | -9.6 | ||
| less Net errors and omissions | -33.1 | 18.0 | -17.4 | 27.8 | -6.3 | 6.3 | ||
| Total investment | 102.1 | 8.9 | 16.4 | 55.0 | 184.1 | -15.9 | ||
- nil or rounded to zero
(a) Net saving for the rest of world is the balance on the external income account.
(b) The statistical discrepancy is not able to be distributed among the sectors.
Financial market summary table
| Amounts outstanding, Sep-23 | Transactions, Dec-23 | Other changes, Dec-23 | Amounts outstanding, Dec-23 | ||
|---|---|---|---|---|---|
| Currency and deposits | |||||
| Currency | 104.7 | 2.1 | - | 106.8 | |
| Transferable deposits | 2,272.8 | 13.8 | -12.8 | 2,273.7 | |
| Other deposits | 1,603.2 | 26.0 | -6.5 | 1,622.7 | |
| Short term debt securities | |||||
| Bills of exchange | 6.3 | -0.2 | - | 6.1 | |
| One name paper | 554.5 | 41.1 | -6.3 | 589.3 | |
| Long term debt securities | |||||
| Bonds, etc. | 3,303.2 | 18.7 | 52.4 | 3,374.3 | |
| Derivatives | |||||
| Derivatives | 1,379.7 | -444.8 | 224.0 | 1,158.9 | |
| Loans and placements | |||||
| Short term | 417.6 | -17.1 | -3.2 | 397.4 | |
| Long term | 4,828.7 | 70.9 | -3.3 | 4,896.3 | |
| Shares and other equity | |||||
| Listed | 2,520.7 | -9.6 | 192.0 | 2,703.1 | |
| Unlisted | 6,031.2 | 61.0 | 89.1 | 6,181.3 | |
| Insurance technical reserves | |||||
| Reserves of pension funds and life | 3,295.1 | 22.7 | 120.2 | 3,438.0 | |
| General insurance payments | 160.4 | 4.3 | 0.0 | 164.7 | |
- nil or rounded to zero
Flow of funds diagrams
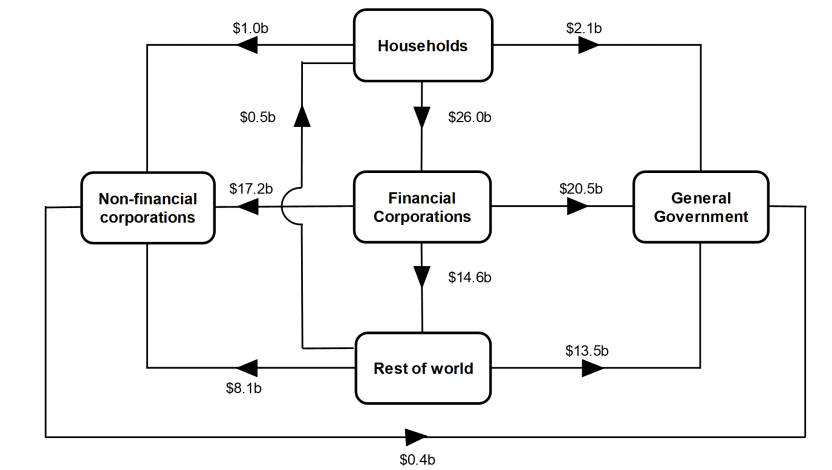
Net transactions during December quarter 2023
Image
Description
Financial corporations borrowed $26.0b from households. They lent $17.2b to non-financial corporations, $20.5b to general government and $14.6b to rest of world.
Household borrowed $0.5b from rest of world. They lent $1.0b to non-financial corporations and $2.1b to general government.
General government borrowed $13.5b from rest of world and $0.4b from non-financial corporations.
Rest of world lent $8.1b to non-financial corporations.
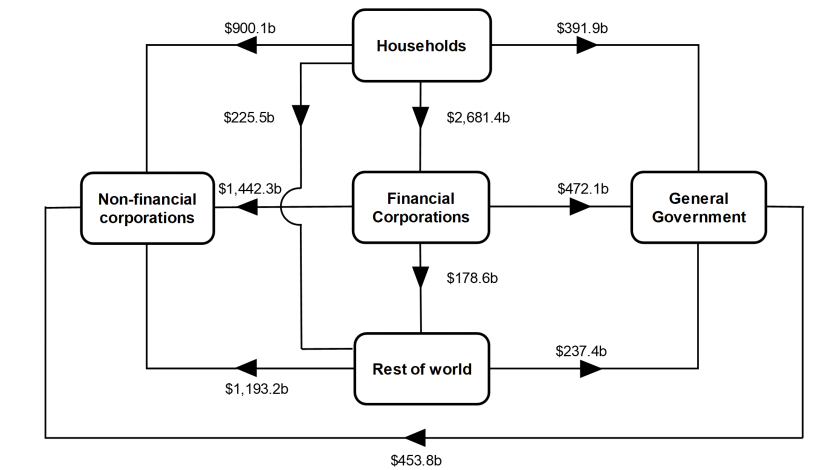
Amounts outstanding at end of December quarter 2023
Image
Description
Net claims on non-financial corporations were $1,442.3b from financial corporations, $900.1b from households, $1,193.2b from rest of world and $453.8b from general government.
Net claims on general government were $472.1b from financial corporations, $237.4b from rest of world and $391.9b from households.
Net claims on rest of world were $178.6b from financial corporations and $225.5b from households.
Net claims on financial corporations were $2,681.4b from households.
National investment
National investment increased by $11.3b to $168.2b in the December quarter.
- General government investment increased by $3.4b to $26.9b, driven by increases in gross fixed capital formation for both state and local general government and national general government.
- Non-financial corporations' investment increased by $2.0b to $82.0b, driven by an increase in gross fixed capital formation for private non-financial corporations and an increase in change in inventories for public non-financial corporations.
- Households' investment increased by $5.8b to $56.0b, driven by increases in change in inventories and gross fixed capital formation.
Financial investment
Australia was a net lender of $9.6b to rest of world (ROW). The main contributors were a:
- $24.4b acquisition by Australia of equity issued by ROW
- $6.2b placement of deposits with ROW
- Partly offset by $60.1b acquisition of debt securities by ROW
Acquisition of equity by Australia reflected merger and acquisition activity occurring over the quarter. Banks issued ONP and bonds offshore as they continued to raise addition funds following the maturity of the initial allowance of the Term Funding Facility (TFF). ROW also continued to acquire bonds issued by the National General Government (NGG).
Households
Households $26.8b net lending position was due to a $62.5b acquisition of financial assets, offset by $35.8b incurrence of liabilities. The acquisition of assets was driven by:
- $32.7b in deposits
- $27.2b in net equity in superannuation
While liabilities were driven by:
- $33.2b in loan borrowings
Deposit assets continued to grow this quarter with households taking advantage of higher interest rates offered on savings account products. Contributions into pension funds rose year on year reflecting legislative changes to compulsory superannuation on July 1 and strength in employment.
General government
General government’s $27.8b net borrowing position was due to $32.4b incurrence of liabilities, offset by $4.6b acquisition of financial assets.
Liabilities were driven by:
- $18.1b net issuance of bonds
- $16.0b in loan borrowings
Net issuance of bonds by general government was the strongest since June quarter 2022, reflecting a combination of the establishment of a new bond line by the national general government and no bond maturities. State and territory governments continued to borrow funds from their respective central borrowing authorities to meet expenditure for transport infrastructure and ordinary operating expenses.