|
INTRODUCTION
This publication presents the first release of counts of businesses sourced from the Australian Bureau of Statistics Business Register (ABSBR) using new statistical infrastructure. Users should be aware that ABS has since released a new business counts publication entitled, Counts of Australian Businesses, including Entries and Exits (cat. no. 8165.0). Users interested in business counts data are encouraged to refer to this more recent ABS publication to meet their data needs.
The ABS uses an economic statistics units model on the ABSBR to describe the characteristics of businesses, and the structural relationships between related businesses. Within large and diverse business groups, the units model is also used to define reporting units that can provide data to the ABS at suitable levels of detail. The units model can be used to produce counts of businesses from the ABSBR.
In mid 2002, to better use the information available as a result of The New Tax System (TNTS), the ABS changed its economic statistics units model. The new units model allocates businesses to one of two sub-populations. The vast majority of businesses are in what is called the Australian Tax Office maintained population (ATOMP), while the remaining businesses are in the Australian Bureau of Statistics maintained population (ABSMP). Please refer to the Explanatory Notes for more information about the ABS units model and the composition of the two sub-populations.
POPULATION
The 'in-scope' population for this publication comprises:
- live Type of Activity Units (TAUs) in the Australian Bureau of Statistics maintained population (ABSMP); and
- Australian Business Numbers (ABNs) in the Australian Tax Office maintained population (ATOMP) with at least one non-cancelled in-scope tax role.
Businesses classified to 'out-of-scope' Standard Institutional Sector Classification of Australia (SISCA) and Type of Legal Organisation (TOLO) categories are excluded from this publication. For a full list of SISCA and TOLO exclusions and further information about the scope and coverage of this publication, please refer to the Explanatory Notes.
ADDITIONAL DATA
Further data about counts of businesses sourced from the ABSBR can be purchased separately by contacting the National Information and Referral Service on 1300 135 070:
- Australian Bureau of Statistics Business Register, Counts of Businesses - Industry by Main State by Employment Size Ranges (cat. no. 8161.0.55.002)
- Australian Bureau of Statistics Business Register, Counts of Businesses - Postcode by Industry Division by Employment Size (cat. no. 8161.0.55.003)
COMPARISON WITH OTHER DATA ON BUSINESS COUNTS
These business counts are not comparable to previous business entity counts produced as at October 2000 and June 2001 (cat. nos. 1369.0.55.001, 8136.0.55.001 and 8138.0.55.001). Further details are provided in the Appendix.
The counts are also not comparable with data in ABS' latest publication, Counts of Australian Businesses, including Entries and Exits (cat. no. 8165.0). Further details are provided in the Explanatory Notes.
Estimates of the number of businesses operating in the Australian economy may be derived from a number of sources within the ABS or from non-ABS sources. They may relate to a point in time, or may be average annual data. These estimates will not always show the same results. Variations occur because of the differing data sources, differing definitions of a business and differing scope and coverage between surveys, as well as variations due to sampling and non-sampling errors.
The definition of employing/non-employing in the ABS can also vary according to collection methodology, data sources, and user requirements and uses.
Users comparing data from this publication with other ABS data should do so with care, as this publication relates to businesses (based on the ABS operational definition of a business) while some other ABS publications relate to business entities (for example Experimental Estimates, Entries and Exits of Business Entities, Australia cat. no. 8160.0.55.001), or exclude non-employing businesses or particular industries or sectors.
For further information, refer to the Information Paper: A Statistical View of Counts of Businesses in Australia (cat. no. 8162.0).
ACKNOWLEDGEMENT
ABS publications draw extensively on information provided freely by individuals, businesses, governments and other organisations. Their cooperation is very much appreciated; without it, the wide range of statistics published by the ABS would not be available. The ABS wishes to acknowledge the support the ATO has provided in compiling the statistics presented in this publication. Information received by the ABS is treated in strict confidence as required by the Census and Statistics Act 1905.
INQUIRIES
For further information about these and related statistics, contact the National Information and Referral Service on 1300 135 070 or <business.demographics@abs.gov.au>.
SUMMARY OF FINDINGS
At June 2004 the number of active businesses on the Australian Bureau of Statistics Business Register (ABSBR) was 3,015,318. Of the total number of businesses, 837,078 (28%) were employing, with 2,178,240 (72%) non-employing.
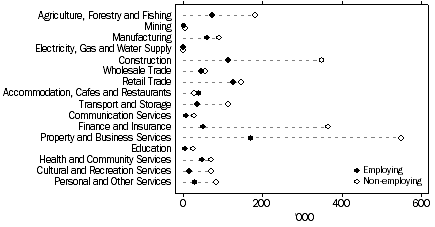
Property and Business Services had the greatest number of employing businesses with 171,182 (20%), followed by Retail Trade with 126,160 (15%) and Construction with 113,426 (14%). For non-employing businesses, the greatest number of businesses were in Property and Business Services with 549,650 (25%), Finance and Insurance with 366,677 (17%) and Construction with 348,814 (16%).
Industry Division by Employing/Non-employing, June 2004

The majority of employing businesses, 754,504 (90%) had between 0 and 19 employees. There were 77,656 (9%) businesses with 20 to 199 employees and 4,918 (1%) businesses with 200+ employees.
Of the total number of businesses, only 38,920 (1%) stated that they operate from locations in more than one state. Of these multi-state businesses, 25,922 (67%) operate from locations in only two states, while 4,507 (12%) operate from locations in all states and territories.
The total number of employing multi-state businesses was 15,976, with 1,793 (11%) of these businesses reporting 200 or more employees. In comparison, 3,125 (<1%) of employing single state businesses had 200 or more employees.
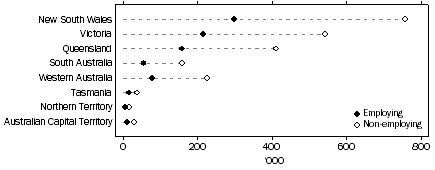
New South Wales had the largest number of businesses, with 1,054,176 (35%). Victoria was next with 756,763 (25%), followed by Queensland with 568,817 (19%). The lowest number of businesses were recorded in Australian Capital Territory and Northern Territory with 41,306 (1%) and 22,088 (<1%) respectively. Refer to paragraph 29 of the Explanatory Notes for a description of Main State.
Main State by Employing/Non-employing, June 2004

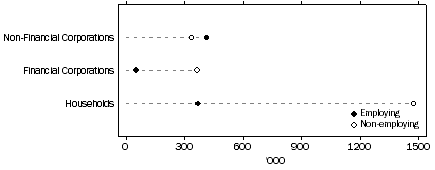
Of employing businesses, 414,635 (50%) were classified to the Non-Financial Corporations SISCA, followed by Households with 370,928 (44%). Financial Corporations accounted for 51,515 (6%) of employing businesses. For non-employing businesses, the largest number of businesses were in Households with 1,474,264 (68%), followed by Financial Corporations with 366,242 (17%) and Non-Financial Corporations with 337,734 (16%).
SISCA by Employing/Non-employing, June 2004

Sole Proprietorship with 1,162,183 (39%) was the most common form of legal structure, followed by Propriety Limited with 785,727 (26%) and Trusts with 531,706 (18%). |
 Print Page
 Print All