ABOUT THIS PUBLICATION
This publication presents the key results of the Tourism Satellite Account (TSA) for the years 1997-98 to 2002-03. Work on the TSA has been funded by the Department of Industry, Tourism and Resources (DITR).
REVISIONS IN THIS ISSUE
A new benchmark TSA has been produced for 2000-01. This has resulted in revisions to the estimates for the years 1997-98 to 2001-02. These revisions arise from the use of more up to date information for 2000-01 relating to a number of the tourism characteristic industries, including information on the relationships between input and output for those industries. In addition, estimates in respect of 1997-98 have been revised for the first time as a result of adopting revisions to the annual national accounts as reflected in the annual supply and use tables. A detailed description of the revisions is given at the end of the Summary Commentary section.
The economy wide national accounting aggregates for 1997-98 to 2001-02 have been revised to make them consistent with the 2002-03 issue of Australian System of National Accounts (cat. no. 5204.0).
DATA VALUES AND ROUNDING
All values, unless otherwise indicated, are shown in Australian dollars rounded to the nearest million. Where figures have been rounded, discrepancies may occur between the sums of the component items and totals.
INQUIRIES
For further information about these and related statistics, contact the National Information and Referral Service on 1300 135 070 or Dianne Bourke on Canberra (02) 6252 7243.
SUMMARY COMMENTARY
INTRODUCTION
A Tourism Satellite Account has been recognised internationally as the best method for measuring the economic contribution of tourism and as an important information base for the calculation of its economic effects. 'Tourism' is defined broadly in the international standards to include visitors whose primary purpose is private or government business, as well as the more familiar tourism for leisure purposes. The first official TSA for Australia was published in Australian National Accounts: Tourism Satellite Account 1997-98 (cat. no. 5249.0). This was followed by an update of the key results for three additional years to 2000-01 in April 2002, and an update for 2001-02 in April 2003. This current issue presents a time series from 1997-98 to 2002-03. The TSA project receives financial support from the Department of Industry, Tourism and Resources.
Tourism is not an industry in the traditional sense because industries are classified according to the goods and services that they produce, whereas tourism depends on the status of the consumer. A TSA partitions industries into tourism and non-tourism activities so that the direct contribution of tourism to the economy can be measured on a consistent basis with 'traditional' industries.
The TSA is compiled using a combination of visitor expenditure data from surveys conducted by the Bureau of Tourism Research, industry data from Australian Bureau of Statistics (ABS) collections and supply and use relationships in the Australian system of national accounts supply and use tables. Because the required industry collections are only conducted periodically, the compilation strategy is to produce a full-scale TSA 'benchmark' in those years coinciding with the availability of the industry collections (about every three years) and to extrapolate key results to other years using annual visitor expenditure data and the industry coefficients established in the latest benchmark year. This edition of the TSA presents a more comprehensive set of tourism information for 2000-01 than the previous two editions. The results for 2000-01 provide the new benchmark for extrapolating the estimates for subsequent years. The time series prior to 2000-01 have also been readjusted to the new benchmark.
The emphasis in the TSA is on the measurement of tourism consumption and the size of the tourism industry, including its contribution to gross domestic product (GDP) and employment. It puts tourism on a similar footing to other industries in the national accounts. It does not measure the indirect effects of tourism consumption on other industries. This is done using economic modelling by the Bureau of Tourism Research using the basic data provided in the TSA. The latest results are reported in the Tourism Research Report (Volume 5, No. 2 2004) Indirect Economic Contribution of Tourism to Australia, 2001-02.
Care should be taken in the interpretation of time series estimates between 1999-2000 and 2000-01. The introduction of the goods and services tax (GST) in July 2000 resulted in an increase in the current dollar value of tourism consumption and tourism GDP in 2000-01 even if the underlying volume of tourism services remained unchanged.
The concepts, sources and methods used in the TSA are described in Appendix 1 of the printed version of this publication.
KEY RESULTS
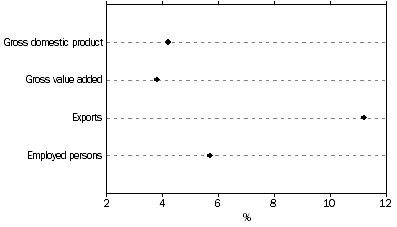
Tourism GDP represents the total market value of Australian produced goods and services consumed by visitors after deducting the cost of goods and services used up in the process of production. Tourism accounted for $32.0 billion of total GDP in 2000-03, an increase of $1.1 billion from 2001-02. The 3.6% growth in 2002-03 compares to a growth of 5.4% in total GDP in current prices.
The TSA does not present volume estimates so the growth rates in current prices referred to in this analysis also reflect the effects of price change. One way around this problem is to compare the tourism industry's share of GDP over time. The tourism industry share of GDP was 4.2% in 2002-03, which is the lowest share of GDP since the TSA was first compiled in 1997-98. This is the second annual decline since the share peaked in 2000-01. The high tourism share of GDP in 2000-01 was largely due to price increases in tourism services resulting from the introduction of the GST and the impact of the Olympic Games. Since that time, tourism activity has been impacted by world terrorism events and the ANSETT collapse in 2000-01, and the Bali bombings and the Severe Acute Respiratory Syndrome (SARS) scare in 2002-03.
Tourism share of the Australian economy - 2002-03
TOURISM INDUSTRY SHARE OF GROSS DOMESTIC PRODUCT |
|  |
 | 1997-98 | 1998-99 | 1999-00 | 2000-01 | 2001-02 | 2002-03 |  |
Tourism gross domestic product and associated statistics |  |
|  |
| Tourism gross value added at basic prices ($m) | 21,894 | 23,054 | 23,994 | 25,044 | 25,229 | 25,875 |  |
| plus Net taxes on tourism products ($m) | 3,048 | 3,213 | 3,321 | 5,817 | 5,637 | 6,110 |  |
| equals Tourism GDP ($m) | 24,942 | 26,267 | 27,316 | 30,861 | 30,865 | 31,985 |  |
| Gross domestic product(a) ($m) | 561,229 | 591,917 | 626,037 | 671,120 | 714,370 | 753,252 |  |
| Tourism share of gross value added(b) (%) | 4.3 | 4.2 | 4.2 | 4.1 | 3.9 | 3.8 |  |
| Tourism share of gross domestic product(b) (%) | 4.4 | 4.4 | 4.4 | 4.6 | 4.3 | 4.2 |  |
Percentage changes(c) |  |
|  |
| Tourism gross value added at basic prices | . . | 5.3 | 4.1 | 4.4 | 0.7 | 2.6 |  |
| Net taxes on tourism products | . . | 5.4 | 3.4 | 75.2 | -3.1 | 8.4 |  |
| Tourism GDP | . . | 5.3 | 4.0 | 13.0 | - | 3.6 |  |
| Gross domestic product | . . | 5.5 | 5.8 | 7.2 | 6.4 | 5.4 |  |
|  |
| . . not applicable |
| - nil or rounded to zero (including null cells) |
| (a) Source: Australian System of National Accounts, 2002-03 (cat. no. 5204.0). |
| (b) Only the direct tourism shares are included here. For an activity to be included as tourism, there must be a direct relationship between the visitor and the producer of the good or service. |
| (c) Percentage change on previous year. |
Industry gross value added measures the value of production exclusive of product taxes such as the GST. It is the preferred national accounts measure of the production of industries because it is free from distortions in prices caused by changes in tax rates or the introduction of new taxes over time. The tourism industry share of total industry gross value added in 2002-03 was 3.8%. This represents the lowest point in the series, having declined from its peak of 4.3% in 1997-98. The tourism industry share has declined because tourism gross value added has grown at a slower rate than gross value added for the whole economy.
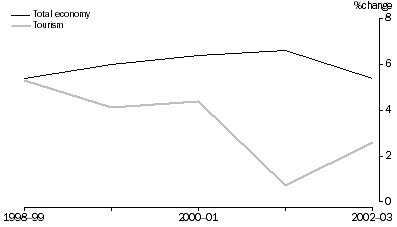
Tourism industry gross value added grew by 2.6% in 2002-03, compared with 5.4% for the whole economy.
Growth in industry gross value added, Current prices
Tourism contributes significantly to employment and Australia's exports. The tourism industry share of total employment declined slightly in 2002-03 to 5.7%, compared with a share of 5.9% in the years 1997-98 through 2000-01. Tourism contributed 11.2% of total exports of goods and services in 2002-03, the same proportion as for 2001-02.
Domestic visitors generated 77% of tourism industry GDP in 2002-03 while international visitors generated 23%. The international visitor share of GDP has declined slightly since 2001-02. International visitor numbers declined in 2002-03 because of uncertainty surrounding world terrorism events, Severe Acute Respiratory Syndrome (SARS) and a stronger Australian dollar against currencies of our major trading partners. These events have all contributed to tourists being more likely to travel within their own country rather than travelling abroad.
TOURISM INDUSTRY GROSS VALUE ADDED
In the 2000-01 benchmark, the industries which accounted for the largest share of tourism gross value added were Air and water transport (14.9%), Accommodation (11.1%), Cafes, restaurant and takeaway food outlets (10.0%), and Other retail trade (8.5%). These shares are very similar to those in 1997-98.
TOURISM GROSS VALUE ADDED, By selected industries |
|  |
 | 1997-98
| 2000-01
|  |
 | Tourism gross value added | Share of total value added | Tourism industry ratio | Tourism gross value added | Share of total value added | Tourism industry ratio |  |
 | $m | % pts |  | $m | % pts |  |  |
|  |
| Air & water transport | 3,211 | 14.7 | 65.0 | 3,727 | 14.9 | 67.1 |  |
| Accommodation | 2,400 | 11.0 | 89.5 | 2,775 | 11.1 | 90.1 |  |
| Cafes, restaurants & takeaway food outlets | 2,209 | 10.1 | 30.4 | 2,501 | 10.0 | 30.7 |  |
| Other retail trade | 2,079 | 9.5 | 8.4 | 2,124 | 8.5 | 7.8 |  |
| All other industries | 11,994 | 54.8 | 2.5 | 13,917 | 55.6 | 2.4 |  |
| Total | 21,894 | 100.0 | 4.3 | 25,044 | 100.0 | 4.1 |  |
|  |
INDUSTRY RELIANCE ON TOURISM DEMAND
The tourism industry ratio measures an industry's reliance on tourism demand. Industries have been defined as 'tourism characteristic' if 25% or more of their output is purchased by visitors.
The travel agent and tour operator services industry and the accommodation industry rely almost entirely on tourism demand and have tourism industry ratios of 97% and 90% respectively for both 1997-98 and 2000-01 benchmarks. Air and water transport has the next highest ratio at 65% in 1997-98, rising to 67% in the 2000-01 benchmark.
COMPARISON WITH 'NON-TOURISM' INDUSTRIES
Tourism contributed $25.9 billion to industry gross value added in 2002-03. When compared to the traditional industries by Australian and New Zealand Standard Industrial Classification (ANZSIC) division published in ABS statistics, the gross value added of the tourism industry ranks twelfth out of the seventeen industry divisions. Tourism gross value added exceeded that of Agriculture, forestry and fishing, Communication services, Personal and other services, Electricity, gas and water supply, Accommodation, cafes and restaurants, and Cultural and recreational services.
TOURISM CONSUMPTION
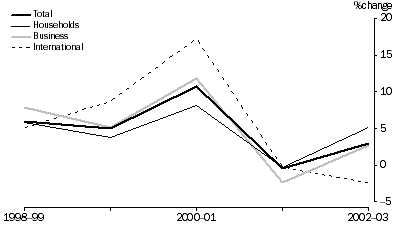
Total tourism consumption increased by 3% in 2002-03, recovering from a fall of 1% in 2001-02. This recovery occurred because domestic travel consumption continued to increase, even though consumption by international visitors declined. Tourism consumption by domestic households rose from $45.9 billion to $48.2 billion in 2002-03, an increase of 5.1%. Similarly, consumption by business and government rose from $8.2 billion to $8.4 billion, an increase of 2.7%. However, international visitor consumption declined from $17.1 billion to $16.7 billion, a decrease of 2.4%.
Domestic visitors contributed 77% of total tourism consumption in 2002-03 while the international visitors contribution was 23%. Of all domestic visitor consumption, households accounted for 87% and business/government accounted for 13%.
The bulk of domestic tourism consumption was by those visitors who stayed away overnight (78%), with day visitors accounting for the remainder (22%).
In 2002-03 Long distance passenger transportation represented the largest proportion of tourism consumption at 17%, followed by Shopping, including gifts and souvenirs (16%), Takeaway and restaurant meals (15%) and then Accommodation services (10%).
However, there are some marked differences in consumption patterns by type of visitor. Long distance passenger transportation is the dominant tourism product consumed by domestic business/government and international visitors. In contrast, domestic household visitor consumption is dominated by Takeaway and restaurant meals, and Shopping, including gifts and souvenirs.
SHARE OF TOURISM CONSUMPTION, Selected tourism products - By type of visitor - 2002-03 |
|  |
 | Households | Business/ government | International | All visitors |  |
 | % | % | % | % |  |
|  |
| Long distance passenger transportation | 8.4 | 39.6 | 28.9 | 16.6 |  |
| Shopping (including gifts & souvenirs | 19.3 | 0.3 | 13.2 | 15.7 |  |
| Takeaway & restaurant meals | 19.6 | 6.5 | 7.2 | 15.3 |  |
| Accommodation services | 6.6 | 20.9 | 13.5 | 9.8 |  |
| Food products | 9.6 | 0.7 | 6.8 | 7.9 |  |
| Fuel (petrol, diesel) | 7.2 | 16.8 | 1.1 | 6.9 |  |
| Taxi products | 0.4 | 3.0 | 0.7 | 0.8 |  |
| All other tourism products | 29.0 | 12.3 | 28.7 | 27.0 |  |
| Total | 100.0 | 100.0 | 100.0 | 100.0 |  |
|  |
Tourism consumption recorded its strongest growth in 2000-01, increasing by 10.7%. The growth in 2000-01 was affected by the impact of the introduction of the GST on prices. Growth in domestic tourism was strongest in services, which attracted tax for the first time. Also, consumption on recreation, culture and sporting services were particularly boosted by expenditure on Olympics tickets. The downturn in total visitor consumption during 2001-02 reflects a levelling in the impact of the GST combined with a slight reduction in tourism demand for goods and services following the Olympics.
Growth in tourism consumption
INTERNATIONAL TRADE IN TOURISM
Tourism makes an important contribution to Australia's export earnings. In 2002-03, international visitors consumed $16.7 billion worth of goods and services produced by the Australian economy. This represented 11.2% of the total exports of goods and services. While tourism exports grew quite strongly between 1997-98 and 2000-01, so did exports of other goods and services. However both tourism exports and total exports declined in both 2001-02 and 2002-03.
EXPORTS OF TOURISM GOODS AND SERVICES |
|  |
 | 1997-98 | 1998-99 | 1999-00 | 2000-01 | 2001-02 | 2002-03 |  |
|  |
| International visitor consumption ($m) | 12,792 | 13,445 | 14,610 | 17,140 | 17,081 | 16,666 |  |
| Total exports ($m) | 113,744 | 112,025 | 126,222 | 153,854 | 153,340 | 148,530 |  |
| Tourism share of exports (%) | 11.2 | 12.0 | 11.6 | 11.1 | 11.1 | 11.2 |  |
| Growth in international visitor consumption (%) | . . | 5.1 | 8.7 | 17.3 | -0.3 | -2.4 |  |
| Growth in total exports (%) | . . | -1.5 | 12.7 | 21.9 | -0.3 | -3.1 |  |
|  |
| . . not applicable |
Exports of tourism goods and services compare favourably with Australia's 'traditional' export products. For example, exports of tourism products are greater than coal, and iron, steel and non-ferrous metals, but less than food and live animals.
SELECTED EXPORT COMMODITIES, Percentage of total exports |
|  |
 | 1997-98 | 1998-99 | 1999-00 | 2000-01 | 2001-02 | 2002-03 |  |
 | % | % | % | % | % | % |  |
|  |
| Coal | 8.4 | 8.3 | 6.6 | 7.0 | 8.8 | 8.1 |  |
| Iron, steel, non-ferrous metals | 6.3 | 6.2 | 7.0 | 6.6 | 6.3 | 5.9 |  |
| Food and live animals | 14.1 | 13.8 | 13.4 | 13.5 | 14.6 | 12.4 |  |
| Tourism products and services | 11.2 | 12.0 | 11.6 | 11.1 | 11.1 | 11.2 |  |
|  |
| Source: International Merchandise Exports, Australia (cat. no. 5432.0.65.001) |
TOURISM EMPLOYED PERSONS
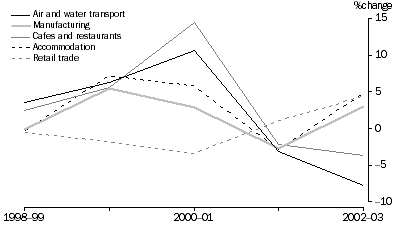
The tourism industry employed 540,700 persons in 2002-03. The number of tourism employed persons grew 6.3% between 1997-98 and 2002-03, slower than the growth rate in total employed persons (10.1%) over that period. Consequently, the tourism share of total employed persons fell from 5.9% in 1997-98 to 5.7% in 2002-03.
The tourism share of total employment is higher than the tourism share of industry gross value added. This is because tourism tends to be more labour intensive, on average, than other forms of economic activity.
Retail trade generated the most tourism employment. Retail trade, Accommodation, and Cafes and restaurants account for more than half of the employment generated by tourism.
Growth in employed persons, By selected industries
VISITOR TRIPS
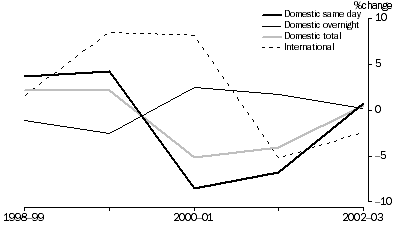
Trips by domestic visitors grew in 2002-03 by 1%. This follows declines in the previous two years of 5% and 4% respectively. This increase was driven by a rise in same day trips of 1%.
Short term international visitor arrivals to Australia peaked at over 5 million in 2000-01, but declined in 2001-02 and 2002-03 by 5% and 2% respectively. A combination of events have driven this decline over the last two years. A decline following the Olympics and world terrorism events had an impact in 2001-02 while Severe Acute Respiratory Syndrome and a strengthening in the Australian dollar against the currencies of our major trading partners had an impact in 2002-03.
Growth in visitor numbers
REVISIONS
For the first TSA benchmark in 1997-98, the core supply and use tables, additional industry data and tourism demand data were confronted in a supply and use framework. Because this is a lengthy and data intensive exercise it is not undertaken every year. All annual TSA updates have been produced using annual demand data from the Bureau of Tourism Research (BTR) and tourism industry estimates have been derived by extrapolating the relationships from the 1997-98 benchmark. The time series of estimates that were published in 2001-02 were based on these 1997-98 benchmark relationships.
The TSA methodology involves estimating a full benchmark every third year. The method for compiling benchmark estimates involves the use of fully balanced supply and use tables that underlie the national accounts. Also the latest industry data in respect of tourism related industries is incorporated. The statistics presented in this publication reflect the establishment of a new benchmark in respect of 2000-01.
In addition, the benchmark relationships established in 1997-98 have been reviewed and adjusted on the basis of revised 1997-98 supply and use tables. This has brought about some revisions to 1997-98 estimates.
As a result of now having two sets of benchmark data, the estimates for those years between 1997-98 and 2000-01 have been interpolated between the two benchmarks. Data for 2001-02 and 2002-03 have been extrapolated using the benchmark relationships from 2000-01 which has resulted in revisions to the 2001-02 estimates. Until a new TSA benchmark is applied in 2003-04, all TSA estimates for years out from 2000-01 will be produced using the 2000-01 relationships and annual demand data from the BTR.
Finally, a new supply and use product classification has been used in the 2000-01 benchmark, which required that estimates for previous years be re-adjusted to align with the new classification.
Compared to the estimates released in April 2003, the tourism share of GDP has been revised down across the time series. In 1997-98 the tourism share has been revised down by 0.1 percentage points to be 4.4% of total GDP, while in 2001-02 it has been revised down to be 4.3% of GDP. This has resulted from downward revisions to estimates of tourism GDP and tourism value added. Tourism GDP has been revised down by $232 million in 1997-98 and down by $936 million in 2001-02. Tourism value added has been revised down by $495 million in 1997-98 and down by $1,254 million in 2001-02. National estimates of GDP have been revised upward in 2001-02 by $1,548 million, which also affects the calculation of the ratio.
One of the main changes to the 1997-98 TSA estimates arose from revisions to retail and wholesale margins as a result of updated information feeding into the supply and use tables from the 1998-99 Retail and Wholesale industry surveys. There have also been revisions to imports, mainly affecting motor vehicles and other tourism goods and services. In relation to taxes there has been a re-allocation of tobacco excise from intermediate consumption to households.
Because the tourism demand and supply data have been confronted for the first time for 2000-01, there have also been changes to estimates of tourism demand. One of the larger revisions has been an upward revision in consumption of accommodation by domestic households as a result of reconciling the BTR data with the industry data available from the ABS service industries survey program for 2000-01. The shares of domestic consumption between households and business were also reviewed and updated resulting in changes to the levels of household and business consumption for some products. These updated shares have been applied across the time series for each tourism product.
Tourism demand estimates for motor vehicle hire and motor vehicle repair and maintenance in 2001-02 have also been revised.
Estimates for tourism employment have been revised across all years. Revised labour force data and updated industry survey data have been used to produce revised whole economy estimates of employment. Tourism employment is derived by applying the tourism value added ratio to the employment estimates. Previously published estimates of tourism employment were based on 1997-98 tourism value added ratios. As part of the benchmarking of 2000-01 TSA estimates, new tourism value added ratios for 2000-01 have been derived and some of the 1997-98 ratios have been revised. These benchmark changes have led to revisions in the estimates of tourism employment in all years.
 Print Page
 Print All