INTRODUCTION
- This release presents statistics on the use of the Internet on farms for business operations in Australia. The data were obtained from a question included in the 2007-08 Agricultural Resource Management Survey conducted by the Australian Bureau of Statistics (ABS). Information obtained was in respect of the year ended 30 June 2008.
- A farm is a business coded to an 'agricultural' industry or a business which has indicated they undertake agricultural activities, with an estimated value of agricultural operations (EVAO) of $5,000 or more. These estimates refer to the farm's use of the Internet for business operations.
- The industry classification used in this release differs from previous issues which used the 1993 version of the Australian and New Zealand Standard Industrial Classification (ANZSIC). This classification has been revised. The estimates in this release are based on the ANZSIC 2006 edition. For these reasons, these estimates are not directly comparable with estimates from previous years. For more information, see paragraphs 3-11 of the Explanatory Notes.
- This is an electronic release of Use of the Internet on Farms, Australia. All available data is contained in the accompanying datacubes, including use of the Internet on farms by Statistical Division.
HIGHLIGHTS
- In 2007-08, 66% of farms were using the Internet for business operations.
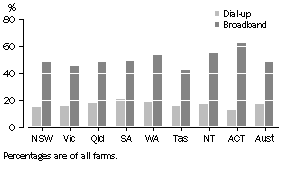
- 48% of farms used a broadband connection.
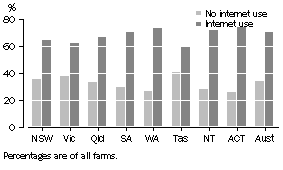
- Use of the Internet across states and territories ranged from 74% in the Australian Capital Territory to 59% in Tasmania.
Use of the Internet on farms for business operations, by States and Territories, 2007-08

- The Australian Capital Territory had the highest proportion of broadband users with 62%. Northern Territory was the second highest with 55% of farms using a broadband connection.
- Tasmania had the highest non-use of the Internet at 41%. Tasmania also had the lowest proportion of broadband users with only 42%.
Farm use of dial-up and broadband, 2007-08

- Use of dial-up internet connections were significantly lower than broadband connections across all States and Territories, with the average for Australia at 17%. South Australia had the highest dial-up rate with 21%.
- 90% of all farms with an estimated value of agricultural operations (EVAO) of $1m or more used the Internet for business operations. There was a strong relationship between farm size, as measured by EVAO, and the use of the Internet.
Use of the Internet on farms for business operations(a), by selected indicators: 2007-08 |
|
 |  |  | All farms | Farms using the Internet | No internet use |
 |  |  | no. | no. | % | no. | % |
|
| States and Territories |  |  |  |  |  |
 | New South Wales | 44 500 | 28 417 | 64 | 16 083 | 36 |
 | Victoria | 34 257 | 21 258 | 62 | 12 998 | 38 |
 | Queensland | 29 192 | 19 637 | 67 | 9 555 | 33 |
 | South Australia | 15 044 | 10 567 | 70 | 4 477 | 30 |
 | Western Australia | 13 135 | 9 524 | 73 | 3 611 | 27 |
 | Tasmania | 4 211 | 2 483 | 59 | 1 729 | 41 |
 | Northern Territory | 605 | 435 | 72 | ^169 | 28 |
 | Australian Capital Territory | 82 | 61 | 74 | ^21 | 26 |
| Industry |  |  |  |  |  |
 | Agriculture |  |  |  |  |  |
 |  | Nursery and Floriculture Production | 1 947 | 1 448 | 74 | 499 | 26 |
 |  | Mushroom and Vegetable Growing | 4 562 | 2 390 | 52 | 2 172 | 48 |
 |  | Fruit and Tree Nut Growing | 13 814 | 9 765 | 71 | 4 050 | 29 |
 |  | Sheep, Beef Cattle and Grain Farming | 87 001 | 56 245 | 65 | 30 757 | 35 |
 |  | Other Crop Growing | 4 915 | 3 490 | 71 | 1 425 | 29 |
 |  | Dairy Cattle Farming | 8 793 | 5 814 | 66 | 2 979 | 34 |
 |  | Poultry Farming | 1 284 | 890 | 69 | 394 | 31 |
 |  | Deer Farming | *138 | *117 | 85 | 21 | 15 |
 |  | Other Livestock Farming | 3 444 | 2 503 | 73 | 941 | 27 |
 |  | Agriculture | 125 898 | 82 661 | 66 | 43 237 | 34 |
 | All other industries | 15 128 | 9 721 | 64 | 5 407 | 36 |
| EVAO |  |  |  |  |  |
 | $0-$49,999 | 58 907 | 33 475 | 57 | 25 432 | 43 |
 | $50,000-$149,999 | 35 056 | 21 823 | 62 | 13 233 | 38 |
 | $150,000-$249,999 | 15 930 | 11 354 | 71 | 4 577 | 29 |
 | $250,000-$499,999 | 16 882 | 13 296 | 79 | 3 585 | 21 |
 | $500,000-$999,999 | 9 313 | 7 985 | 86 | 1 328 | 14 |
 | $1m or more | 4 938 | 4 450 | 90 | 489 | 10 |
| Total | 141 026 | 92 383 | 66 | 48 644 | 34 |
|
| ^ estimate has a relative standard error of 10% to less than 25% and should be used with caution |
| * estimate has a relative standard error of 25% to 50% and should be used with caution |
| (a) Percentages are of all farms. |
NO INTERNET USE FOR BUSINESS OPERATIONS
The map below depicts farms not using the Internet for business operations, by Statistical Division. Most smaller farms located around urban areas are less likely to use the Internet for business operations. A higher proportion of farms in remote areas use the Internet for business operations. This highlights the strong relationship between farm size, as measured by EVAO, and the use of the Internet for business operations.
ROUNDING
Where figures have been rounded, discrepancies may occur between the sum of the components and the total. Proportions have been calculated using unrounded data.
INQUIRIES
For further information about these and related statistics, contact the National Information and Referral Service on 1300 135 070 or Tim Landrigan on Perth (08) 9360 5104.
 Quality Declaration
  Print Page
 Print All