FEATURE ARTICLE: DWELLINGS IN THE ACR
INTRODUCTION
This article presents statistics on the number of dwellings in the Australian Capital Region (ACR) from the ABS Census of Population and Housing (Census) and from the Building Approvals Collection (Building Approvals). Building Approvals collects data from relevant authorities approval processes for the construction of buildings. The article is structured to provide information on both the stock of dwellings and flow of new dwellings with data sourced from the Census and Building Approvals respectively.
The ACR comprises the ACT and the 17 surrounding Local Government Areas (LGAs) - Map and Population of the Australian Capital Region
CENSUS DWELLINGS
Stock of private dwellings
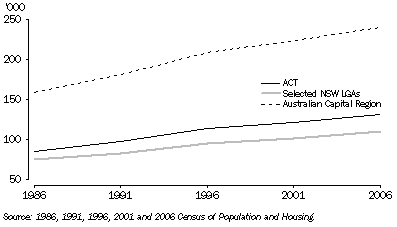
According to the 2006 Census, there were approximately 240,750 private dwellings in the ACR with 55% of these in the ACT (131,380 dwellings) and 45% in the selected NSW LGAs (109,370). The majority of private dwellings in the ACT were occupied on Census Night (94% or 122,900 dwellings). However, there were only 82% or 89,160 dwellings occupied on Census Night in the selected NSW LGAs. The LGAs of Eurobodalla and Bega Valley had a high proportion of unoccupied private dwellings (32% and 19% respectively) which can be attributed to the large number of holiday homes in these areas.
Between 1986 and 2006, the number of private dwellings in Australia increased by 45% (or 2.6 million dwellings). For the ACR the number of private dwellings increased by 51% (or 81,190 dwellings), with the ACT having a greater increase (55% or 46,380 dwellings) than the selected NSW LGAs (47% or 34,810 dwellings).
Count of private dwellings in the ACR - 2006 Census of Population and Housing |
|
 |  | Total private dwellings(a) | Occupied private dwellings(b) |
 |  | Separate house | Other dwelling(c) | Total | Separate house | Other dwelling(c) | Total |
|
| ACT SSDs |  |  |  |  |  |  |
 | North Canberra | 10 178 | 8 936 | 19 115 | 9 459 | 7 985 | 17 444 |
 | Belconnen | 27 117 | 6 280 | 33 398 | 25 794 | 5 672 | 31 466 |
 | Woden Valley | 9 559 | 4 645 | 14 205 | 9 000 | 4 185 | 13 185 |
 | Weston Creek-Stromlo | 7 744 | 1 505 | 9 249 | 7 347 | 1 380 | 8 727 |
 | Tuggeranong(d) | 27 997 | 3 923 | 31 919 | 26 898 | 3 607 | 30 505 |
 | South Canberra | 6 307 | 5 351 | 11 658 | 5 811 | 4 664 | 10 475 |
 | Gungahlin-Hall | 8 213 | 3 622 | 11 835 | 7 841 | 3 259 | 11 100 |
 | Total ACT SSDs | 97 115 | 34 262 | 131 379 | 92 150 | 30 752 | 122 902 |
| Selected NSW LGAs |  |  |  |  |  |  |
 | Queanbeyan (C) | 10 059 | 5 058 | 15 117 | 9 493 | 4 505 | 13 998 |
 | Palerang (A) | 5 095 | 345 | 5 440 | 4 295 | 246 | 4 541 |
 | Boorowa (A) | 1 273 | 58 | 1 333 | 907 | 44 | 951 |
 | Goulburn-Mulwaree (A) | 10 214 | 1 692 | 11 906 | 8 827 | 1 371 | 10 198 |
 | Harden (A) | 1 712 | 51 | 1 763 | 1 396 | 41 | 1 437 |
 | Upper Lachlan Shire (A) | 3 486 | 152 | 3 638 | 2 652 | 108 | 2 760 |
 | Yass Valley (A) | 5 110 | 360 | 5 469 | 4 530 | 303 | 4 836 |
 | Young (A) | 4 578 | 612 | 5 194 | 4 045 | 532 | 4 577 |
 | Bega Valley (A) | 12 509 | 3 006 | 15 515 | 10 407 | 2 220 | 12 630 |
 | Eurobodalla (A) | 17 367 | 3 882 | 21 249 | 12 139 | 2 396 | 14 535 |
 | Bombala (A) | 1 332 | 48 | 1 380 | 1 006 | 36 | 1 042 |
 | Cooma-Monaro (A) | 4 188 | 563 | 4 749 | 3 530 | 367 | 3 897 |
 | Snowy River (A) | 3 103 | 1 671 | 4 774 | 2 267 | 1 385 | 3 652 |
 | Cootamundra (A) | 3 110 | 290 | 3 398 | 2 720 | 217 | 2 937 |
 | Gundagai (A) | 1 517 | 104 | 1 622 | 1 318 | 95 | 1 413 |
 | Tumut Shire (A) | 4 606 | 563 | 5 169 | 3 954 | 429 | 4 383 |
 | Tumbarumba (A) | 1 548 | 109 | 1 657 | 1 282 | 93 | 1 375 |
 | Total selected NSW LGAs | 90 807 | 18 564 | 109 373 | 74 768 | 14 388 | 89 162 |
| Total ACR | 187 922 | 52 826 | 240 752 | 166 918 | 45 140 | 212 064 |
|
| (a) Includes unoccupied private dwellings; excludes non-private dwellings such as hotels, motels, boarding houses, private hotel, hospitals, aged care accommodation. |
| (b) Excludes non-private dwellings, unoccupied private dwellings. |
| (c) Includes semi-detched row or terrace houses, townhouses, flats, units or apartments and other dwellings. |
| (d) Includes details for Remainder of ACT which are very small. |
| Source: 2006 Census of Population and Housing. |
| Note: New South Wales: Cities (C) and Areas (A). |
Dwelling growth
Between 1986 and 2006, the number of private dwellings in Australia increased by 45%, while the number of people living in private dwellings increased by only 28%. In the ACR, during the same period, private dwellings increased at a higher rate (51%) while the number of people living in private dwellings increased by 28%. This trend has been more pronounced in the ACT, with a 55% growth in private dwellings compared to a 29% growth in people living in private dwellings. In the selected NSW LGAs, there was a 47% growth in private dwellings and a 26% growth in people living in private dwellings. The higher rate of growth in dwelling stock and smaller households can be linked to:
- the steady decline in the average number of people per occupied private dwelling mainly due to families having on average fewer children and an increase in lone persons and couples only households; and
- an increase in the proportion of private dwellings that were unoccupied on Census Night due to the prevalence of second- or holiday-homes.
CENSUS DWELLING NUMBERS

Dwelling type
Based on 2006 Census data, separate houses were the most common dwelling structure in Australia accounting for 74% of all private dwellings, this proportion has decreased over the last few decades due to increased construction of higher density housing.
For the ACR, the proportion of separate houses declined from 81% (129,115) in 1986 to 78% (187,920) in 2006, with the ACT decreasing from 81% (68,825) in 1986 to 74% (97,110) in 2006, but the selected NSW LGAs had a small increase from 81% (60,290) in 1986 to 83% (90,800) in 2006. In the ACR in 2006, other dwellings were comprised of:
- 24,360 semi-detached, row/terrace, townhouses (18,070 in ACT and 6,290 in selected NSW LGAs);
- 25,100 flats, units or apartments (15,850 in ACT and 9,250 in selected NSW LGAs); and
- 3,370 other dwellings including those not stated (340 in ACT and 3,030 in selected NSW LGAs).
Four or more bedroom dwellings increase
Nationally, the average size of a new house has increased by 32.7% (181m
2 in 1987-88 to 239m
2 in 2007-08). For the ACT, the average size of a new house has increased by 56.2% (165m
2 in 1987-88 to 257m
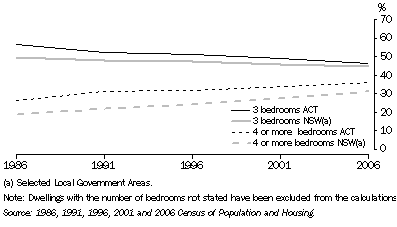
2 in 2007-08). An indication from the Census of the increase in the size of homes is the growing proportion of dwellings with four or more bedrooms. Nationally, from 1986 to 2006, dwellings with 4 or more bedrooms increased from 15% to 28% of all private dwellings. For the ACR over the 20 year period, dwellings with 4 or more bedrooms increased from 23% to 34% of all private dwellings, with ACT increasing from 26% to 36% and selected NSW LGAs increasing from 19% to 31%.
NUMBER OF BEDROOMS IN DWELLINGS

BUILDING APPROVALS
New residential dwelling approvals
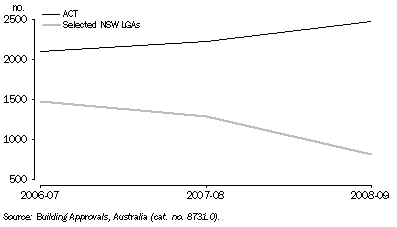
New residential dwelling approvals over the three financial years to 2008-09 could potentially increase the stock of private dwellings in the ACR by approximately 11,130 dwellings (4.6%), with the increase in ACT being approximately 7,380 dwellings (5.6%) and the increase in selected NSW LGAs being approximately 3,750 dwellings (3.4%).
While residential dwelling approvals has remained fairly stable in the ACR over the three financial years (3,750 in 2006-07, 3,660 in 2007-08 and 3,720 in 2008-09), there has been a steady increase in the ACT (2,240 in 2006-07, 2,340 in 2007-08 and 2,800 in 2008-09) and a decline in the selected NSW LGAs (1,510 in 2006-07, 1,320 in 2007-08 and 920 in 2008-09).
NEW DWELLING APPROVALS IN THE ACR, Private sector

Of the 11,130 dwelling approvals in the ACR, 60% were for houses and 40% for other dwelling types such as flats and townhouses. While the ACT dwelling approvals consisted of 55% for houses and 45% for other dwelling types, the dwelling approvals for selected NSW LGAs comprised 71% for houses and 29% for other dwelling types.
New dwelling approvals in the ACR(a) |
|
 |  | 2006-07 | 2007-08 | 2008-09 |
 |  | Houses(b) | Total other dwellings(c) | Total dwellings | Houses(b) | Total other dwellings(c) | Total dwellings | Houses(b) | Total other dwellings(c) | Total dwellings |
|
| ACT SSDs |  |  |  |  |  |  |  |  |  |
 | North Canberra | 147 | 296 | 443 | 65 | 353 | 418 | 50 | 306 | 356 |
 | Belconnen | 210 | 455 | 665 | 257 | 352 | 609 | 498 | 568 | 1 069 |
 | Woden Valley | 42 | 10 | 52 | 78 | 39 | 117 | 54 | 99 | 156 |
 | Weston Creek-Stromlo | 37 | 19 | 56 | 26 | 4 | 30 | 16 | 28 | 44 |
 | Tuggeranong(d) | 81 | 20 | 101 | 95 | 134 | 229 | 84 | 112 | 196 |
 | South Canberra | 48 | 141 | 189 | 77 | 160 | 237 | 56 | 152 | 208 |
 | Gungahlin-Hall | 699 | 39 | 740 | 686 | 8 | 699 | 730 | 40 | 770 |
 | Total ACT SSDs | 1 264 | 980 | 2 246 | 1 284 | 1 050 | 2 339 | 1 488 | 1 305 | 2 799 |
 | Private sector | 1 122 | 980 | 2 104 | 1 180 | 1 050 | 2 235 | 1 407 | 1 311 | 2 718 |
 | Public sector | 142 | - | 142 | 104 | - | 104 | 81 | - | 81 |
| Selected NSW LGAs |  |  |  |  |  |  |  |  |  |
 | Queanbeyan (C) | 91 | 198 | 290 | 75 | 91 | 176 | 35 | 137 | 172 |
 | Palerang (A) | 169 | 22 | 191 | 82 | 8 | 91 | 51 | 2 | 55 |
 | Boorowa (A) | 17 | - | 17 | 31 | - | 31 | 8 | 6 | 14 |
 | Goulburn-Mulwaree (A) | 82 | - | 82 | 116 | 4 | 121 | 98 | 5 | 103 |
 | Harden (A) | 8 | 2 | 10 | 4 | - | 4 | 1 | - | 1 |
 | Upper Lachlan Shire (A) | 37 | - | 37 | 48 | - | 48 | 20 | - | 20 |
 | Yass Valley (A) | 93 | 4 | 97 | 88 | 6 | 94 | 104 | - | 105 |
 | Young (A) | 40 | 5 | 45 | 50 | 37 | 87 | 45 | 2 | 49 |
 | Bega Valley (A) | 111 | 47 | 160 | 90 | 26 | 116 | 119 | 6 | 127 |
 | Eurobodalla (A) | 201 | 123 | 324 | 163 | 22 | 187 | 91 | 10 | 103 |
 | Bombala (A) | 2 | - | 2 | 2 | - | 2 | 2 | - | 2 |
 | Cooma-Monaro (A) | 22 | - | 22 | 31 | - | 32 | 37 | 4 | 41 |
 | Snowy River (A) | 33 | 26 | 59 | 25 | 24 | 49 | 17 | 6 | 32 |
 | Cootamundra (A) | 14 | 61 | 75 | 34 | 21 | 55 | 20 | - | 21 |
 | Gundagai (A) | 17 | - | 17 | 23 | - | 23 | 20 | 2 | 22 |
 | Tumut Shire (A) | 38 | 35 | 73 | 52 | 118 | 170 | 43 | 2 | 45 |
 | Tumbarumba (A) | 10 | - | 10 | 21 | 12 | 33 | 10 | - | 10 |
 | Total selected NSW LGAs | 985 | 523 | 1 511 | 935 | 369 | 1 319 | 721 | 182 | 922 |
 | Private sector | 975 | 504 | 1 480 | 933 | 348 | 1 283 | 721 | 178 | 901 |
 | Public sector | 10 | 21 | 31 | 4 | 32 | 36 | 3 | 18 | 21 |
| Total ACR | 2 249 | 1 503 | 3 757 | 2 219 | 1 419 | 3 658 | 2 209 | 1 487 | 3 721 |
 | Private sector | 2 097 | 1 484 | 3 584 | 2 113 | 1 398 | 3 518 | 2 128 | 1 489 | 3 619 |
 | Public sector | 152 | 21 | 173 | 108 | 32 | 140 | 84 | 18 | 102 |
|
| - nil or rounded to zero (including null cells) |
| (a) Mainly compiled from permits issued by local government authorities and other principal certifying authorities or contracts let by commonwealth, state, semi-government and local government authorities. Excludes non-residential buildings which are primarily intended for purposes other than long-term residential purposes. |
| (b) Relates to separate dwelling units. |
| (c) Relates to dwellings containing more than one dwelling unit such as semi-detached, row or terrace houses or townhouses, flats, units, apartments, etc. |
| (d) Includes details for Remainder of ACT. |
| Source: Building Approvals, Australia (cat. no. 8731.0). |
| Note: New South Wales: Cities (C) and Areas (A). |
Location of new dwelling approvals
The majority of new dwelling approvals in the ACT over the three financial years to 2008-09 were in the following districts:
- Belconnen with around 2,340 dwellings, mainly in the suburbs of Bruce (830 dwellings), Macgregor (530 dwellings), Belconnen Town Centre (465 dwellings) and Dunlop (210 dwellings);
- Gungahlin-Hall with around 2,210 dwellings, mainly in Harrison (780 dwellings), Franklin (390 dwellings), Gungahlin (275 dwellings), Forde (190 dwellings) and in other areas of Gungahlin-Hall (575 dwellings); and
- North Canberra with around 1,220 dwellings, mainly in Canberra City (370 dwellings), Turner (200 dwellings), Watson (140 dwellings), Ainslie (140 dwellings), Braddon (115 dwellings) and Lyneham (105 dwellings).
The majority of new dwelling approvals in the selected NSW LGAs over the three financial years to 2008-09 were in the LGAs of Queanbeyan (640 dwellings), Eurobodalla (610 dwellings), Bega Valley (400 dwellings), Palerang (340 dwellings), Goulburn-Mulwaree (310 dwellings), Yass Valley (300 dwellings) and Tumut Shire (290 dwellings).
 Print Page