JANUARY KEY FIGURES
 | November 2005 | December 2005 | January 2006 | Dec 05 to Jan 06 |  |
 | $m | $m | $m | % change |  |
Trend |  |
|  |
| Balance on goods & services | -1 830 | -1 987 | -2 155 | . . |  |
| Credits (exports of goods & services) | 15 323 | 15 468 | 15 566 | 1 |  |
| Debits (imports of goods & services) | 17 153 | 17 455 | 17 721 | 2 |  |
Seasonally Adjusted |  |
|  |
| Balance on goods & services | -2 443 | -1 146 | -2 690 | . . |  |
| Credits (exports of goods & services) | 15 210 | 16 313 | 15 178 | -7 |  |
| Debits (imports of goods & services) | 17 653 | 17 459 | 17 868 | 2 |  |
|  |
| . . not applicable |
Balance on goods and services
|  |
JANUARY KEY POINTS
TREND ESTIMATES
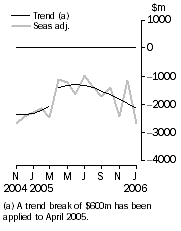
- The provisional trend estimate of the balance on goods and services was a deficit of $2,155m in January 2006, an increase of $168m on the revised deficit in December.
- Goods and services credits rose $98m (1%) to $15,566m. Goods and services debits rose $266m (2%) to $17,721m.
SEASONALLY ADJUSTED ESTIMATES
- In seasonally adjusted terms, the balance on goods and services was a deficit of $2,690m in January, an increase of $1,544m on the revised deficit in December.
- Goods and services credits fell $1,135m (7%) to $15,178m. Non-rural and other goods fell $1,205m (11%) and rural goods rose $5m. Services credits rose $65m (2%).
- Goods and services debits rose $409m (2%) to $17,868m. Intermediate and other goods rose $238m (4%), capital goods rose $182m (5%), while consumption goods fell $22m (1%). Services debits rose $11m.
ORIGINAL ESTIMATES
- In original terms, the January balance on goods and services was a deficit of $3,027m, an increase of $2,790m on the deficit in December. Goods and services credits fell $2,994m (18%) and goods and services debits fell $204m (1%).
- In the seven months to January, exports of non-rural and other goods were up $14.5b (25%) and rural goods were down $0.9b (6%) on the corresponding period in 2004-05.
NOTES
FORTHCOMING ISSUES
| ISSUE | Release Date |
| February 2006 | 3 April 2006 |
| March 2006 | 5 May 2006 |
| April 2006 | 31 May 2006 |
| May 2006 | 4 July 2006 |
| June 2006 | 2 August 2006 |
| July 2006 | 31 August 2006 |
CHANGES IN THIS ISSUE
There are no changes in this issue.
INQUIRIES
For further information about these and related statistics, contact the National Information and Referral Service on 1300 135 070 or Tom Jebbink on Canberra (02) 6252 5540.
ANALYSIS AND COMMENTS
BALANCE ON GOODS AND SERVICES
The trend estimate of the balance on goods and services in January 2006 was a deficit of $2,155m, an increase of $168m on the deficit in December.
In seasonally adjusted terms, the balance on goods and services in January 2006 was a deficit of $2,690m, an increase of $1,544m on the deficit in December.
Exports of goods
GOODS CREDITS
Rural goods
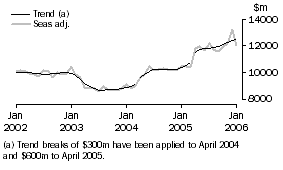
The trend estimate of rural goods exports rose $22m (1%) to $2,091m.
In seasonally adjusted terms, exports of rural goods rose $5m to $2,132m.
The movements in the seasonally adjusted components contributing to this rise were:
- cereal grains and cereal preparations, up $15m (4%)
- wool and sheepskins, up $15m (8%)
- other rural goods, up $15m (2%).
Offsetting these effects were meat and meat preparations, down $40m (7%).
In original terms, exports of rural goods fell $446m (20%) to $1,800m.
Non-rural goods
The trend estimate of non-rural goods exports rose $41m to $9,557m.
In seasonally adjusted terms, exports of non-rural goods fell $991m (10%) to $9,077m.
The main movements in the seasonally adjusted components contributing to the fall were:
- metal ores and minerals, down $656m (25%)
- metals (excluding non-monetary gold), down $196m (19%)
- other mineral fuels, down $79m (7%)
- transport equipment, down $37m (9%)
- other manufactures, down $29m (2%).
Partially offsetting these effects were coal, coke and briquettes, up $25m (1%).
In original terms, exports of non-rural goods fell $2,385m (23%) to $8,117m. The significant contributors to the fall were:
- metal ores and minerals, down $1,008m (37%), where the largest decreases were in copper ore, down $335m (71%), with volumes down 63%, and iron ore, down $325m (29%), largely on decreased volumes
- metals (excluding gold), down $189m (18%), with aluminium down $140m (25%), largely on reduced volumes
- other mineral fuels, down $203m (17%), with crude oil down $238m (42%) on reduced volumes
- transport equipment, down $351m (66%), where the largest decrease was in road vehicles, down $282m (70%).
Other goods
The trend estimate of other goods exports rose $42m (5%) to $834m.
In seasonally adjusted terms, exports of other goods fell $214m (20%) to $834m.
The main movement contributing to the fall in the seasonally adjusted estimates was non-monetary gold, down $267m, partly offset by goods for processing, up $43m.
Exports of services
SERVICES CREDITS
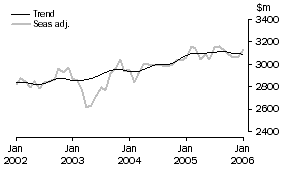
In trend terms, services credits fell $7m to $3,084m.
Seasonally adjusted, services credits rose $65m (2%) to $3,135m.
The main movements in the seasonally adjusted components contributing to this rise were:
- travel services, up $44m (3%)
- transportation services, up $14m (2%).
Seasonally adjusted, tourism related services credits rose $26m (1%) to $1,968m.
IMPORTS OF GOODS AND SERVICES
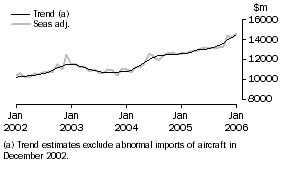
The trend estimate of goods and services debits rose $266m (2%) between December and January to $17,721m.
In seasonally adjusted terms, goods and services debits rose $409m (2%) to $17,868m. Capital goods rose $182m (5%), other goods rose $168m (31%), intermediate and other merchandise goods rose $70m (1%) while consumption goods fell $22m (1%). Services debits rose $11m.
Imports of goods
GOODS DEBITS
Consumption goods
The trend estimate of imports of consumption goods rose $54m (1%) to $4,306m.
In seasonally adjusted terms, imports of consumption goods fell $22m (1%) to $4,302m.
The main components contributing to the fall in the seasonally adjusted estimates were:
- non-industrial transport equipment, down $44m (4%)
- food and beverages mainly for consumption, down $5m (1%).
Partly offsetting these effects were:
- consumption goods n.e.s., up $16m (1%)
- household electrical items, up $11m (3%).
In original terms, imports of consumption goods fell $320m (8%) to $3,812m.
Capital goods
The trend estimate of imports of capital goods rose $110m (3%) to $3,586m.
In seasonally adjusted terms, imports of capital goods rose $182m (5%) to $3,620m.
The main components contributing to the rise in the seasonally adjusted estimates were:
- civil aircraft, up $180m
- telecommunications equipment, up $94m (21%)
- ADP equipment, up $37m (7%).
Partly offsetting these effects were:
- industrial transport equipment n.e.s., down $109m (22%)
- machinery and industrial equipment, down $40m (3%).
In original terms, imports of capital goods fell $152m (4%) to $3,273m.
Intermediate Goods
The trend estimate of imports of intermediate goods rose $45m (1%) to $5,971m.
In seasonally adjusted terms, intermediate goods imports rose $70m (1%) to $5,926m.
The main movements contributing to the rise in the seasonally adjusted estimates were:
- fuel and lubricants, up $83m (5%)
- organic and inorganic chemicals, up $29m (9%)
- plastics, up $18m (9%)
- primary industrial supplies n.e.s., up $17m (20%).
Partly offsetting these effects were:
- processed industrial supplies n.e.s., down $48m (4%)
- parts for transport equipment, down $33m (5%)
- iron and steel, down $27m (11%).
In original terms, intermediate goods imports rose $98m (2%) to $5,801m.
Other Goods
The trend estimate of imports of other goods rose $38m (7%) to $574m.
In seasonally adjusted terms, other goods imports rose $168m (31%) to $715m.
The main contributor to the rise in the seasonally adjusted estimates was goods for processing, up $183m.
In original terms, other goods imports rose $164m (30%) to $711m.
Imports of services
SERVICES DEBITS
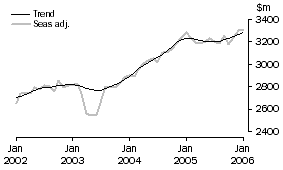
In trend terms, services debits rose $19m (1%) to $3,284m.
Seasonally adjusted, services debits rose $11m to $3,305m.
The main movement in the seasonally adjusted components contributing to this rise was transportation services, up $36m (3%).
Partly offsetting this effect was travel services, down $28m (2%).
Seasonally adjusted, tourism related services debits fell $15m (1%) to $1,739m.
 Print Page
 Print All