LABOUR PRICE INDEX
The Labour Price Index (LPI) measures changes in the price of labour services resulting from market forces. The LPI is unaffected by changes in the quality or quantity of work performed, that is, it is unaffected by changes in the composition of the labour force, hours worked, or changes in characteristics of employees (e.g. work performance). The LPI is produced annually on a financial year basis and consists of two components: a wage price index (WPI), published quarterly; and non-wage price index, which is available for each financial year.
Indexes are compiled using information collected from a representative sample of employee jobs within a sample of employing organisations. The ABS constructs four WPIs on a quarterly basis: ordinary time hourly rates of pay excluding bonuses; ordinary time hourly rates of pay including bonuses; total hourly rates of pay excluding bonuses; and total hourly rates of pay including bonuses. Four non-wage indexes are constructed on a financial year basis: annual and public holiday leave; superannuation; payroll tax; and workers' compensation. From these wage and non-wage components, two LPIs are constructed, also on a financial year basis, one including bonuses and one excluding bonuses. Only those indexes which exclude bonuses are pure price indexes because bonuses tend to reflect changes in the quality of work performed.
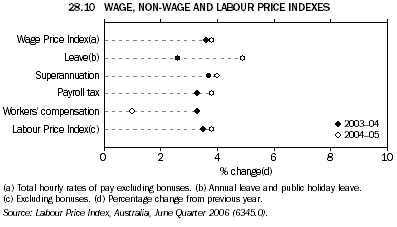
Graph 28.10 shows percentage changes from the previous financial year for several LPI series. The WPI (total hourly rates of pay excluding bonuses) and the LPI (excluding bonuses) for 2004-05, show almost the same rates of change from the previous year. The annual and public holiday leave index showed the biggest increase in the rate of change from the previous financial year for 2004-05. This was because in 2003-04 Victoria and Tasmania did not provide an additional day off in lieu when ANZAC Day fell on a Sunday.

As shown in table 28.11, increases from the previous year for total hourly rates of pay excluding bonuses varied across states and territories. For Australia, the change from 2004-05 to 2005-06 was 4.1%. For the states and territories, the highest annual growth was recorded by Western Australia (4.5%) and the lowest by Victoria and South Australia (both 3.8%).
28.11 TOTAL HOURLY RATES OF PAY EXCLUDING BONUSES, All sectors
|
 | New
South
Wales | Victoria | Queensland | South
Australia | Western
Australia | Tasmania | Northern
Territory | Australian
Capital
Territory | Australia |
|
INDEX NUMBER(a) |
|
| 2001-02 | 93.0 | 93.5 | 93.6 | 92.7 | 93.5 | 93.7 | 94.0 | 92.8 | 93.3 |
| 2002-03 | 96.3 | 96.9 | 96.5 | 96.3 | 96.9 | 96.8 | 96.8 | 95.9 | 96.5 |
| 2003-04 | 100.0 | 100.0 | 100.0 | 100.0 | 100.0 | 100.0 | 100.0 | 100.0 | 100.0 |
| 2004-05 | 103.6 | 103.9 | 103.8 | 103.5 | 104.3 | 104.1 | 103.7 | 104.3 | 103.8 |
| 2005-06 | 107.8 | 107.9 | 108.4 | 107.4 | 109.0 | 108.4 | 108.2 | 108.6 | 108.1 |
|
CHANGE FROM PREVIOUS YEAR (%) |
|
| 2002-03 | 3.5 | 3.6 | 3.1 | 3.9 | 3.6 | 3.3 | 3.0 | 3.3 | 3.4 |
| 2003-04 | 3.8 | 3.2 | 3.6 | 3.8 | 3.2 | 3.3 | 3.3 | 4.3 | 3.6 |
| 2004-05 | 3.6 | 3.9 | 3.8 | 3.5 | 4.3 | 4.1 | 3.7 | 4.3 | 3.8 |
| 2005-06 | 4.1 | 3.8 | 4.4 | 3.8 | 4.5 | 4.1 | 4.3 | 4.1 | 4.1 |
|
| (a) Reference base year is 2003-04 = 100.0. |
 |  |  |  |  |  |  |  |  |  |
| Source: Labour Price Index, Australia, June Quarter 2006 (6345.0). |
Graph 28.12 compares the rate of increase in the total hourly rates of pay excluding bonuses across all major occupation groups from 2004-05 to 2005-06. Tradespersons and related workers (4.6%), Intermediate production and transport workers (4.4%) and Professionals (4.4%) recorded the highest growth from the previous year, while Elementary clerical, sales and service workers recorded the lowest annual growth (3.4%).
Yearly increases in the total hourly rates of pay excluding bonuses, by industry, are shown in graph 28.13. Changes from 2004-05 to 2005-06 ranged from 3.3% for Accommodation, cafes and restaurants and Communication services industries, to 5.6% for the Electricity, gas and water supply industry.
 Print Page