Page tools:
 Print Page Print Page
 Print All Print All
| ||
|
Economic resources Energy expenditure and consumption Dwelling characteristics Energy-related behaviours and perceptions
.gif) Annotation(s): Low income refers to persons in the second and third income decile, middle income refers to persons in the middle income quintile and high income refers to persons in the highest income quintile. Source(s): Household Energy Consumption Survey, Australia: Summary of Results Similarly, low wealth households spent less per week on energy ($72) than households with higher wealth. .gif) Annotation(s): Low net worth refers to persons in the lowest net worth quintile, middle net worth refers to persons in the third net worth quintile and high net worth refers to persons in the highest net worth quintile. Source(s): Household Energy Consumption Survey, Australia: Summary of Results Although average energy costs increased in relation to household income and wealth, energy costs had more impact on the economic wellbeing of lower economic resource groups. For instance, nine percent of low income households experienced at least one indicator of financial stress associated with their energy use compared to two percent of high income households. Nearly one in five low income households (18%) could not pay their electricity, gas or telephone bills on time, while 13% had their electricity or gas services disconnected sometime during the last 12 months. By comparison, only five percent of high income households could not pay their bills on time and two percent had their services disconnected. Low income households also spent on average almost 10% of their gross household weekly income on total household energy costs, around three times that of high income households. 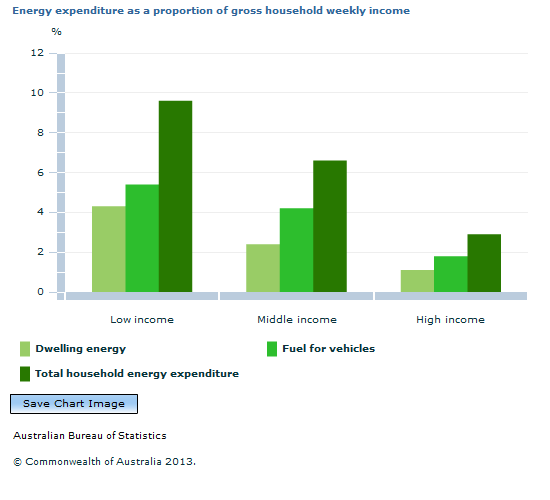 Annotation(s): Low income refers to persons in the second and third income decile, middle income refers to persons in the middle income quintile and high income refers to persons in the highest income quintile. Source(s): Household Energy Consumption Survey, Australia: Summary of Results Similarly, energy costs as a proportion of gross weekly household income were higher for low wealth households (6.3%) than for higher wealth households. 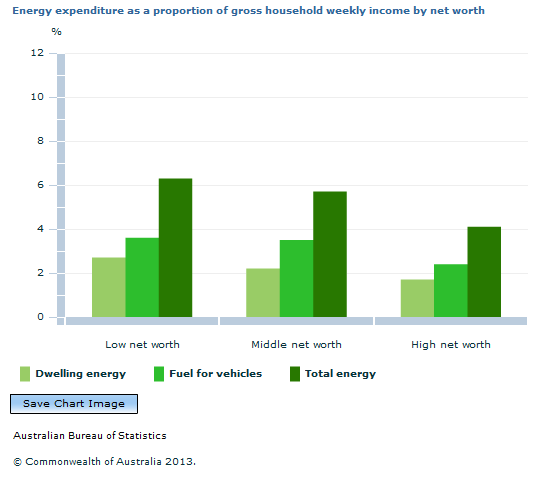 Annotation(s): Low net worth refers to persons in the lowest net worth quintile, middle net worth refers to persons in the third net worth quintile and high net worth refers to persons in the highest net worth quintile. Source(s): Household Energy Consumption Survey, Australia: Summary of Results Households that received most of their gross weekly income from a government pension spent close to 10% of their income on total energy costs ($61 per week, 9.9%). This was around twice that for other households regardless of their main source of household income. Households with a government pension as a main source of income had similar expenditures on energy for their dwelling ($30 per week) and fuel for vehicles ($31), while weekly expenditure on fuel for vehicles for all other households was significantly higher than for energy for dwellings. 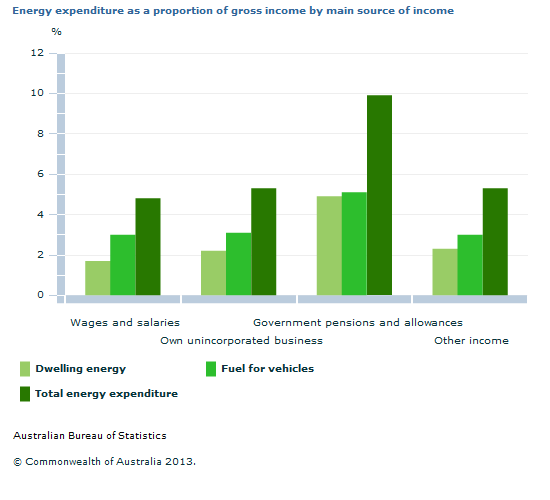 In terms of how much energy is consumed within households, consumption patterns generally followed expenditure patterns among groups based on their income, wealth and main source of household income. Low income households for instance, used on average 115.5 kilowatt hours (kWh) of electricity per week and 586.4 megajoules (MJ) of mains gas per week, compared to 140.3 kWh of electricity and 725.0 MJ of mains gas among households in the highest income quintile. Bottled gas consumption amounts however showed a different pattern, with similar consumption amounts (ranging between six and ten litres per week) across most income, net worth and main source of income groups. (Endnote 2) Dwelling characteristics Dwelling characteristics are useful to assist in understanding energy costs and consumption. In 2012, there was little difference between low, middle or high income households in the type of dwelling they occupied and their extent of energy efficiency characteristics (insulation, window treatments and solar electricity or hot water). However, low income households were more likely to live in dwellings with fewer bedrooms (2.9 bedrooms on average) than higher income households (3.2 bedrooms for both middle and high income groups), which may contribute to lower energy costs. Low wealth households were more likely to occupy dwellings which were not separate houses, such as townhouses, flats, units or apartments, which in general have significantly lower average energy costs. These households were more likely to occupy dwellings with fewer bedrooms (2.6 on average) than other households (3.1 and 3.5 for middle and high wealth households respectively). Energy efficient characteristics were less prevalent among these households with significantly fewer dwellings having insulation, window treatments or solar electricity or hot water installed compared to other households. In general, energy costs increase with the addition of energy sources used in a dwelling (e.g. mains gas, LPG/ bottled gas). One third (34%) of low income and nearly half of low wealth households (46%) used just electricity in their dwelling. By comparison, fewer high income (25%) and high wealth households (22%) used electricity on its own. The most common energy sources used among high income and wealth households, were electricity and mains gas with no other energy sources present (53% and 49%, respectively), whereas 42% of both low income and low wealth households used these sources. Energy-related behaviours and perceptions Households may choose to perform actions or adjust their behaviour in order to reduce energy costs. They may also have different perceptions on the types of activities that contribute most to their dwelling energy costs. Note that responses are somewhat subjective, as the person answering the questions may not be aware of all behaviours of others in the household, and perception questions are subjective in nature.
Two thirds of households whose main source of income was from a government pension (67%) switched appliances off at the wall when not in use, and took shorter showers (65%), which was significantly higher than for groups with other types of income as their main source. Watching TV was identified as the main contributor to household energy costs in the last 12 months for 6% of low wealth households and 4% of households whose main source of income was a government pension or allowance. Both these rates were higher than for other wealth and main source of income groups. The number of people employed within a household may also have an impact on energy costs, as more energy is likely to be consumed when residents are at home rather than at work. Significantly more low income, low wealth and households where the main source of income was from a government pension had no persons employed in the household (58%, 40% and 85% respectively) than other household groups. Endnotes 1. Low income households are those households in the second and third deciles of equivalised disposable household income. Middle income households are those households in the third quintile and high income households are those in the highest quintile. 2. Information on units of electricity and gas were only supplied by households who could locate this information on a bill or statement. The rate of households who supplied consumption information varied, but was generally higher among higher income and wealth groups. Document Selection These documents will be presented in a new window.
|
|
4670.0 - Household Energy Consumption Survey, Australia: Summary of Results, 2012
ARCHIVED ISSUE Released at 11:30 AM (CANBERRA TIME) 24/09/2013 First Issue

This page last updated 29 August 2014