Feature Article: Comparison of ABS measures of employee remuneration
This article was published in the October 2005 issue of Australian Labour Market Statistics (cat. no. 6105.0).
INTRODUCTION
Statistics on employee remuneration are in demand from a wide range of users, including economic analysts, social researchers, policy makers, and employer and employee associations. The ABS publishes a number of measures relating to the remuneration of employees, to meet the different needs of users. These measures include average weekly earnings, changes in the price of labour, and compensation of employees.
The variety of measures available can sometimes lead to misunderstanding and misapplication. The choice of measure will depend on what type of analysis is being undertaken. This article explores the differences between the various measures of employee remuneration.
MEASURES OF EMPLOYEE REMUNERATION
Three distinct measures of employee remuneration are discussed in this article: earnings; changes in the price of labour; and compensation of employees. Each measure is outlined below.
Earnings
Estimates of the level of earnings are produced from a number of surveys: the Survey of Average Weekly Earnings (AWE); the Survey of Employee Earnings and Hours (EEH); and the Survey of Employee Earnings, Benefits and Trade Union Membership (EEBTUM).
The AWE survey is one of the major sources of data on earnings, and is designed to provide a quarterly measure of the level of earnings. Three earnings series are produced from AWE:
- average weekly ordinary time earnings for full-time adults;
- average weekly total earnings for full-time adults; and
- average weekly total earnings for all employees.
While the AWE survey provides a frequent time series, data are only available for full-time adult employees and all employees, and can only be cross-classified by a small number of variables, such as sex, state, sector, and industry. The EEH and EEBTUM surveys provide additional detail, although on a less frequent basis.
The EEH survey is run every two years and provides a large number of variables important in the analysis of weekly earnings, including: managerial/non-managerial status; state; sector; level of government; industry; occupation; employer size; sex; full-time/part-time status; adult/junior status; and type of employee (e.g. permanent/fixed-term contract or casual). The EEH survey therefore supplements AWE survey data by providing detailed information on the composition and distribution of employee earnings and hours.
The annual EEBTUM survey is a household survey, in contrast to the AWE and EEH surveys which are business surveys. The EEBTUM survey, which is conducted as a supplement to the monthly Labour Force Survey, collects weekly earnings data cross-classified by a range of socio-demographic information, including: sex; age; marital status; relationship in household; geographic region; school attendance; birthplace and year of arrival in Australia. The EEBTUM survey also collects details about the type of employment, including: occupation; industry; hours worked; full-time or part-time status; sector; size of workplace and leave entitlements.
While the EEH and EEBTUM surveys are run less frequently than the AWE survey, they are a valuable source of information as they enable detailed analysis of earnings levels.
Changes in the price of labour
Information on changes in the price of labour is available from the quarterly Labour Price Index (LPI). The LPI is compiled from information collected from businesses on changes in wage and non-wage costs. Information collected on wages is used to produce a Wage Price Index (WPI).
The WPI was first compiled for the September quarter 1997 and is the main ABS measure of changes in wages. The WPI measures quarterly changes over time in the cost to an employer of employing labour, and is unaffected by changes in the quality or quantity of work performed.
The ABS publishes four wage price indexes each quarter. The headline WPI series is the index of total hourly rates of pay excluding bonuses. This series excludes bonus payments (which generally relate to the individual performance of the employee or to the organisation's performance), and so represents a pure price measure for combined ordinary time and overtime hourly rates of pay.
Compensation of employees
Compensation of employees (CoE) is a quarterly measure of the total remuneration paid to employees in return for work done and is published as part of the national accounts. Compensation of employees is a broader measure than earnings as it includes irregular payments (e.g. annual bonuses) and social contributions paid by the employer (e.g. severance, termination and redundancy payments; employer superannuation contributions; and workers compensation premiums). These payments are excluded from measures of earnings, which have a narrower focus.
A quarterly measure of the average CoE per employee, known as Average Earnings National Accounts (AENA), is produced by dividing the total compensation of employees for the quarter by the total number of employees. The total number of employees is estimated using Labour Force Survey data, calculated as an average of the three months in each quarter. Some adjustments are made to this estimate of employment.
Two measures of AENA are produced: average non-farm compensation per employee; and average compensation per employee. The average non-farm compensation per employee estimate is the key series, as it is a more stable estimate. This is because employee earnings in the agricultural sector can fluctuate due to seasonal effects.
SUMMARY OF THE SURVEYS AND THEIR KEY SERIES
The following table provides a comparison of each of the surveys discussed. It outlines the key series produced, what each survey is designed to measure, the frequency and type of data source, the benefits and limitations of each survey, and the related publication.
1. Survey Summary |
|  |
 | AWE Survey | EEH Survey | EEBTUM Survey | LPI | CoE |  |
|  |
| Key series produced | Average weekly total earnings (AWTE) for full-time adult employees and all employees. Average weekly ordinary time earnings (AWOTE) for full-time adult employees. | Average weekly earnings for all employees. Average weekly earnings for full-time adult non-managerial employees. | Median and mean weekly earnings of full-time, part-time and all employees. | Labour Price Indexes. Wage Price Index (WPI) of total hourly rates of pay excluding bonuses. | Non-farm Average Earnings National Accounts (AENA). |  |
| Designed to measure | Level estimates of weekly earnings and the distribution of earnings. | Level estimates of weekly and hourly earnings and the distribution of earnings. | Level estimates of earnings and the distribution of earnings. | Changes in the price of labour. | Level estimates of average compensation of employees. |  |
| Frequency/type of data source | Quarterly business survey. | Two-yearly business survey. | Annual household survey. | Quarterly business survey. | Quarterly national accounts series based on quarterly business surveys. |  |
| Benefits | Quarterly time series (original, seasonally adjusted and trend estimates available). | Provides detailed job information allowing analysis by industry, occupation, hourly rates etc. Source of distributional data (e.g. quartiles). | Provides detailed demographic and job information. Source of distributional data (e.g. medians). | Provides estimates of wage and non-wage inflation. | Broad measure of remuneration. |  |
| Limitations | Few cross-classificatory items. | Survey run infrequently (two-yearly). | Only provides average weekly total earnings (no series on ordinary time earnings). Includes payments not related to the period of work performed (e.g. backpay and pay in advance). | No level estimates or in-depth cross-classificatory items. | Few cross-classificatory items. |  |
| Publication | Average Weekly Earnings, Australia (cat. no. 6302.0) | Employee Earnings and Hours, Australia (cat. no. 6306.0) | Employee Earnings, Benefits and Trade Union Membership, Australia (cat. no. 6310.0) | Labour Price Index, Australia (cat. no. 6345.0) | Australian National Accounts: National Income, Expenditure and Product (cat. no. 5206.0) |  |
|  |
COMPARISON OF REMUNERATION MEASURES
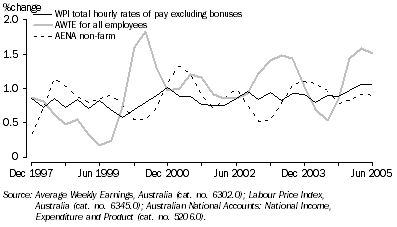
There are a number of series available from the surveys discussed. These series highlight different aspects of remuneration and tend to exhibit quite different movements. Graph 2 illustrates how the quarterly measures of remuneration differ for the period December quarter 1997 to June quarter 2005. It highlights the quarterly changes for total hourly rates of pay excluding bonuses (WPI), non-farm Average Earnings National Accounts (AENA) and Average Weekly Total Earnings (AWTE) for all employees from the AWE survey.
2. QUARTERLY MOVEMENTS: Trend estimates

The WPI series is more stable than the other series. Unlike the other series, the WPI is specifically designed to provide movement estimates of the changing price of labour.
The WPI is unaffected by changes in the quality and quantity of work performed, such as changes in the composition of the labour force, the number of hours worked, or the characteristics of employees. The WPI only reflects changes which are a response to market prices and so provides a pure measure of wage inflation. The WPI is therefore recommended when measuring changes in wages.
In contrast to the WPI, the estimates of movements in AWTE and AENA (as shown in graph 2) show considerable volatility. Unlike the WPI, these two measures are affected by factors such as compositional change and hours worked.
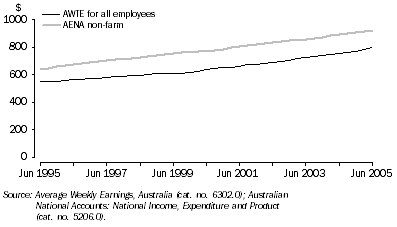
While there is some volatility in the movements of AWTE and AENA, which is to be expected, the estimates of the level of earnings show a lot less volatility, and provide a valuable time series of earnings data. Graph 3 shows level estimates of AWTE for all employees and non-farm AENA, for the period June 1995 to June 2005.
3. AVERAGE WEEKLY EARNINGS: Trend estimates

While the two series in graph 3 generally show consistent increases over time, there are differences in the levels. The AENA estimate is higher than AWTE as AENA includes irregular payments (e.g. bonuses) and other payments, such as employers' social contributions, which are excluded from the AWTE. There are also differences in the reference period used. The AWE survey has a one week reference period in the middle of the quarter, while AENA is based on the entire quarter.
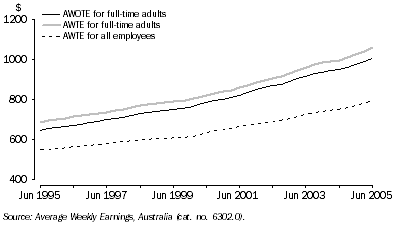
The AWE survey also provides information for full-time adult employees, which give a different insight into earnings. Graph 4 shows a time series of level estimates from AWE for average weekly ordinary time earnings (AWOTE) for full-time adults, AWTE for full-time adults and AWTE for all employees, for the period June 1995 to June 2005.
4. Average Weekly Earnings, Trend Estimates

Graph 4 shows that the estimate of AWTE for full-time adult employees is consistently higher than the other two series. This is because it includes the earnings of full-time adults and their overtime earnings. In contrast, the AWTE series for all employees is lowest as it includes the earnings of part-time and junior employees, who receive lower pay on average than full-time adult employees.
The AWOTE for full-time adults series is generally considered the more stable earnings series due to the exclusion of overtime and part-time and junior employees. The amount of overtime and the mix of part-time and junior employees can fluctuate with changing seasonal and economic conditions.
The divergence in the AWTE series for all employees and the earnings series for full-time adults since the early 1990s reflects the increasing number of people working part-time. This increase in part-time employment has resulted in the AWTE series increasing at a slower rate, reflecting the lower earnings of part-time employees when compared with full-time employees.
While the AWE survey provides a long time series of earnings, the EEH and EEBTUM surveys provide an additional level of detail. For example, the median weekly earnings series published from the EEBTUM survey removes the effects of outliers, while the EEH survey provides data for managerial and non-managerial employees.
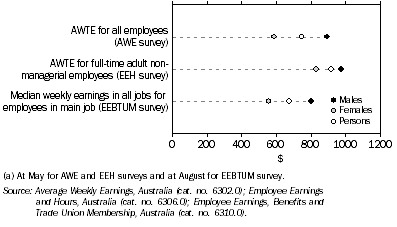
EEH data can be used to examine different population groups. One way of standardising for differences between groups (e.g. men and women) is to select a subset of employed people with similar earnings characteristics. Full-time adult non-managerial employees (see graph 5) is often chosen as the standard for several reasons. Firstly, the occupational profiles of part-time and full-time employees can be very different, so it may be useful to exclude part-time employees. Secondly, adult and junior rates of pay can differ widely, and high managerial earnings can also distort means. Lastly, managerial employees are generally not paid an hourly rate, so comparing hourly earnings between managerial and non-managerial employees may not be meaningful.
Graph 5 compares AWTE for all employees from the AWE survey, AWTE for full-time adult non-managerial employees from the EEH survey, and median weekly earnings for all employees in their main job from the EEBTUM survey. The graph illustrates the differences in the measures. Since the estimates can vary quite markedly depending on the population being included, it is important to choose the most appropriate measure for analysis.
5. Weekly Earnings, by Sex - 2004(a)

CONCLUSION
Each of the measures of employee remuneration produced by the ABS is designed for a specific purpose. The Wage Price Index is the headline measure of wage inflation, the AWE measures provide a long time series of estimates of average weekly earnings, and AENA provides a broader view of remuneration. This information is complemented by the less frequent EEH and EEBTUM measures which provide estimates of earnings alongside socio-demographic and employee characteristics, enabling users to examine various aspects of the labour market in greater depth. The decision on which measure, or measures, to use depends on the analysis being undertaken.
FURTHER INFORMATION
For further information please contact the Assistant Director, Labour Market Statistics on Canberra (02) 6252 5783. More information on the measures and surveys discussed in this article can also be found in Labour Statistics: Concepts, Sources and Methods (cat. no. 6102.0.55.001).
 Print Page
 Print All