Spotlight: How many jobs are there in Manufacturing?
In the March quarter of 2019, more than 6% (or a little over 1 in 20) of all jobs in Australia were in manufacturing.
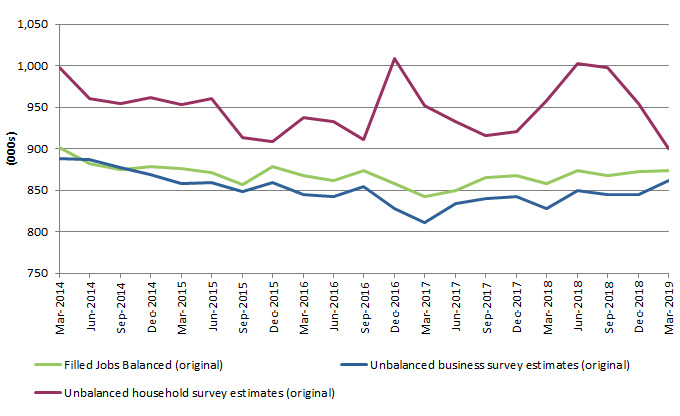
The number of filled jobs (that is, jobs with a person in them) in manufacturing has declined by around 20,000 jobs in the past five years - from around 900,000 jobs in March 2014, to 880,000 in March 2019. However, manufacturing jobs have increased by 16,000 jobs in the past twelve months, and 10,000 in the past quarter.
This change over the past five years has seen manufacturing remain the 7th highest employing industry.
In March 2019, there were 25,000 secondary jobs in manufacturing (that is, jobs worked as a person’s second job), or 2.8% of total filled jobs in the industry.
The main source of data for this article is the Australian Labour Account, which provides a framework for bringing together and ‘balancing’ labour market data from different sources (including data from the Labour Force Survey, the Quarterly Business Indicators Survey, the Economic Activity Survey and the Survey of Employment and Earnings). All of these data sources show a general decline in manufacturing jobs over the long term. The green line in the below chart – the balanced Labour Account estimate – provides the best measure of the number of manufacturing jobs over time.
Graph 1: Manufacturing filled jobs, original

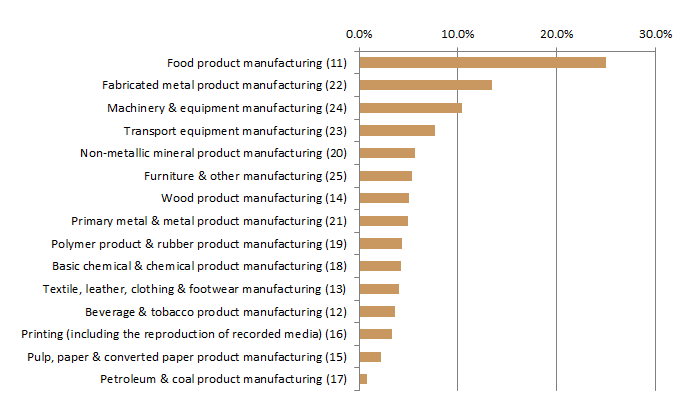
The annual Australian Labour Account also shows the distribution of filled jobs across the component industries within the manufacturing industry (referred to as ‘subdivisions’ within the manufacturing industry ‘division’). Food manufacturing accounts for the largest share of all filled jobs in the manufacturing industry, at around 24%, followed by fabricated metal products (15%), and machinery and equipment (10%).
Graph 2: Proportion of filled jobs by subdivision, Manufacturing

The Labour Account contains high quality hours worked data for manufacturing, which is directly comparable with the best estimate of manufacturing jobs. Over the past 5 years manufacturing hours worked have increased by 1.7%, and further increased by 2.5% in the past quarter.
By comparing the two series, it is possible to produce an average hours worked per week measure, which in March quarter 2019 was 34.9 hours per week, up slightly over the past 5 years.
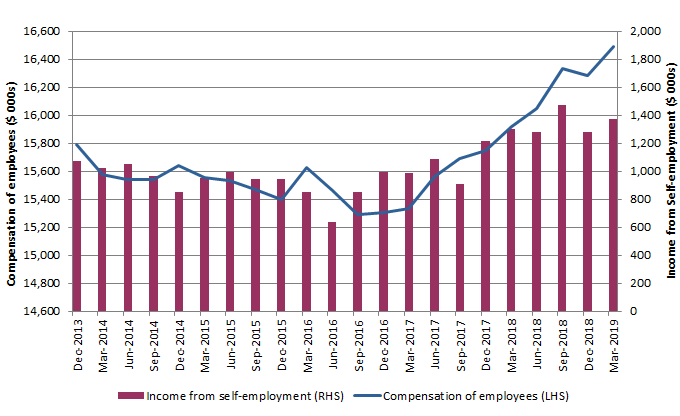
The Labour Account also provides insights into the total labour income across each of the industries. Over the past 5 years, total compensation of employees increased by 18.8% and income from self-employment increased by 21.7%. In the most recent quarter, income from self-employment rose 7.0% to $1,373 million, while compensation of employees rose 1.3% to $16,494 million, underpinning an increase in total labour income for manufacturing of 1.7%, to $17,866 million.
Graph 3: Manufacturing payments, seasonally adjusted

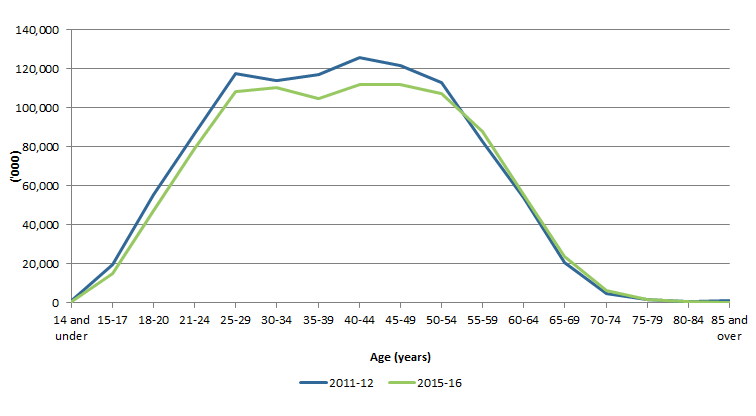
Complementary detailed data from Jobs in Australia (cat. no. 6160.0) shows that the manufacturing workforce is aging. While the median age remained constant at 40 years between 2011-12 and 2015-16, the industry is showing a decrease in employed persons aged 25-54. Data from this publication also shows that the manufacturing industry workforce continues to be predominantly male, with almost 3 out of 4 workers (72%) male.
Graph 4: Age distribution in manufacturing by employed persons, 2011-12 and 2015-16

The Labour Account is the best source of headline information on employment by industry. It provides an estimate of the number of jobs, hours worked, and associated labour income. Its estimates are complemented by other industry information, from Labour Force Survey statistics and Jobs in Australia (cat. no. 6160.0), which provide insights into the characteristics and distribution of people and their jobs in the labour market.
 Print Page
 Print All
 Quality Declaration