2006 CENSUS: REGIONAL VICTORIA IN PROFILE
On the 8th of August 2006, Australians - 19.9 million of us who were in Australia on that night, as well as about two hundred thousand overseas visitors - participated in Australia's largest peacetime operation: the Australian Bureau of Statistics' five-yearly Census of Population and Housing. The Census collects a wide range of information on the characteristics of all Australians, from remote outback cattle stations to high-rise student apartments in the inner cities. It is a snapshot of Australians at a point in time, and once collected, processed and released, data from the Census is used by all levels of government, business, academia and social services for research, planning and infrastructure development and provides a clear idea of who we are and how our society is evolving.
For Victoria, the Census results highlighted a region of Australia which is multiculturally diverse; growing older; owning or purchasing a home; and living in a separate house with a spouse and children, but increasingly moving to different types of family arrangements. However, because Melbourne is home to approximately three quarters of Victoria's population, statistics for Victoria as a whole tend to reflect the state's urban metropolis. This article seeks to highlight the diversity of characteristics across all of Victoria, particularly Victorians who make their homes outside the Melbourne metropolitan area.
Defining Regional Victoria
Features of Regional Victoria
Dwelling and Household Characteristics
Family Characteristics
Person Characteristics
Further Information
2006 Census Summary Table
Defining Regional Victoria
For the purposes of this article, Regional Victoria is defined as that part of the state outside the Melbourne Statistical Division (footnote 1). Where "Melbourne" is referred to in this article, the reference relates to the Melbourne Statistical Division (MSD).
Regional Victoria is a large area which can be defined in many different ways. For this report, the state has been divided into several sub-regions with similar characteristics. The segments of Regional Victoria selected for comparison are:
- Regional Urban Centres,
- Coastal Towns, and
- Rural Victoria.
Regional Urban Centres are urban centres in Regional Victoria with a population of 20,000 or more. They comprise Ballarat, Bendigo, Geelong
(
footnote 2)
, Mildura, Shepparton - Mooroopna, Traralgon and Wodonga (Victorian part of Albury-Wodonga only). Together, the population of Regional Urban Centres accounts for about one third of all Regional Victoria.
Coastal Towns are urban centres with a population of 1,000 or more, located on the coast. They comprise Airey's Inlet - Fairhaven, Anglesea, Apollo Bay - Marengo, Cowes, Inverloch, Lakes Entrance, Newhaven, Ocean Grove- Barwon Heads, Paynesville, Port Fairy, Portarlington, Portland, Queenscliff, San Remo, St Leonards, Torquay and Warrnambool (footnote 3).
In sum, Coastal Towns represent about 7% of the population of Regional Victoria.
Rural Victoria comprises the remainder of the state; the area not included in Regional Urban Centres or Coastal Towns.
Features of Regional Victoria
Data from the 2006 Census highlighted the diversity of the different regions outside Melbourne. For example, Regional Urban Centres were more likely to have a younger, unmarried population, with a higher proportion of females, while residents of Coastal Towns were more likely to be older, living in a couple family without children, and paying higher monthly mortgage repayments or rent on their dwelling than residents of other sectors of Regional Victoria.
The Census includes data on a range of subjects, categorised as Dwelling and Household Characteristics, Family Characteristics, and Person Characteristics. This article presents data on all these categories, for the selected segments of Regional Victoria, and includes comparisons to Victoria and Melbourne.
Dwelling and Household Characteristics
Dwelling structure
'Dwelling Structure' refers to the type of dwelling in which people live, and includes: separate house; flat, unit or apartment; semi-detached, row or terrace house, or townhouse; and caravan, cabin or houseboat. The category "flat, unit or apartment" includes dwellings built as blocks, which do not have their own private grounds, and usually share a common entrance foyer or stairwell. Semi-detached, row or terrace houses and townhouses have their own private grounds and no other dwelling above or below them.
The most common type of dwelling structure in Victoria was the separate house (76% of all occupied private dwellings), while flats, units or apartments comprised 13% of dwellings, and 9% of dwellings were semi-detached, row or terrace houses, or townhouses. In Melbourne, there was a higher proportion of households in a flat, unit or apartment (16%), or in a semi-detached, row or terrace house or townhouse (11%), compared to the rest of Victoria.
Dwellings in Regional Victoria were also predominantly separate houses (88%). However, some variation existed in the relative proportions of dwelling structures between Regional Urban Centres, Coastal Towns and Rural Victoria. The percentage of households in a flat, unit, or apartment was higher in Regional Urban Centres when compared to other parts of Regional Victoria (10% compared to 7% in Coastal Towns and 4% in Rural Victoria). The proportion of dwellings that were semi-detached, row or terrace houses or townhouses was 6% in both Regional Urban Centres and Coastal Towns. Rural Victoria had the highest proportion of households in a separate house (92%), with 4% in a flat, unit or apartment, and 2% in a semi-detached, row or terrace house or townhouse.
Separate houses have continued to be the predominant form of dwelling in all areas, however changes in housing characteristics have emerged. Since the 2001 Census, the proportion of higher density dwellings (flats, townhouses etc.) has increased. In Coastal Towns, the number of semi-detached dwellings was 33% higher than five years earlier. In Regional Urban Centres, 28% of the increase in dwellings was attributed to the combined categories of (a) flats, units or apartments and (b) semi-detached houses, row or terrace houses or townhouses.
Dwelling Tenure Status
The predominant forms of tenure for occupied private dwellings were: full ownership; being purchased; or being rented. Other forms of tenure accounted for less than 1% across Victoria. The proportion of households where tenure type was not stated on Census forms was relatively high, at around 7% of households.
Tenure Type, dwellings, Percentage distribution
- 2006
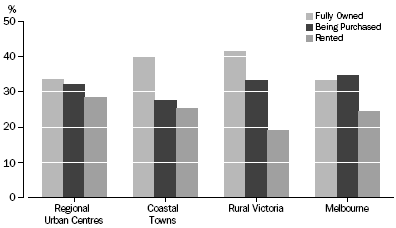
For Victoria overall, just over a third of dwellings were fully owned, with a further third being purchased (together, 69% of dwellings were fully owned or being purchased), and 24% of dwellings were being rented. The proportions were similar for dwellings in Melbourne. For Regional Victoria, however, there was a slightly higher proportion of dwellings fully owned or being purchased (71%), with a corresponding lower proportion of dwellings being rented (22%).
Within Regional Victoria, households in Rural Victoria had the highest rates of full ownership of dwellings and dwellings being purchased compared to the other parts of Regional Victoria. Almost 75% of dwellings in Rural Victoria were partly or fully owned, while the rates of ownership in Regional Urban Centres and Coastal Towns were similar to the state average at 66% and 68% respectively.
In both Coastal Towns and Rural Victoria, 40% of dwellings were fully owned, compared to approximately one third of dwellings in Regional Urban Centres. Comparing results from the 2001 and 2006 Censuses, the proportion of dwellings in Regional Victoria that were fully owned decreased from 46% to 39% over this five year period.
Median Housing Costs
The 2006 Census provides information on the cost of housing for those residents of private dwellings who do not fully own their home. These housing costs are usually either payments of rent or repayments on a housing loan.
The median monthly housing loan repayment for Victorians was $1,252, varying from $1,300 in Melbourne to $1,000 in Regional Victoria. The level of home ownership in Rural Victoria was high, with a comparatively low median monthly loan repayment of $975. Home buyers in both Regional Urban Centres and Coastal Towns paid a median monthly housing loan repayment of $1,083.
Median rental housing costs showed a similar pattern of variation across Victoria. For Victoria overall, the median weekly cost of renting a dwelling was $185. The highest cost of renting a dwelling was in Melbourne at a median weekly cost of $200, while the median weekly rent in Regional Victoria was well below the state median at $145. Rental housing costs in Coastal Towns were highest within Regional Victoria at $165, slightly higher than the median in Regional Urban Centres ($160). Although dwellings in Rural Victoria were less likely to be rented, the median weekly rent here was the lowest in Regional Victoria ($130).
Types of Households
A household is defined as one or more persons, at least one of whom is a minimum of 15 years of age, residing in the same private dwelling. Census results show that for the state of Victoria, 68% of all households were family households, 23% were lone person households, and 4% were group households.
Type of household, Percentage distribution
- 2006
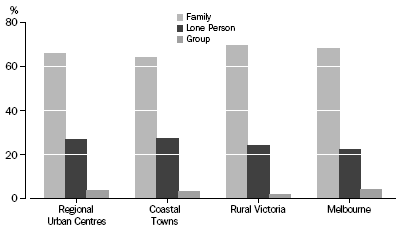
The average household size for Victoria was 2.6 persons. Data for households in Melbourne showed a similar distribution of household type to Victoria, and a corresponding average household size of 2.6 persons. Regional Victoria had a slightly higher percentage of lone person households at 25%, which may have contributed to a lower average household size of 2.5 persons.
Within Regional Victoria, Coastal Towns had the lowest percentage of family households (64%) and the highest percentage of lone person households (27%); Rural Victoria had the highest percentage of family households (70%) and the lowest percentage of lone person households (24%).
In terms of average household size, Rural Victoria was consistent with Regional Victoria at 2.5 persons, while Regional Urban Centres and Coastal Towns both averaged 2.4 persons per household.
Family Characteristics
Family Composition
Almost all households that comprise families (rather than lone person households or group households) were classified as Couple Families with Children, Couple Families without Children, or One Parent Families with Children. Other types of family composition accounted for little more than 1% of families throughout most of Victoria, except in Melbourne where other family types constituted 2% of all families. 'Other family' is defined as a group of related individuals residing in the same household, who cannot be categorised as belonging to a couple or one parent family: for example, a household where two brothers live together.
Family Composition, Percentage Distribution
- 2006
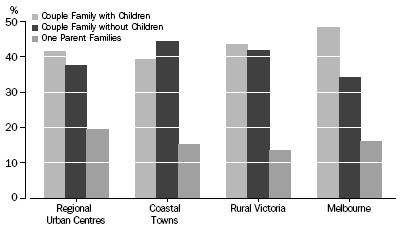
Census results showed that nearly half of all Victorian families were couple families with children (47%), while 36% were couple families without children and 15% one parent families. In Melbourne, there were similar proportions in family composition: 48% were couple families with children, 34% couple families without children, and the same ratio of one parent families (15%).
In Regional Victoria, the proportions of couple families with children and couple families without children were 43% and 41% respectively. The proportion of one parent families in Regional Victoria was consistent with Victoria overall at 15%.
When examining family structures within Regional Victoria, families in Rural Victoria had the highest proportion of couple families with children (44%), while couple families without children made up 42%. The Coastal Towns of Victoria represented the lowest percentage of couple families with children (39%), and highest percentage of couple families without children (44%) when compared to other parts of Regional Victoria.
Family households in Regional Urban Centres had a relatively low proportion of couple families without children (38%) when compared with other parts of Regional Victoria. Regional Urban Centres were also characterized by a higher percentage of one parent families (19%), compared to Coastal Towns and Rural Victoria (15% and 14% respectively).
When compared to the 2001 Census, the proportion of couple families with children in Regional Victoria was slightly lower in 2006, at 43% compared to 45% in 2001. Over this period, the percentage of couple families without children in Regional Victoria increased slightly from 39% to 41%.
Person Characteristics
The Census includes a broad range of questions designed to measure the characteristics of individuals. In addition to basic characteristics such as age, sex and place of residence, data are available on such subjects as industry of work, qualifications, income, birthplace, migration and relationships. Presented here are several selected characteristics which provide an insight to Victorians, particularly those living outside Melbourne.
Country of Birth
While the majority of Victorians in 2006 were born in Victoria, close to a quarter of the population stated their birthplace as overseas. The variety of birthplaces of Victorians is increasingly diverse, from the predominant traditional sources of migrants such as the United Kingdom, New Zealand and Europe, to places further afield like Sudan, Iran, Mauritius and Somalia.
Country of Birth, Australia and Overseas
- Victorian Regions
- 2006
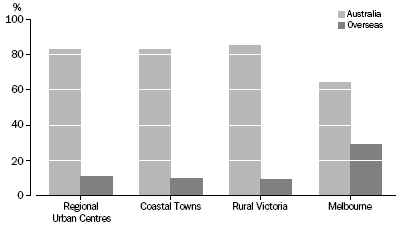
The proportion of people born overseas was consistent throughout areas in Regional Victoria, at around 10%, with around 85% of people reporting they were born in Australia
(
footnote 4)
. This is consistent with 2001 proportions. This contrasts to Melbourne, where almost 30% of people reported they were not born in Australia. Birthplaces other than Australia were consistent across the segments of Regional Victoria. The countries of the United Kingdom and New Zealand were the most predominant, with the UK representing 5% of birthplaces of people in Coastal Towns, and 3% and 4% for people in Regional Urban Centres and Rural Victoria respectively. The next most predominant birthplace for Coastal Towns and Rural Victoria was New Zealand (around 1% in each region), however for Regional Urban Centres the second-most predominant place of birth outside Australia was Italy (also around 1%). Other places of birth each represented less than 1% of the Regional Victorian population.
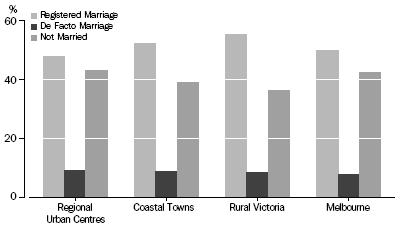
Marital Status
In Victoria, 51% of all persons aged 15 years or more were in a registered marriage, 8% were in a de facto marriage and 41% were not married. In Melbourne, there were similar proportions of married persons (50% in a registered marriage and 8% in a de facto marriage). Regional Victoria was characterized by a higher percentage of married persons, with 53% in a registered marriage, 9% in a de facto marriage and 38% not married.
The population of Coastal Towns had similar proportions of married and not married persons as Regional Victoria, with 52% in a registered marriage, 9% in a de facto marriage and 39% not married. Of all regions, Rural Victoria had the highest proportion of married people with 55% of persons (aged 15 years or more) in a registered marriage, 8% in a de facto marriage and 36% not married. On the other hand, Regional Urban Centres were characterized by a lower percentage of the population married: 48% in a registered marriage, 9% in a de facto marriage and 43% not married.
Social Marital Status, Percentage Distribution
- 2006
Religious Affiliation
In 2006 approximately 70% of Victorians stated some religious affiliation, compared to almost 73% in 2001. There were similar proportions of people with a religious affiliation across the regions of Victoria, with approximately 69% in Melbourne compared to 68% in Regional Urban Centres, 65% in Coastal Towns and 67% in Rural Victoria. In Melbourne however, Christian denominations accounted for a lower proportion of the population, around 60% compared to around 65% in other parts of Victoria.
Religious Affiliation, Victorian Regions
- 2006
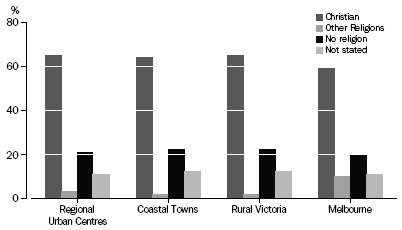
Outside Melbourne, religions other than the Christian denominations accounted for very small proportions of the population. In Regional Urban Centres the leading other religions were Islam and Buddhism, accounting for just over 1% and just over 0.5% respectively. It is important to note that across all areas, the proportion of persons who did not state a religious affiliation (Not Stated) was very high - higher than proportions of persons who reported 'Other Religions' - at around 10%.
Industry of Employment
In Victoria the most prevalent industry for persons aged 15 years and over was Retail Trade, which comprised 15% of working Victorians. Other major industries were Manufacturing (13%), Property and Business Services and Health and Community Services (both 11%). Across the regions of Victoria, however, there was some variability in the major employing industries.
Regional Urban Centres displayed a similar industry profile to Victoria and Melbourne, with high proportions of the working population stating Retail Trade and Manufacturing as their industries of employment (18% and 14% respectively). By contrast, in Rural Victoria Retail Trade and Agriculture, Forestry and Fishing were referenced as the major employing industries (14% in both cases), while in Coastal Towns Retail Trade and Health and Community Services were prevalent (17% and 13% respectively).
Further Information
ABS 2006 Census data are readily available from the Australian Bureau of Statistics web site <www.abs.gov.au>. Census products include Community Profile Tables, Fact Sheets, and maps. The second major release of free on-line 2006 Census results has been released on 25 October, 2007. This release includes the educational qualifications of Australia's population and characteristics of employed people, such as their occupation by industry, number of hours worked, and how people travel to work.
2006 Census Summary Table |
|  |
| | Regional
Urban
Centres | Coastal
Towns | Rural
Victoria | Regional
Victoria | Melbourne
Statistical
Division | Victorian
Total | |
Households | |
| |
| Dwelling Type | | | | | | | |
| Separate house(%) | 83 | 85 | 92 | 88 | 72 | 76 | |
| Semi-detached, row or terrace house, etc(%) | 6 | 6 | 2 | 4 | 11 | 9 | |
| Flat, unit or apartment(%) | 10 | 7 | 4 | 7 | 16 | 13 | |
| Dwelling Tenure | | | | | | | |
| Fully owned(%) | 33 | 40 | 42 | 39 | 33 | 35 | |
| Being purchased(%) | 32 | 28 | 33 | 32 | 35 | 34 | |
| Median monthly housing loan repayments($) | 1 083 | 1 083 | 975 | 1 000 | 1 300 | 1 252 | |
| Total rented(%) | 28 | 25 | 19 | 22 | 25 | 24 | |
| Median weekly rent($) | 160 | 165 | 130 | 145 | 200 | 185 | |
| Household Type | | | | | | | |
| Family household(%) | 66 | 64 | 70 | 68 | 68 | 68 | |
| Lone person household(%) | 27 | 27 | 24 | 25 | 23 | 23 | |
| Group household(%) | 4 | 3 | 2 | 3 | 4 | 4 | |
| Average household size(persons) | 2.4 | 2.4 | 2.6 | 2.5 | 2.6 | 2.6 | |
Family | |
| |
| Couple Families | | | | | | | |
| With children(%) | 42 | 39 | 44 | 43 | 48 | 47 | |
| Without children(%) | 38 | 44 | 42 | 41 | 34 | 36 | |
| One parent families(%) | 19 | 15 | 14 | 15 | 15 | 15 | |
Individuals | |
| |
| Place of birth | | | | | | | |
| Australia(%) | 83 | 83 | 85 | 84 | 64 | 70 | |
| Overseas(%) | 11 | 10 | 9 | 10 | 29 | 24 | |
| Not stated(%) | 6 | 7 | 6 | 6 | 7 | 7 | |
| Marital Status | | | | | | | |
| Married in a registered marriage(%) | 48 | 52 | 55 | 53 | 50 | 51 | |
| Married in a defacto marriage(%) | 9 | 9 | 8 | 9 | 8 | 8 | |
| Not married(%) | 43 | 39 | 36 | 39 | 43 | 41 | |
| Religious Affiliation | | | | | | | |
| Christian(%) | 65 | 64 | 65 | 65 | 59 | 61 | |
| Other religions(%) | 3 | 2 | 2 | 2 | 10 | 8 | |
| No religion(%) | 21 | 22 | 22 | 22 | 20 | 20 | |
| Not stated(%) | 11 | 12 | 12 | 11 | 11 | 11 | |
| Industry of Employment | | | | | | | |
| Accommodation, Cafes and Restaurants(%) | 5 | 8 | 5 | 5 | 4 | 4 | |
| Agriculture, Forestry and Fishing(%) | 2 | 2 | 14 | 9 | 1 | 3 | |
| Communication Services(%) | 1 | 1 | 1 | 1 | 2 | 2 | |
| Construction(%) | 8 | 10 | 8 | 8 | 7 | 8 | |
| Cultural and Recreational Services(%) | 2 | 2 | 2 | 2 | 3 | 2 | |
| Education(%) | 9 | 9 | 7 | 8 | 7 | 8 | |
| Electricity, Gas and Water Supply(%) | 1 | 1 | 1 | 1 | 1 | 1 | |
| Finance and Insurance(%) | 3 | 2 | 2 | 2 | 5 | 4 | |
| Government Administration and Defence(%) | 5 | 5 | 5 | 5 | 4 | 4 | |
| Health and Community Services(%) | 13 | 13 | 11 | 12 | 10 | 11 | |
| Manufacturing(%) | 14 | 11 | 12 | 12 | 14 | 13 | |
| Mining(%) | - | - | 1 | 1 | - | - | |
| Non-Classifiable Economic Units(%) | 1 | 1 | 1 | 1 | 1 | 1 | |
| Personal and Other Services(%) | 4 | 4 | 3 | 3 | 3 | 3 | |
| Property and Business Services(%) | 8 | 8 | 6 | 7 | 13 | 11 | |
| Retail Trade(%) | 18 | 17 | 14 | 16 | 14 | 15 | |
| Transport and Storage(%) | 3 | 3 | 4 | 4 | 4 | 4 | |
| Wholesale Trade(%) | 4 | 4 | 4 | 4 | 6 | 5 | |
| |
| - nil or rounded to zero (including null cells) |
2001 Census Summary Table |
| |
| | Regional
Urban
Centres | Coastal
Towns | Rural
Victoria | Regional
Victoria | Melbourne
Statistical
Division | Victorian
Total | |
Households | |
| |
| Dwelling Type | | | | | | | |
| Separate house(%) | 83 | 86 | 91 | 88 | 74 | 78 | |
| Semi-detached, row, terrace house etc.(%) | 6 | 5 | 2 | 3 | 10 | 8 | |
| Flat, unit or apartment(%) | 9 | 7 | 4 | 6 | 14 | 12 | |
| Dwelling Tenure | | | | | | | |
| Fully owned(%) | 40 | 47 | 48 | 46 | 42 | 43 | |
| Being purchased(%) | 28 | 24 | 27 | 27 | 28 | 28 | |
| Total rented(%) | 28 | 24 | 19 | 22 | 24 | 23 | |
| Household Type | | | | | | | |
| Family household(%) | 67 | 65 | 71 | 69 | 70 | 70 | |
| Lone person household(%) | 26 | 27 | 23 | 25 | 22 | 23 | |
| Group household(%) | 4 | 3 | 2 | 3 | 4 | 4 | |
| Average household size(persons) | 2.4 | 2.4 | 2.6 | 2.5 | 2.7 | 2.6 | |
Family Type | |
| |
| Couple Families | | | | | | | |
| With children(%) | 44 | 40 | 46 | 45 | 50 | 49 | |
| Without children(%) | 36 | 43 | 40 | 39 | 33 | 34 | |
| One parent families(%) | 19 | 15 | 13 | 15 | 15 | 15 | |
Individuals | |
| |
| Marital Status | | | | | | | |
| Married in a registered marriage(%) | 50 | 55 | 58 | 55 | 51 | 52 | |
| Married in a defacto marriage(%) | 7 | 7 | 7 | 7 | 6 | 7 | |
| Not married(%) | 43 | 38 | 36 | 38 | 42 | 41 | |
| |
1 A
map depicting the regions referred to in the article is available in pdf format (44kB).
< back
2 Although Geelong is located on the coast, it has been included in Regional Urban Centres due to its size.
< back
3 Warrnambool is included as a coastal urban centre due to the similar characteristics with other coastal urban Centres.
< back
4 The remaining 5% did not state their country of origin on the Census form.
< back
 Print Page
 Print All