FEBRUARY KEY FIGURES
 | | Feb 2006 | Nov 2005 to Feb 2006 | Feb 2005 to Feb 2006 |
| | '000 | % change | % change |
|
| Trend estimates | | | |
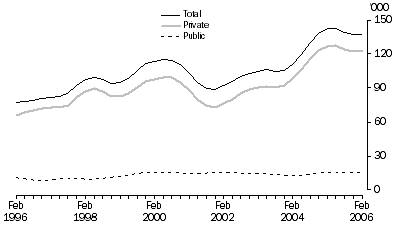
| Private sector | 122.2 | -0.1 | -3.8 |
| Public sector | 15.4 | 0.1 | 0.0 |
| Private and public sectors | 137.6 | 0.0 | -3.4 |
|
Job Vacancies, Trend
| |
FEBRUARY KEY POINTS
TREND ESTIMATES
- Total job vacancies in February 2006 were 137,600, unchanged from November 2005.
- The number of job vacancies in the private sector was 122,200 in February 2006, unchanged from November 2005 in rounded terms.
- The number of job vacancies in the public sector was 15,400 in February 2006, unchanged from November 2005 in rounded terms.
NOTES
FORTHCOMING ISSUES
| ISSUE (QUARTER) | Release Date |
| May 2006 | 29 June 2006 |
| August 2006 | 28 September 2006 |
NOTES ON ESTIMATES
CONCURRENT SEASONAL ADJUSTMENT
The ABS has introduced concurrent seasonal adjustment to the Job Vacancies Survey (JVS), replacing the forward factor adjustment method previously used to produce seasonally adjusted estimates. Concurrent seasonal adjustment uses original data up to and including the current quarter to update seasonal factors each quarter, whereas the forward factor adjustment method only updates seasonal factors annually.
By increasing the frequency of seasonal reanalyses from annually to quarterly, concurrent seasonal adjustment produces initial seasonally adjusted estimates that are closer on average to their final values, as any changes in seasonality are picked up sooner. This process can result in revisions each quarter to seasonally adjusted estimates for earlier periods. See paragraphs 22 to 24 of the Explanatory Notes for more information on the concurrent seasonal adjustment method.
SAMPLING ERROR
For information on sampling error, including standard errors for original estimates contained in this publication, see the Technical Note.
INQUIRIES
For further information about these and related statistics, contact the National Information and Referral Service on 1300 135 070 or David Oats on Perth (08) 9360 5357.
TABLES
1. JOB VACANCIES, States and territories |
| |
| | Original | Seasonally
Adjusted | Trend | |
| | NSW | Vic. | Qld | SA | WA | Tas. | NT | ACT | Australia | Australia | Australia | |
VACANCIES ('000) | |
| |
| 2004 | | | | | | | | | | | | |
| November | 45.3 | 34.1 | 28.7 | 7.5 | 13.1 | 2.1 | 2.8 | 3.5 | 137.1 | 139.4 | 138.2 | |
| 2005 | | | | | | | | | | | | |
| February | 48.2 | 33.0 | 35.4 | 8.8 | 15.3 | 2.6 | 2.3 | 4.0 | 149.5 | 143.7 | 142.4 | |
| May | 41.2 | 31.6 | 34.9 | 7.4 | 14.5 | 1.9 | 2.3 | 4.0 | 137.8 | 143.9 | 142.7 | |
| August | 39.1 | 32.8 | 33.4 | 8.8 | 16.9 | 2.2 | 2.7 | 4.4 | 140.3 | 138.3 | 139.3 | |
| November | 45.4 | 30.2 | 24.1 | 8.7 | 15.8 | 2.3 | 2.1 | 3.9 | 132.6 | 134.6 | 137.6 | |
| 2006 | | | | | | | | | | | | |
| February | 46.6 | 31.6 | 32.3 | 8.4 | 20.6 | 2.1 | 1.9 | 3.8 | 147.3 | 140.9 | 137.6 | |
CHANGE FROM PREVIOUS QUARTER (%) | |
| |
| 2004 | | | | | | | | | | | | |
| November | 12.0 | 1.7 | 3.7 | 7.2 | 5.9 | 46.4 | 39.5 | 12.7 | 7.4 | 12.0 | 6.4 | |
| 2005 | | | | | | | | | | | | |
| February | 6.2 | -3.1 | 23.1 | 17.4 | 16.5 | 26.9 | -18.3 | 13.4 | 9.1 | 3.1 | 3.0 | |
| May | -14.5 | -4.4 | -1.3 | -15.6 | -4.9 | -29.6 | 3.5 | -1.2 | -7.8 | 0.1 | 0.2 | |
| August | -5.1 | 3.9 | -4.4 | 18.4 | 16.5 | 20.1 | 16.4 | 10.7 | 1.8 | -3.9 | -2.4 | |
| November | 16.1 | -8.1 | -27.9 | -0.1 | -6.5 | 5.1 | -22.5 | -9.9 | -5.5 | -2.7 | -1.2 | |
| 2006 | | | | | | | | | | | | |
| February | 2.8 | 4.6 | 34.0 | -3.4 | 30.4 | -12.3 | -8.2 | -4.8 | 11.1 | 4.7 | 0.0 | |
CHANGE FROM CORRESPONDING QUARTER OF PREVIOUS YEAR (%) | |
| |
| 2004 | | | | | | | | | | | | |
| February | -4.4 | 6.6 | -7.6 | -21.9 | -14.5 | -33.7 | 0.2 | -5.4 | -5.0 | -6.0 | 5.7 | |
| 2005 | | | | | | | | | | | | |
| February | 29.2 | 14.0 | 92.7 | 58.7 | 49.1 | 91.2 | 28.5 | 82.0 | 41.4 | 40.3 | 28.6 | |
| 2006 | | | | | | | | | | | | |
| February | -3.2 | -4.5 | -8.9 | -3.5 | 35.1 | -22.0 | -14.3 | -6.2 | -1.5 | -1.9 | -3.4 | |
| |
2. JOB VACANCIES, Private sector - States and territories |
| |
| | Original | Seasonally
Adjusted | Trend | |
| | NSW | Vic. | Qld | SA | WA | Tas. | NT | ACT | Australia | Australia | Australia | |
VACANCIES ('000) | |
| |
| 2004 | | | | | | | | | | | | |
| November | 42.0 | 30.8 | 26.2 | 6.1 | 11.4 | 1.7 | 1.8 | 1.7 | 121.6 | 124.0 | 123.1 | |
| 2005 | | | | | | | | | | | | |
| February | 44.6 | 29.3 | 32.8 | 8.0 | 14.0 | 2.1 | 1.2 | 2.1 | 134.2 | 128.3 | 127.0 | |
| May | 37.8 | 28.4 | 32.2 | 6.7 | 13.2 | *1.1 | 1.2 | 2.0 | 122.7 | 128.7 | 127.2 | |
| August | 35.8 | 29.3 | 30.5 | 7.7 | 15.7 | 1.7 | 1.8 | *2.2 | 124.6 | 122.7 | 123.9 | |
| November | 41.9 | 26.9 | 21.2 | 7.8 | 14.5 | 1.9 | 1.2 | *1.9 | 117.3 | 119.4 | 122.2 | |
| 2006 | | | | | | | | | | | | |
| February | 42.9 | 28.7 | 28.8 | 7.6 | 19.3 | 1.6 | 1.0 | 2.0 | 131.9 | 125.4 | 122.2 | |
CHANGE FROM PREVIOUS QUARTER (%) | |
| |
| 2004 | | | | | | | | | | | | |
| November | 13.7 | 1.8 | 4.3 | 1.5 | 0.3 | 57.2 | 47.3 | 6.7 | 7.1 | 12.2 | 6.4 | |
| 2005 | | | | | | | | | | | | |
| February | 6.3 | -4.6 | 25.5 | 31.3 | 22.8 | 22.1 | -33.1 | 25.7 | 10.4 | 3.4 | 3.2 | |
| May | -15.3 | -3.1 | -1.9 | -16.4 | -5.7 | -44.7 | 0.6 | -6.1 | -8.6 | 0.3 | 0.2 | |
| August | -5.3 | 2.9 | -5.3 | 15.8 | 18.3 | 47.3 | 49.1 | 9.9 | 1.6 | -4.6 | -2.6 | |
| November | 17.0 | -8.0 | -30.6 | 1.4 | -7.4 | 12.9 | -37.2 | -11.1 | -5.9 | -2.7 | -1.4 | |
| 2006 | | | | | | | | | | | | |
| February | 2.6 | 6.6 | 36.1 | -3.3 | 32.9 | -17.4 | -10.4 | 2.5 | 12.5 | 4.9 | -0.1 | |
CHANGE FROM CORRESPONDING QUARTER OF PREVIOUS YEAR (%) | |
| |
| 2004 | | | | | | | | | | | | |
| February | -3.1 | 11.8 | -5.2 | -23.2 | -12.0 | -37.2 | 11.0 | -28.1 | -3.0 | -4.2 | 8.6 | |
| 2005 | | | | | | | | | | | | |
| February | 31.8 | 11.3 | 104.1 | 63.6 | 49.9 | 75.7 | 12.0 | 123.4 | 43.2 | 41.9 | 29.6 | |
| 2006 | | | | | | | | | | | | |
| February | -3.8 | -2.2 | -12.3 | -5.1 | 37.3 | -24.1 | -15.7 | -6.0 | -1.8 | -2.3 | -3.8 | |
| |
| * estimate has a relative standard error of 25% to 50% and should be used with caution |
3. JOB VACANCIES, Public sector - States and territories |
| |
| | Original | Seasonally
Adjusted | Trend | |
| | NSW | Vic. | Qld | SA | WA | Tas. | NT | ACT | Australia | Australia | Australia | |
VACANCIES ('000) | |
| |
| 2004 | | | | | | | | | | | | |
| November | 3.3 | 3.3 | 2.6 | 1.4 | 1.7 | 0.4 | 0.9 | 1.9 | 15.5 | 15.4 | 15.1 | |
| 2005 | | | | | | | | | | | | |
| February | 3.5 | 3.7 | 2.6 | 0.8 | 1.2 | 0.6 | 1.0 | 1.9 | 15.3 | 15.4 | 15.4 | |
| May | 3.4 | 3.2 | 2.7 | 0.7 | 1.3 | 0.7 | 1.1 | 2.0 | 15.1 | 15.2 | 15.5 | |
| August | 3.3 | 3.5 | 2.9 | 1.0 | 1.3 | 0.6 | 0.9 | 2.2 | 15.7 | 15.6 | 15.4 | |
| November | 3.5 | 3.2 | 2.9 | 0.9 | 1.3 | 0.5 | 1.0 | 2.0 | 15.3 | 15.2 | 15.4 | |
| 2006 | | | | | | | | | | | | |
| February | 3.7 | 2.9 | 3.5 | 0.9 | 1.4 | 0.5 | 0.9 | 1.8 | 15.4 | 15.5 | 15.4 | |
CHANGE FROM PREVIOUS QUARTER (%) | |
| |
| 2004 | | | | | | | | | | | | |
| November | -5.8 | 0.2 | -1.9 | 43.0 | 70.4 | 13.0 | 26.3 | 18.7 | 9.9 | 9.8 | 6.3 | |
| 2005 | | | | | | | | | | | | |
| February | 5.6 | 11.0 | -0.7 | -44.4 | -26.5 | 47.5 | 10.5 | 2.2 | -1.2 | -0.4 | 2.4 | |
| May | -3.4 | -14.6 | 6.6 | -6.8 | 4.1 | 24.2 | 6.9 | 4.3 | -1.3 | -0.7 | 0.3 | |
| August | -3.6 | 12.0 | 6.6 | 42.9 | -2.0 | -22.8 | -20.0 | 11.4 | 3.7 | 2.6 | -0.4 | |
| November | 6.9 | -8.6 | -0.1 | -11.5 | 5.2 | -18.5 | 8.0 | -8.7 | -2.3 | -3.0 | 0.1 | |
| 2006 | | | | | | | | | | | | |
| February | 4.8 | -11.2 | 18.6 | -4.1 | 3.2 | 9.2 | -5.5 | -11.8 | 0.7 | 2.1 | 0.1 | |
CHANGE FROM CORRESPONDING QUARTER OF PREVIOUS YEAR (%) | |
| |
| 2004 | | | | | | | | | | | | |
| February | -15.6 | -26.8 | -21.3 | -9.8 | -34.0 | -4.0 | -13.7 | 24.0 | -17.9 | -17.5 | -12.1 | |
| 2005 | | | | | | | | | | | | |
| February | 3.2 | 40.6 | 12.0 | 21.1 | 40.7 | 178.7 | 55.8 | 51.0 | 27.8 | 28.1 | 21.3 | |
| 2006 | | | | | | | | | | | | |
| February | 4.2 | -22.4 | 34.7 | 13.0 | 10.6 | -14.8 | -12.7 | -6.4 | 0.7 | 1.0 | 0.0 | |
| |
4. JOB VACANCIES, Industry: Original |
| |
| 2004 | 2005 | 2006 | |
| November | February | May | August | November | February | |
| '000 | '000 | '000 | '000 | '000 | '000 | |
| |
| Mining | 2.6 | 2.8 | 2.7 | 4.1 | 3.7 | 3.8 | |
| Manufacturing | 13.5 | 11.5 | 14.0 | 15.6 | 13.1 | 15.4 | |
| Electricity, gas and water supply | 0.7 | 0.7 | 1.0 | 0.9 | 1.0 | 0.9 | |
| Construction | *7.3 | 9.7 | *9.7 | 6.4 | 5.7 | *7.2 | |
| Wholesale trade | 9.1 | 9.9 | *6.6 | *6.3 | *5.0 | 11.0 | |
| Retail trade | 21.2 | 24.3 | 21.1 | 25.9 | 22.6 | 21.2 | |
| Accommodation, cafes and restaurants | 8.8 | 8.6 | 6.3 | *7.4 | 10.8 | *6.1 | |
| Transport and storage | 3.9 | 4.5 | *4.5 | 3.9 | 2.7 | 3.8 | |
| Communication services | 0.7 | *1.1 | 0.6 | 0.4 | 0.4 | 0.4 | |
| Finance and insurance | 5.9 | 6.1 | 7.4 | *8.0 | *8.2 | 6.6 | |
| Property and business services | 31.2 | 35.4 | 31.9 | 28.5 | 29.3 | 33.9 | |
| Government administration and defence | 6.8 | 7.1 | 6.3 | 7.6 | 7.9 | 7.9 | |
| Education | 4.5 | 5.4 | 4.1 | 3.9 | 2.9 | 3.3 | |
| Health and community services | 14.0 | 12.0 | 14.0 | 12.7 | 10.2 | 14.9 | |
| Cultural and recreational services | 2.5 | *3.6 | 3.7 | 3.0 | 3.5 | 3.9 | |
| Personal and other services | *4.6 | *6.9 | *4.0 | *5.6 | *5.6 | 6.9 | |
| All industries | 137.1 | 149.5 | 137.8 | 140.3 | 132.6 | 147.3 | |
| |
| * estimate has a relative standard error of 25% to 50% and should be used with caution |
 Print Page
 Print All