SEPTEMBER KEY FIGURES
 | | Sep Qtr 2007 | Jun Qtr 2008 | Sep Qtr 2008 |
| TREND ESTIMATES | '000 | '000 | '000 |
|
| Number slaughtered | | | |
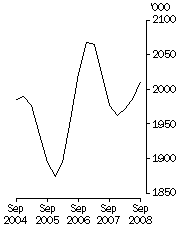
| Cattle (excl. calves) | 1 976.5 | 1 988.5 | 2 010.8 |
| Calves | 221.8 | 204.2 | 206.5 |
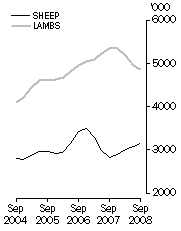
| Sheep | 2 818.9 | 3 092.9 | 3 148.1 |
| Lambs | 5 346.5 | 4 958.9 | 4 847.6 |
| Pigs | 1 339.7 | 1 232.2 | 1 175.3 |
| Chickens | 114 806.0 | 116 131.6 | 116 862.2 |
|
| | Sep Qtr 2007 | Jun Qtr 2008 | Sep Qtr 2008 |
| | tonnes | tonnes | tonnes |
|
| Meat produced | | | |
| Beef | 527 538 | 534 776 | 540 430 |
| Veal | 7 282 | 6 441 | 6 497 |
| Mutton | 60 246 | 66 266 | 66 289 |
| Lamb | 111 570 | 101 301 | 97 540 |
| Pig meat | 97 143 | 88 639 | 83 812 |
| Chicken meat | 202 812 | 201 675 | 204 789 |
| Wool receivals | 106 183 | 99 047 | 96 698 |
|
| Jun Qtr 2007 | Mar Qtr 2008 | Jun Qtr 2008 |
| ML | ML | ML |
|
| Whole milk intake by factories | 2 299 | 2 305 | 2 336 |
|
Cattle slaughterings, Excluding calves - Trend
| Sheep and lamb slaughterings, Trend
|
SEPTEMBER KEY POINTS
TREND ESTIMATES
- In September quarter 2008, the trend estimate for the number of lambs slaughtered fell by 2% to 4.8 million.
- In September quarter 2008, the trend estimate for the number of pigs slaughtered fell by 5% to below 1.2 million.
- In September quarter 2008, the trend estimate for the number of sheep slaughtered increased by 2% to 3.1 million.
NOTES
FORTHCOMING ISSUES
| ISSUE (QUARTER) | Release Date |
| December 2008 | 16 February 2009 |
| March 2009 | 15 May 2009 |
CHANGES IN THIS ISSUE
There are no changes in this issue.
INQUIRIES
For further information about these and related statistics, contact the National Information and Referral Service on 1300 135 070.
 Quality Declaration
  Print Page
 Print All