NOTES
ABOUT THIS PUBLICATION
This issue contains revised estimates of the resident population of Australian states and territories as at 30 June 2004 and preliminary estimates as at 30 June 2005. These are based on the 2001 Census of Population and Housing.
In commentary based on the statistics in this publication, it is recommended that the relevant statistics be rounded. All data are affected by errors in reporting and processing. No reliance should be placed on statistics with small values.
INQUIRIES
For further information about these and related statistics, contact the National Information and Referral Service on 1300 135 070 or Rachael Hill on Canberra (02) 6252 6296.
SUMMARY COMMENTARY
INTRODUCTION
SUMMARY OF FINDINGS
INTRODUCTION
In the 12 months to 30 June 2005, the Australian population increased by 237,100 people reaching 20,328,600. The annual growth rate for the year ended 30 June was 1.2%, remaining consistent with past years.
AGEING POPULATION
Australia's population, like that of most developed countries, is ageing as a result of sustained low fertility and increasing life expectancy. This is resulting in proportionally fewer children in the population. The median age (the age at which half the population is older and half is younger) of the Australian population has increased by 5.8 years over the last two decades, from 30.8 years at 30 June 1985 to 36.6 years at 30 June 2005. Between 30 June 2004 and 2005 the median age increased by 0.2 years. Over the next several decades, population ageing is expected to have significant implications for Australia including health, labour force participation, housing and demand for skilled labour (Productivity Commission 2005, Economic Implications of an Ageing Australia, Research Report, Canberra).
STATES AND TERRITORIES
At 30 June 2005, South Australia had the oldest population of all the states and territories with a median age of 38.8 years. Tasmania was the second oldest with a median age of 38.7 years, followed by New South Wales and Victoria (36.8 years), Western Australia (36.2 years), Queensland (35.9 years), the Australian Capital Territory (34.5 years) and the Northern Territory (30.9 years).
Median Age of population - At 30 June
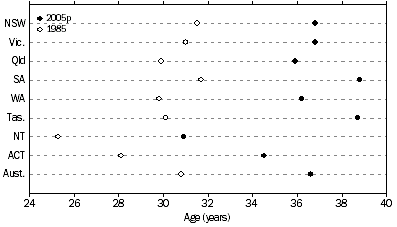
Tasmania experienced the largest increase in median age over the last 20 years, increasing by 8.6 years from 30.1 years in 1985 to 38.7 years in 2005. The emigration of younger adults from Tasmania to the Australian mainland has contributed to this accelerated ageing, see Migration, Australia (cat.no. 3412.0).
Population change, Age group - 1985 to 2005p
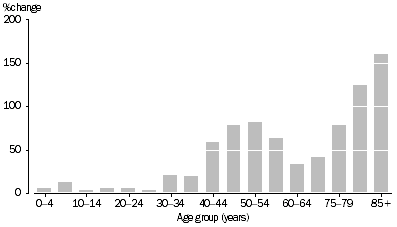
Between 30 June 1985 and 30 June 2005, the proportion of population aged 15-64 years has remained relatively stable, increasing from 66% to 67% of the total population. The proportion of people aged 65 years and over has increased from 10% to 13%. During the same period, the proportion of population aged 85 years and over has increased by 102% to 1.5% of the total population, while the proportion aged under 15 years decreased from 24% to 20%.
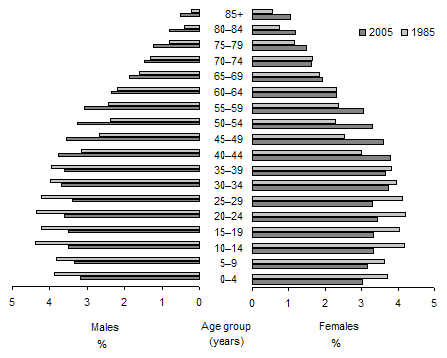
Population, Age and sex - 1985 and 2005p
MODAL AGE
The age with the most number of people in Australia was 34 years with 321,250 people. This corresponds to children born during the baby boom echo in the early 1970s. 1971-72 was the year with the most number of births recorded in Australia. However, the modal age for the ACT is 23 years which corresponds to migration of younger adults to Canberra for education and employment.
CHILDREN (UNDER 15 YEARS OF AGE)
The number of children aged 0-14 years in the population decreased marginally (down 530 persons) in the 12 months to 30 June 2005. During this period the number of children aged 0-4 and 10-14 years increased by 3,260 and 4,760 persons respectively. However, these increases were offset by a decrease of 8,550 children in the 5-9 year age group.
In the year ended 30 June 2005, Queensland recorded the largest percentage increase (0.9%) in the number of children aged 0-14 years. The Northern Territory and Western Australia also recorded positive growth in 0-14 year olds of 0.2% and 0.1% respectively. The Australian Capital Territory recorded the largest percentage decrease in population aged 0-14 years (down 1.2%), followed by South Australia (down 0.7%), Tasmania (down 0.6%) and New South Wales (down 0.4%), while Victoria experienced little change.
Between 30 June 1985 and 30 June 2005, the proportion of population aged 0-14 years decreased by four percentage points from 23.6% to 19.6%.
WORKING AGE POPULATION (AGED 15-64 YEARS)
In the year ended June 2005, Australia's adult population (people aged 15 years and over) increased by 237,600 people (1.5%). This growth varied across various age groups of the population. For example, the growth rate for those aged 15-44 years (0.6%) was below that of the 45 years and over age group (2.5%).
The number of people aged 15-64 years (working age population) increased by 1.3% in the year ended June 2005. Queensland (2.1%), Western Australia (1.8%) and the Northern Territory (1.6%) each recorded growth rates for 15-64 year olds higher than the national average. Victoria's growth rate equalled that of the nation (1.3%), and the remaining states and territories all experienced increases below the national average; New South Wales (0.9%), South Australia (0.7%), Tasmania (0.6%), and the Australian Capital Territory (0.3%).
In the 20 years between 30 June 1985 and 30 June 2005, the proportion of population aged 15-64 years increased from 66.1% to 67.3%.
OLDER PEOPLE
In the 12 months to 30 June 2005, the number of people aged 65 years and over in Australia increased by 63,100 people reaching 2.7 million, representing a 2.4% increase. The proportion of the population aged 65 years and over increased from 10.3% to 13.1% between 30 June 1985 and 30 June 2005.
Population aged 65 years or more - At 30 June
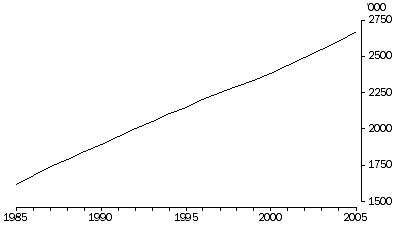
All states and territories experienced growth in their populations aged 65 years and over. The Northern Territory (6.8%), the Australian Capital Territory (3.9%), Western Australia (3.2%) and Queensland (3.1%) experienced the greatest increase in the numbers of persons aged 65 years and over.
Population aged 65 years or more, Proportion and Growth |
|  |
 | Proportion of population in 2005 | Population growth in 2004-2005 |  |
| State | % | % |  |
|  |
| New South Wales | 13.7 | 2.1 |  |
| Victoria | 13.5 | 2.3 |  |
| Queensland | 12.1 | 3.1 |  |
| South Australia | 15.2 | 1.8 |  |
| Western Australia | 11.8 | 3.2 |  |
| Tasmania | 14.5 | 2.2 |  |
| Northern Territory | 4.6 | 6.8 |  |
| Australian Capital Territory | 9.6 | 3.9 |  |
| Australia | 13.1 | 2.4 |  |
|  |
Aged 85 years and over
In the 12 months to 30 June 2005, the number of people aged 85 years and over increased by 19,400 people (6.6%) to reach 315,000. Over the past two decades, the number of elderly people increased by 160%, compared with a total population growth of 29% over the same period. Increased life expectancy for both males and females has contributed to this rise. Reflecting higher life expectancy at birth for females compared with males, there were over twice as many females (213,200) than males (101,800) in this age group at 30 June 2005.
In the year ended June 2005, the largest increases in the number of people aged 85 years and over occurred in the Northern Territory (10.6%), followed by Australian Capital Territory (9.4%), Western Australia (7.2%), South Australia (6.8%), Queensland (6.7%), New South Wales and Victoria (6.4% each) and Tasmania (5.6%).
SEX RATIOS
At 30 June 2005, the sex ratio of the total population for Australia was 99.0 males per 100 females. At birth, the sex ratio for Australia in 2004 was 105.6 males per 100 females (see Births, Australia 2004 (cat.no. 3301.0)). This excess of males in the earlier years contrasts with the opposite situation in the older years and for the total population which can be attributed to female longevity.
Sex Ratio, States and territories - At 30 June
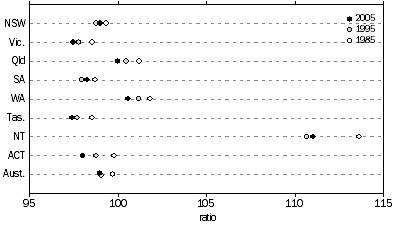
Across the states and territories in 2005, Tasmania, Victoria, Australian Capital Territory, South Australia and New South Wales all have lower number of males than females. Tasmania has the lowest sex ratio, with 97.4 males per 100 females. Queensland, Western Australia and the Northern Territory have an excess of males compared to females which may be attributed to migration. Migration can influence sex ratios, especially in the younger working ages where there may be an over representation of male migrants.
INTERNATIONAL COMPARISON
Population ageing is a major characteristic of most developed countries. In countries like Italy, Japan and Greece the number of people aged 65 years and over already exceeds the number of children aged 0-14 years. Population ageing is caused by sustained low fertility and increasing life expectancy, which has resulted in fewer children in the population. In Australia, based on the latest Series B population projections, the number of people aged 65 years and over is projected to exceed the number of children aged 0-14 years around the year 2016. For more information, see Population Projections, Australia, 2004 to 2101 (cat. no. 3222.0).
According to United Nations projections, all countries selected for analysis are expected to experience decreases in the proportion of children in their populations between 2005 and 2010. In most of these countries, the decrease in children aged 0-14 years is expected to be accompanied by increases in the proportions of people aged 15-64 years or people aged 65 years and over. Countries like Italy and Japan are expected to experience proportional declines in their populations aged 15-64 years as well as their populations aged 0-14 years, and are expected to experience large proportional increases in their population aged 65 years and over.
Population age structure, International comparison |
|  |
 | 2005 | 2010(a) |  |  |  |
 | Aged 0-14 years | Aged 15-64 years | Aged 65 years and over | Median Age | Aged 0-14 years | Aged 15-64 years | Aged 65 years and over | Median Age | Total fertility rate(b) | Life expectancy(c) |  |
| Selected Countries | % | % | % | years | % | % | % | years | rate | years |  |
|  |
| Australia | 19.6 | 67.3 | 13.1 | 36.6 | 18.4 | 67.3 | 14.3 | 38.2 | 1.8 | 82.0 |  |
| Canada | 17.6 | 69.3 | 13.1 | 38.6 | 16.0 | 69.8 | 14.2 | 40.1 | 1.5 | 80.7 |  |
| China (exl. SARs and Taiwan) | 21.4 | 71.0 | 7.6 | 32.6 | 19.5 | 72.2 | 8.3 | 34.9 | 1.7 | 72.6 |  |
| France | 18.2 | 65.2 | 16.6 | 39.3 | 18.0 | 65.1 | 16.9 | 40.5 | 1.9 | 80.0 |  |
| Greece | 14.3 | 67.5 | 18.2 | 39.7 | 13.9 | 67.8 | 18.4 | 41.5 | 1.3 | 78.7 |  |
| Hong Kong (SAR of China) | 14.4 | 73.6 | 12.0 | 38.9 | 13.3 | 74.3 | 12.4 | 41.1 | 1.0 | 82.2 |  |
| India | 32.1 | 62.7 | 5.3 | 24.3 | 29.9 | 64.4 | 5.7 | 25.6 | 2.8 | 64.9 |  |
| Indonesia | 28.3 | 66.2 | 5.5 | 26.5 | 26.8 | 67.2 | 6.0 | 28.2 | 2.2 | 68.7 |  |
| Italy | 14.0 | 66.0 | 20.0 | 42.3 | 13.7 | 65.2 | 21.1 | 44.3 | 1.4 | 80.6 |  |
| Japan | 14.0 | 66.3 | 19.7 | 42.9 | 13.7 | 63.8 | 22.4 | 44.4 | 1.4 | 82.8 |  |
| Korea, Republic of | 18.6 | 72.0 | 9.4 | 35.1 | 15.8 | 72.9 | 11.3 | 38.0 | 1.2 | 78.2 |  |
| Malaysia | 32.4 | 63.0 | 4.6 | 24.7 | 29.6 | 65.4 | 5.1 | 26.3 | 2.6 | 74.1 |  |
| New Zealand | 21.3 | 66.4 | 12.3 | 35.8 | 20.0 | 66.8 | 13.2 | 37.0 | 2.0 | 79.8 |  |
| Papua New Guinea | 40.3 | 57.3 | 2.4 | 19.7 | 37.2 | 60.4 | 2.5 | 20.7 | 3.6 | 57.1 |  |
| Philippines | 35.1 | 61.0 | 3.9 | 22.2 | 32.4 | 63.2 | 4.3 | 23.6 | 2.8 | 71.6 |  |
| Singapore | 19.5 | 72.0 | 8.5 | 37.5 | 15.6 | 74.3 | 10.0 | 40.6 | 1.3 | 79.4 |  |
| South Africa | 32.6 | 63.1 | 4.2 | 23.5 | 31.5 | 63.4 | 5.1 | 23.9 | 2.6 | 44.1 |  |
| Sweden | 17.5 | 65.3 | 17.2 | 40.1 | 16.2 | 65.3 | 18.6 | 41.1 | 1.7 | 80.8 |  |
| United Kingdom | 17.9 | 66.1 | 16.0 | 39.0 | 16.9 | 66.6 | 16.5 | 40.3 | 1.7 | 79.0 |  |
| United States of America | 20.8 | 66.9 | 12.3 | 36.1 | 20.0 | 67.2 | 12.8 | 36.6 | 2.0 | 77.9 |  |
| Viet Nam | 29.5 | 65.0 | 5.4 | 24.9 | 26.3 | 68.3 | 5.4 | 26.9 | 2.1 | 71.9 |  |
|  |
| (a) International data are United Nations medium variant projections. Australian data are ABS medium series (Series B) projections. |
| (b) Births per woman. United Nations and ABS projections are medium variant projections for the period 2005-2010. |
| (c) Life expectancy at birth. United Nations and ABS projections are medium variant projections for the period 2005 -2010, for males and females combined. |
| United Nations World Population Prospects, 2004 Revision; ABS Estimated Resident Population; ABS, Population Projections, Australian 2004 to 2101 (cat.no. 3222.0) |
According to Australian Bureau of Statistics projections, the proportion of children in the Australian population is expected to decline by more than one percentage point between 2005 and 2010, from 19.6% to 18.4%, while the proportion of people aged 15-64 years is expected to remain stable at 67.3%. The proportion of people aged 65 years and over is expected to increase by more than one percentage point from 13.1% to 14.3%.
In 2005, the age structure of Australia's population was similar to that of Canada and the United States of America. Generally, the European countries and Japan had smaller proportions of children and higher proportions of older people than Australia. In contrast, other countries in Asian tended to have proportionally more children and far fewer older people, generally reflecting considerably higher fertility rates and lower life expectancies at birth than those experienced in Australia.
 Print Page
 Print All