INTRODUCTION
This chapter looks in more detail at rainwater tanks and Australian households. It discusses the number households that reported rainwater as a source of water, how many households have a rainwater tank installed at their dwelling, why households have installed a rainwater tank and the factors preventing the installation of a rainwater tank.
Rainwater as a source of water
In 2007, 19.3%, or slightly more than 1.5 million households, reported a rainwater tank as a source of water (table 3.6 and graph 3.1). This was an increase from 17.2% in March 2004 and 15.2% in June 1994.
In March 2007, South Australia had the highest proportion (45.4%) of households reporting a rainwater tank as a source of water for the household. The South Australian figure was more than twice the second highest state, Queensland, where 22.1% of households reported a rainwater tank as a source of water.
3.1 Rainwater tanks as a source of water for households(a): 1994 to 2007
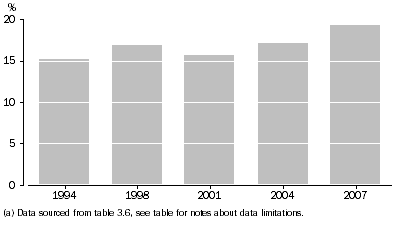
The state with the largest percentage point increase of households reporting rainwater tanks as a source of water was New South Wales, which rose from 9.1% (196,000) in 1994 to 15.8% (421,400) in 2007. The Australian Capital Territory recorded the second biggest percentage point rise, from 0.9% in 1994 to 6.7% in 2007. Interestingly, the proportion of households who reported rainwater tanks as a source of water in South Australia dropped over the same time period from 48.0% in 1994 to 45.4% in 2007.
Rainwater tanks installed
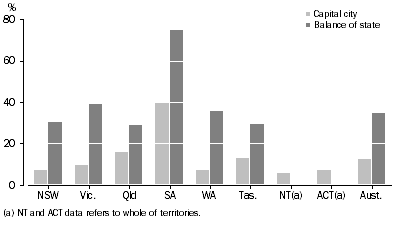
In 2007, over one-fifth (20.6% or nearly 1.7 million) of all households reported that their dwelling had a rainwater tank. A greater proportion of dwellings in areas outside capital cities had a rainwater tank (34.7%) compared to those in capital cities (12.5%). Of dwellings in capital cities, 17.4% were not suitable for a rainwater tank compared to 8.7% in areas outside of capital cities. South Australia had by far the highest proportion of households reporting that their dwelling had a rainwater tanks 40.2% of dwellings in Adelaide and 74.7% in the balance of the state. The Australian Capital Territory and the Northern Territory had the lowest proportion of households with rainwater tanks installed, 7.6% and 6.0% respectively (table 3.7 and graph 3.2).
3.2 Dwellings with rainwater tanks installed: 2007
Reasons why rainwater tanks were installed
Saving water was the main reason (41.7% or 455,400) reported by Australian households as to why they had installed a rainwater tank (table 3.9 and graph 3.3). There were 297,300 households (27.3%) that reported installing a rainwater tank because they were not connected to mains or town water and 19.5% of households reported a concern about the quality of other sources of water or they just preferred rainwater. Only 12.0% of households reported that they installed a rainwater tank to save on water costs, 6.3% households installed a rainwater tank specifically for outside water usage.
3.3 Reasons why households installed a water tank(a): 2007
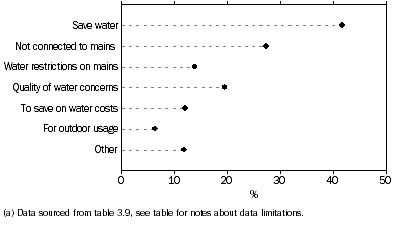
In the Australian Capital Territory, 62.3% of households who installed a rainwater tank reported that they did so to save water, the greatest proportion of all states and territories. The Australian Capital Territory also had the highest proportion of households reporting that they installed a rainwater tank due to water restrictions on the mains or town water (42.3%). This was much greater than the national figure of 13.8%. Queensland (18.8%), Victoria (16.3%) and New South Wales (16.1%) also recorded high proportions.
In Tasmania, only 24.0% of households reported the reason for installing a rainwater tank was to save water. However, 53.6% of households in Tasmania reported that they installed a rainwater tank because they were not connected to the mains/town water. This figure was especially high in Hobart, where 70.7% of households who had installed a rainwater tank did so because they were not connected to the mains/town water. Outside of Hobart, this figure fell to 47.8%.
The most commonly reported reasons for installing a rainwater tank differed markedly between the capital cities and the balance of the states. In the capital cities, the most commonly reported reason for installing a rainwater tank was to save water (except in Tasmania). In the rest of the states (except South Australia), the most common reason reported was that dwellings were not connected to mains water. This is not surprising given that households in the capital cities were more likely to be connected to mains/town water.
Attributes of households that have rainwater tanks
Of all the dwellings owned outright by the occupant, 30.4% of households reported that their dwelling had a rainwater tank installed compared with only 12.7% of rented dwellings (table 3.10). Over one-quarter (25.9%) of separate houses had rainwater tanks installed, as opposed to only 6.2% of semi-detached or townhouses. Nearly one-quarter (24.9%) of family households had a rainwater tank installed compared with only 13.2% of group households.
Households that have considered installing a rainwater tank
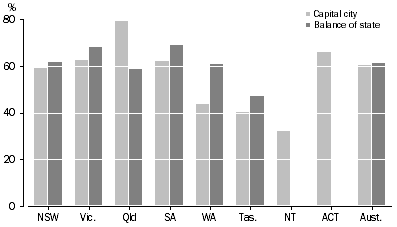
Of the 3,941,300 Australian households who were owner occupiers or purchasers that did not have a rainwater tank installed but whose dwelling was suitable for a rainwater tank, 60.8% had considered installing one (table 3.11). Queensland and the Australian Capital Territory had the highest proportions (68.8% and 66.1% respectively). Victoria (63.8%) and South Australia (63.1%) also recorded greater proportions of households who had considered installing a rainwater tank than the national figure of 60.8% (table 3.11 and graph 3.4). This could reflect the drought conditions and the water restrictions imposed in these areas.
In all states except Queensland, a greater proportion of households outside the capital cities had considered installing a rainwater tank than in the capital cities. In Queensland however, 79.1% of households in Brisbane had considered installing a rainwater tank, as opposed to only 58.6% outside of the capital. This again could reflect the water restrictions in place in southeast Queensland.
3.4 Households without a rainwater tank, Had considered installing a tank
: 2007
Factors preventing the installation of a rainwater tank
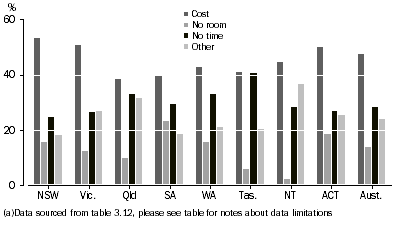
Of the 2,394,900 households who were home owners or purchasers in March 2007 with dwellings suitable for a rainwater tank and who had considered installing a rainwater tank, the most common reason reported that prevented installing a rainwater tank was cost (47.5%) (table 3.12 and graph 3.5). No time or planned but have not got round to it was the next most common reason for why a tank had not been installed at the dwelling (28.2%) followed by no room (13.7%). In March 2007, 3.2% of households (76,000) had ordered a rainwater tank but were awaiting delivery and installation. Of those, 35,300 were from Queensland. This translates to 7.3% of Queensland households. Victoria had the second highest proportion for tanks ordered but were waiting delivery at 3.1% of households.
3.5 Households that have considered installing a rainwater tank(a), Factors preventing
: 2007
 Print Page
 Print All