CONSUMER PRICE INDEX
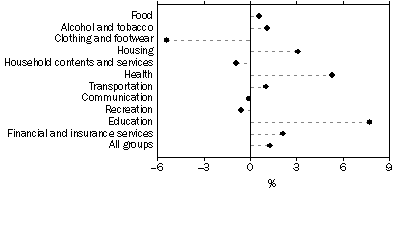
Between December quarter 2009 and March quarter 2010, the All groups Consumer Price Index (CPI) for Melbourne increased by 1.3%. The groups which recorded the largest increases were: Education (7.7%), Health (5.3%), Housing (3.1%) and Financial and Insurance services (2.1%). The groups that recorded decreases were: Clothing and footwear (-5.4%), Household contents and services (-0.9%), Recreation (-0.6%) and Communication (-0.1%).
Between March quarter 2009 and March quarter 2010, the All groups CPI for Melbourne rose by 2.8%. The CPI All groups weighted average for the eight capital cities rose by 2.9% over the same period. The biggest annual increases for Melbourne were recorded in Education (8.1%), Housing (7.7%), Health (5.5%) and Transportation (3.7%). The only group that recorded a decrease for the year was Clothing and footwear (-4.4%).
Change in consumer price index, By Group, Melbourne
- December quarter 2009 to March quarter 2010
View underlying table as an Excel spreadsheet: Download
Consumer price index, By Group, Melbourne and Weighted average of eight capital cities from the
Downloads Page.
 Print Page
 Print All