PERSONS ARRESTED
A total of 4,778 persons were arrested in the ACT during 2005-06, an increase from 3,898 in 2004-05. Of those persons arrested in 2005-06, 85% were male (4,049 persons) and 15% (729 persons) were female.
Adults (persons aged 18 years or over) made up 89% of all persons arrested in the ACT (4,236 arrests) in 2005-06. Ten percent of adults arrested in the ACT (431 arrests) were Indigenous.
Juveniles (persons aged between 10 and 17 years) accounted for the remaining 11% of persons arrested in the ACT in 2005-06 (542 arrests). Almost a quarter of juveniles arrested (24% or 130 persons) were Indigenous.
9.6 NUMBER OF PERSONS ARRESTED, ACT |
|  |
| | 2003-04 | 2004-05 | 2005-06 | |
| | Male | Female | Total | Male | Female | Total | Male | Female | Total | |
| |
| Juvenile | | | | | | | | | | |
| Indigenous | 73 | 34 | 107 | 72 | 25 | 97 | 103 | 27 | 130 | |
| Non-Indigenous | 239 | 103 | 342 | 202 | 86 | 288 | 304 | 108 | 412 | |
| Total | 312 | 137 | 449 | 274 | 111 | 385 | 407 | 135 | 542 | |
| Adult | | | | | | | | | | |
| Indigenous | 188 | 91 | 279 | 282 | 86 | 368 | 328 | 103 | 431 | |
| Non-Indigenous | 1 809 | 534 | 2 343 | 2 722 | 423 | 3 145 | 3 314 | 491 | 3 805 | |
| Total | 1 997 | 625 | 2 622 | 3 004 | 509 | 3 513 | 3 642 | 594 | 4 236 | |
| Total | 2 309 | 762 | 3 071 | 3 278 | 620 | 3 898 | 4 049 | 729 | 4 778 | |
| |
| ACT Policing, Annual Report, 2004-05; and ACT Policing, Annual Report, 2005-06. |
PRISONERS
The ACT has two remand centres for unsentenced prisoners and a periodic detention centre. Periodic detention is a sentencing option, which, at the time of the 30 June 2006 National Prisoner Census, was available only to NSW and ACT courts. Persons given periodic detention are in custody for two consecutive days in a week (periodic detainee week) and remain at liberty during the rest of the week. With the exception of some sentenced 'fine default only' prisoners, persons sentenced to full-time custody by ACT criminal courts are held in NSW prisons.
In 2006, the ACT had a total of 218 prisoners, a decrease of 21% from the number of ACT prisoners in 2005 (275 prisoners). In 2006, slightly less than half of ACT prisoners were held in the ACT (48% or 104 prisoners) with the remainder held in NSW (52% or 114 prisoners). Of those prisoners held in the ACT, 58% (60 prisoners) were Sentenced and 42% (44 prisoners) were Unsentenced.
9.7 NUMBER OF PRISONERS - 2006 |
| |
| ACT in ACT | ACT in NSW(a) | ACT Total | Australia(b) | |
| |
| Males | 97 | 106 | 203 | 23 963 | |
| Females | 7 | 8 | 15 | 1 827 | |
| Indigenous | 13 | 13 | 26 | 6 091 | |
| Non-Indigenous | 89 | 99 | 188 | 19 470 | |
| Unknown(c) | 2 | 2 | 4 | 229 | |
| Sentenced | 60 | 114 | 174 | 20 209 | |
| Unsentenced | 44 | - | 44 | 5 581 | |
| All prisoners | 104 | 114 | 218 | 25 790 | |
| |
| - nil or rounded to zero (including null cells) |
| (a) The majority of full-time prisoners sentenced in the ACT are held in NSW prisons. |
| (b) The ACT in NSW figures are a subset of the NSW figures and are not separately counted in the Australian totals. |
| (c) Refers to persons whose Indigenous status is unknown. |
| Prisoners in Australia, 2006 (cat. no. 4517.0). |
Imprisonment rates
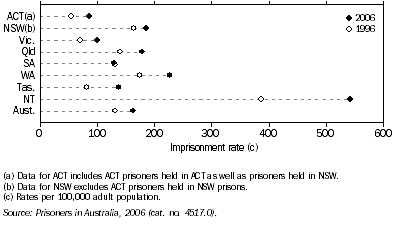
In 2006, the ACT recorded the lowest Imprisonment rate of all the states and territories (86 prisoners per 100,000 adult population), slightly more than half the overall national Imprisonment rate (163 prisoners per 100,000 adult population). The ACT Imprisonment rate in 2006 was at its lowest level since 1999, when the ACT recorded an Imprisonment rate of 83 prisoners per 100,000 adult population.
Between 2005 and 2006, the ACT's Imprisonment rate fell by 22%, the largest proportional decrease of all the states and territories. However, this decrease was due largely to a change in the way the ACT counts its periodic detainees, i.e. periodic detainees who were in breach of an order for more than three months are now excluded.
Nationally, the Imprisonment rate rose by just less than 1% between 2005 and 2006, even though decreases were recorded in five of the eight states and territories.
Between 1996 and 2006, increases in Imprisonment rates were recorded in all states and territories except for SA, where there was a slight decrease. Over that period, the ACT Imprisonment rate increased by 57%, the second-largest proportional increase recorded over the period. Only Tasmania recorded a larger proportional increase in its Imprisonment rate (up by 68%). Nationally, the Imprisonment rate increased by 23% between 1996 and 2006.
9.8 imprisonment rate - 1996 and 2006
COMMUNITY-BASED CORRECTIONS
Community-based corrections orders are non-custodial orders under the authority of the various state and territory Corrective Services departments. They can include restricted movement, fine options, community service, parole, bail and sentenced probation.
In the ACT, the average number of persons in community-based corrections on the first day of each month for 2006 was 1,082, 46 persons (4%) fewer than for 2005 (1,128 persons). Nationally, the average number of persons in community-based corrections on the first day of each month for 2006 was 51,981, a decrease of 2% (801 persons) when compared with 2005.
9.9 PERSONS IN COMMUNITY-BASED CORRECTIONS(a)(b) |
| |
| Average daily number | Rate per 100,000 population | |
| ACT | Australia(c) | ACT | Australia | |
| no. | no. | rate | rate | |
Males | |
| |
| 2001 | 1 092 | 45 515 | 940.03 | 627.91 | |
| 2002 | 1 036 | 43 306 | 875.09 | 590.97 | |
| 2003 | 989 | 41 337 | 826.89 | 556.22 | |
| 2004 | 937 | 41 549 | 776.75 | 550.35 | |
| 2005(d)(e) | 954 | 43 081 | 783.20 | 563.28 | |
| 2006 | 914 | 42 438 | 740.53 | 547.25 | |
Females | |
| |
| 2001 | 238 | 10 176 | 200.21 | 136.70 | |
| 2002 | 194 | 9 632 | 156.72 | 126.82 | |
| 2003 | 167 | 9 080 | 133.63 | 117.86 | |
| 2004 | 164 | 9 118 | 130.66 | 116.91 | |
| 2005(d)(e) | 174 | 9 565 | 137.39 | 121.32 | |
| 2006 | 168 | 9 447 | 130.78 | 118.43 | |
Persons(f) | |
| |
| 2001 | 1 330 | 56 000 | 565.93 | 381.14 | |
| 2002 | 1 230 | 53 203 | 508.18 | 356.51 | |
| 2003 | 1 156 | 50 787 | 472.15 | 335.55 | |
| 2004 | 1 102 | 51 049 | 447.09 | 332.60 | |
| 2005(d)(e) | 1 128 | 52 782 | 454.07 | 339.83 | |
| 2006 | 1 082 | 51 981 | 430.05 | 330.41 | |
| |
| (a) Number on the first day of month calculated as a simple average, where the figures for each month are added and the total divided by twelve. |
| (b) The number of persons in community-based corrections includes those persons with breached or suspended orders. |
| (c) Prior to the September quarter 2002, some over enumeration may have occurred. |
| (d) As of 1 July 2005, the definition of an adult changed in Victoria to a person aged 18 years and over. |
| (e) Data movements from the June quarter 2005 may be influenced by data entry delays. |
| (f) Includes persons whose sex is unknown. |
| Corrective Services, Australia, December quarters 2003, 2004, 2005 and 2006 (cat. no. 4512.0). |
Community-based correction rates in the ACT in 2006 were higher than the national rates. For persons in community-based corrections in the ACT, the rate was 430 community-based corrections per 100,000 adult population, compared with 330 persons per 100,000 adult population nationally.
The community-based correction rate for males in the ACT in 2006 was 741 community-based corrections per 100,000 adult male population, compared with 547 per 100,000 adult male population nationally. For females in the ACT there were 131 community-based corrections per 100,000 adult female population, compared with 118 females per 100,000 adult female population nationally.
PERIODIC DETENTION
Prisoners in periodic detention are required to be held in custody for two consecutive days each week. Periodic detention is a form of custody currently used only in NSW and ACT.
Each day during 2006, there were on average 55 prisoners in periodic detention in the ACT, down from an average of 82 prisoners in 2005 (a decrease of 33%). Over the same period, the average number of prisoners in periodic detention in NSW fell from 835 to 748, a decrease of 10%.
In 2006, the rate of imprisonment for persons in periodic detention in the ACT was 22 per 100,000 adult population, while for NSW it was 14 prisoners per 100,000 adult population. In 2005, the rates for both the ACT and NSW were higher, at 33 per 100,000 population and 16 per 100,000 population respectively.
9.10 PERSONS IN PERIODIC DETENTION |
| |
| | Average Daily Number | Prisoners per 100,000 Adult Population | |
| | NSW | ACT | Total | NSW | ACT | |
| | no. | no. | no. | rate | rate | |
Periodic detainees | |
| |
| Males | | | | | | |
| 2001 | 974 | 66 | 1 040 | 40.1 | 56.5 | |
| 2002 | 831 | 66 | 897 | 33.7 | 55.5 | |
| 2003 | 739 | 73 | 811 | 29.7 | 60.7 | |
| 2004 | 687 | 89 | 775 | 27.3 | 73.7 | |
| 2005 | 762 | 76 | 838 | 30.0 | 62.6 | |
| 2006 | 684 | 52 | 736 | 26.6 | 42.2 | |
| Females | | | | | | |
| 2001 | 87 | 4 | 91 | 3.5 | 3.3 | |
| 2002 | 68 | 4 | 72 | 2.7 | 3.6 | |
| 2003 | 60 | 4 | 64 | 2.3 | 3.0 | |
| 2004 | 62 | 4 | 66 | 2.4 | 3.3 | |
| 2005 | 73 | 6 | 79 | 2.8 | 4.7 | |
| 2006 | 64 | 3 | 67 | 2.4 | 2.2 | |
| Persons | | | | | | |
| 2001 | 1 061 | 70 | 1 130 | 21.5 | 29.6 | |
| 2002 | 899 | 70 | 969 | 17.9 | 29.0 | |
| 2003 | 799 | 76 | 875 | 15.8 | 31.1 | |
| 2004 | 749 | 93 | 842 | 14.6 | 37.8 | |
| 2005 | 835 | 82 | 917 | 16.2 | 33.1 | |
| 2006 | 748 | 55 | 802 | 14.3 | 21.8 | |
| |
| Corrective Services, Australia, December quarters 2003, 2004, 2005 and 2006 (cat. no. 4512.0). |