CONSUMPTION
Household final consumption expenditure, (from Table 3.1) Seasonally adjusted
- Chain volume measures
: Quarterly % change
Household final consumption expenditure, (from Table 3.1) Seasonally adjusted
- Chain volume measures
: Quarterly % change
Household final consumption expenditure, Chain volume measures(a) |
|
| Period | Food | Cigarettes and tobacco | Alcoholic beverages | Clothing and footwear | Rent and other dwelling services | Electricity, gas and other fuel | Furnishings and household equipment | Health | Purchase of vehicles | Operation of vehicles | Transport services | Commun-
ications | Recreation and culture | Education services | Hotels, cafes and restaurants | Insurance and other financial services | Other goods and services | Total |
Annual ($ million) |
|
| 2005-06 | 63 050 | 10 768 | 11 533 | 19 963 | 98 978 | 11 625 | 29 392 | 29 589 | 20 478 | 32 173 | 13 477 | 15 881 | 66 056 | 19 453 | 43 130 | 40 075 | 36 679 | 562 227 |
| 2006-07 | 64 933 | 10 358 | 11 987 | 21 171 | 102 205 | 12 019 | 31 650 | 31 284 | 21 563 | 32 645 | 14 331 | 15 971 | 69 046 | 20 035 | 44 639 | 41 771 | 39 265 | 584 874 |
| 2007-08 | 66 792 | 10 439 | 12 257 | 22 258 | 104 864 | 12 663 | 33 706 | 33 068 | 23 057 | 32 622 | 15 127 | 16 723 | 73 236 | 20 608 | 45 635 | 42 761 | 40 468 | 606 284 |
Percentage change from previous year |
|
| 2005-06 | 1.5 | -3.2 | 3.3 | 3.9 | 3.6 | 2.5 | 2.2 | 2.4 | 2.1 | -5.1 | 0.7 | 6.1 | 5.0 | 2.8 | 3.3 | 4.4 | 1.8 | 2.6 |
| 2006-07 | 3.0 | -3.8 | 3.9 | 6.0 | 3.3 | 3.4 | 7.7 | 5.7 | 5.3 | 1.5 | 6.3 | 0.6 | 4.5 | 3.0 | 3.5 | 4.2 | 7.0 | 4.0 |
| 2007-08 | 2.9 | 0.8 | 2.3 | 5.1 | 2.6 | 5.4 | 6.5 | 5.7 | 6.9 | -0.1 | 5.6 | 4.7 | 6.1 | 2.9 | 2.2 | 2.4 | 3.1 | 3.7 |
Seasonally adjusted ($ million) |
|
| 2006-2007 |  | | | | | | | | | | | | | | | | | |
| December | 16 162 | 2 582 | 2 976 | 5 272 | 25 470 | 3 001 | 7 849 | 7 833 | 5 234 | 8 162 | 3 574 | 3 997 | 17 196 | 4 991 | 11 136 | 10 396 | 9 912 | 145 775 |
| March | 16 416 | 2 620 | 3 038 | 5 309 | 25 667 | 3 007 | 8 000 | 7 955 | 5 524 | 8 221 | 3 576 | 4 010 | 17 332 | 5 033 | 11 277 | 10 504 | 9 968 | 147 376 |
| June | 16 337 | 2 575 | 3 051 | 5 417 | 25 812 | 3 043 | 8 080 | 8 006 | 5 630 | 8 127 | 3 684 | 4 036 | 17 521 | 5 057 | 11 251 | 10 554 | 10 003 | 148 263 |
| 2007-2008 | | | | | | | | | | | | | | | | | | |
| September | 16 284 | 2 606 | 3 087 | 5 547 | 25 969 | 3 090 | 8 271 | 8 065 | 5 633 | 8 185 | 3 714 | 4 034 | 18 187 | 5 098 | 11 371 | 10 589 | 10 081 | 149 812 |
| December | 16 834 | 2 600 | 3 062 | 5 529 | 26 125 | 3 151 | 8 425 | 8 282 | 5 860 | 8 164 | 3 831 | 4 156 | 18 299 | 5 131 | 11 480 | 10 649 | 10 117 | 151 694 |
| March | 16 882 | 2 619 | 3 041 | 5 608 | 26 282 | 3 206 | 8 527 | 8 328 | 5 804 | 8 223 | 3 822 | 4 263 | 18 413 | 5 181 | 11 419 | 10 726 | 10 122 | 152 465 |
| June | 16 793 | 2 613 | 3 069 | 5 573 | 26 439 | 3 216 | 8 483 | 8 394 | 5 761 | 8 050 | 3 760 | 4 270 | 18 336 | 5 198 | 11 365 | 10 797 | 10 147 | 152 263 |
| 2008-2009 | | | | | | | | | | | | | | | | | | |
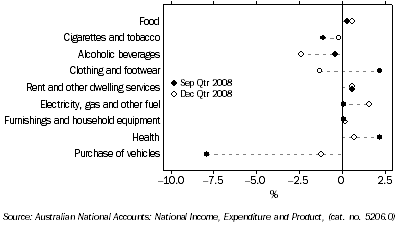
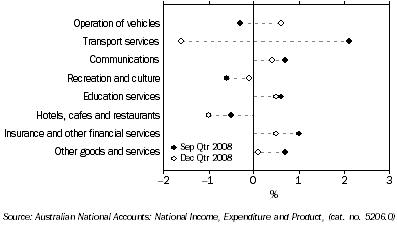
| September | 16 846 | 2 583 | 3 058 | 5 696 | 26 598 | 3 219 | 8 491 | 8 576 | 5 307 | 8 029 | 3 838 | 4 299 | 18 225 | 5 229 | 11 303 | 10 906 | 10 218 | 152 424 |
| December | 16 939 | 2 577 | 2 986 | 5 622 | 26 757 | 3 270 | 8 510 | 8 640 | 5 241 | 8 079 | 3 779 | 4 316 | 18 211 | 5 257 | 11 186 | 10 956 | 10 231 | 152 556 |
Percentage change from previous quarter |
|
| 2007-2008 | | | | | | | | | | | | | | | | | | |
| September | -0.3 | 1.2 | 1.2 | 2.4 | 0.6 | 1.6 | 2.4 | 0.7 | 0.0 | 0.7 | 0.8 | 0.0 | 3.8 | 0.8 | 1.1 | 0.3 | 0.8 | 1.0 |
| December | 3.4 | -0.2 | -0.8 | -0.3 | 0.6 | 2.0 | 1.9 | 2.7 | 4.0 | -0.3 | 3.2 | 3.0 | 0.6 | 0.6 | 1.0 | 0.6 | 0.4 | 1.3 |
| March | 0.3 | 0.7 | -0.7 | 1.4 | 0.6 | 1.7 | 1.2 | 0.6 | -1.0 | 0.7 | -0.3 | 2.6 | 0.6 | 1.0 | -0.5 | 0.7 | 0.0 | 0.5 |
| June | -0.5 | -0.2 | 0.9 | -0.6 | 0.6 | 0.3 | -0.5 | 0.8 | -0.7 | -2.1 | -1.6 | 0.2 | -0.4 | 0.3 | -0.5 | 0.7 | 0.3 | -0.1 |
| 2008-2009 | | | | | | | | | | | | | | | | | | |
| September | 0.3 | -1.1 | -0.4 | 2.2 | 0.6 | 0.1 | 0.1 | 2.2 | -7.9 | -0.3 | 2.1 | 0.7 | -0.6 | 0.6 | -0.5 | 1.0 | 0.7 | 0.1 |
| December | 0.6 | -0.2 | -2.4 | -1.3 | 0.6 | 1.6 | 0.2 | 0.7 | -1.2 | 0.6 | -1.6 | 0.4 | -0.1 | 0.5 | -1.0 | 0.5 | 0.1 | 0.1 |
|
| (a) Reference year 2006-07. |
| Source: Australian National Accounts: National Income, Expenditure and Product, (cat. no. 5206.0) |
 Print Page