INDUSTRIAL PRODUCTION
Industrial production volume index, (from Table 10.6) 2005 = 100
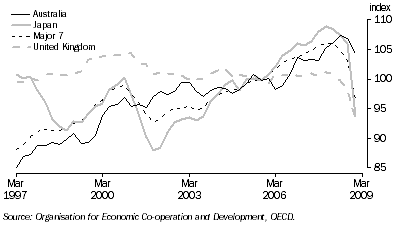
Industrial production volume index |
|
| Period | United States | Japan | Germany | France | Italy | United Kingdom | Canada | OECD Major 7(a) | India | Russia | Australia |
Annual (2005 = 100.0) |
|
| 2005-06 | 101.1 | 101.7 | 102.6 | 100.2 | 101.9 | 100.1 | 100.7 | 101.3 | 104.7 | 102.7 | 99.2 |
| 2006-07 | 103.0 | 105.7 | 109.1 | 101.5 | 105.6 | 100.7 | 99.5 | 104.0 | 116.7 | 110.2 | 102.7 |
| 2007-08 | 104.1 | 108.2 | 114.3 | 102.8 | 106.5 | 100.6 | 97.8 | 105.6 | 125.2 | 116.2 | 105.5 |
Seasonally adjusted (2005 = 100.0) |
|
| 2006-2007 |  | | | | | | | | | | |
| March | 103.0 | 105.7 | 109.9 | 101.8 | 106.3 | 100.4 | 99.9 | 104.2 | 118.5 | 110.4 | 103.2 |
| June | 103.6 | 106.4 | 111.2 | 101.9 | 106.0 | 101.0 | 100.3 | 104.8 | 121.0 | 112.8 | 103.3 |
| 2007-2008 | | | | | | | | | | | |
| September | 104.2 | 108.1 | 113.2 | 103.0 | 106.9 | 100.5 | 100.0 | 105.7 | 122.1 | 114.2 | 103.2 |
| December | 104.4 | 108.8 | 114.1 | 103.2 | 105.8 | 101.2 | 98.5 | 105.9 | 124.6 | 115.4 | 105.1 |
| March | 104.5 | 108.4 | 115.4 | 103.3 | 107.4 | 100.9 | 96.6 | 106.0 | 126.7 | 116.3 | 106.2 |
| June | 103.2 | 107.4 | 114.5 | 101.5 | 105.9 | 99.7 | 95.9 | 104.9 | 127.3 | 119.0 | 107.4 |
| 2008-2009 | | | | | | | | | | | |
| September | 100.8 | 106.1 | 113.3 | 100.7 | 102.6 | 98.0 | 95.5 | 103.0 | 127.9 | 119.3 | 106.8 |
| December | 97.5 | 93.6 | 105.3 | 94.1 | 94.8 | 93.6 | 92.0 | 96.8 | 125.4 | 108.5 | 104.3 |
| March | nya | nya | nya | nya | nya | nya | nya | nya | nya | nya | nya |
|
| nya not yet available |
| (a) The OECD Major 7 consists of Canada, France, Germany, Italy, Japan, the United Kingdom and the United States of America. |
| Source: Organisation for Economic Co-operation and Development, OECD. |
 Print Page