OVERVIEW
In 2010-11, the estimate of cultural expenditure by the Australian Capital Territory Government fell 4% to $89.3m which was 3% of the total cultural expenditure by state and territory governments. Over three-quarters (79%) of cultural expenditure by the Australian Capital Territory Government was for recurrent activities. The estimate of per person expenditure by the Australian Capital Territory Government was $245.30. (Tables 4 and 12)
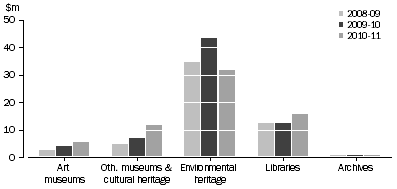
In 2010-11, the estimate of expenditure by the Australian Capital Territory Government on Heritage activities decreased by 3% to $65.9m. Expenditure on Environmental heritage accounted for the largest proportion (48%) of Heritage funds, but there was a 27% decrease in the category in the past year. Expenditure on Other museums and cultural heritage and Art museums increased (63% and 35% respectively) in 2010-11.
ACT GOVERNMENT HERITAGE EXPENDITURE
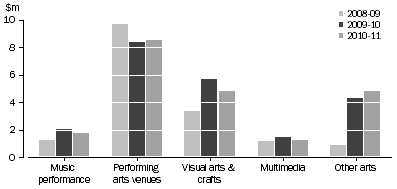
In 2010-11, the estimate of expenditure of Australian Capital Territory funds on Arts activities went down by 6% to $23.4m. Performing arts venues accounted for 36% of all Arts expenditure in 2010-11. Expenditure on Visual arts and crafts decreased 15% to $4.8m.
ACT GOVERNMENT ARTS EXPENDITURE, By selected categories
 Quality Declaration
  Print Page
 Print All