Aboriginal and Torres Strait Islander people have low levels of access to, and use of, health services such as Medicare, the Pharmaceutical Benefits Scheme (PBS) and private GPs (Bell et al. 2000; Keys Young 1997). They face a number of barriers to accessing services including distance from services, lack of transport (particularly in remote areas), financial difficulties and proximity of culturally appropriate services. The relatively low proportion of Indigenous people involved in health-related professions can also affect use of health services by Aboriginal and Torres Strait Islander people.
Availability of health professionals, services and facilities
The supply of medical professionals per head of population decreased with increasing geographic remoteness. In 2002, there were about twice as many medical practitioners per person in major cities as in the most remote areas, however, the supply of nurses was similar across remoteness categories. The supply of medical specialists per person in capital cities was more than ten times that in remote areas (table 10.2). This limits access to health professionals for people in rural and remote areas, where a high proportion of Indigenous Australians live. They therefore are more likely to have to move or travel substantial distances in order to get access to specialists, or may be forced to visit specialists less regularly than other Australians.
6.2 Health professionals per 100,000 persons(a) - 2001 and 2002 |
|  |
| Medical practitioners (2002) | Major cities | Inner regional | Outer regional | Remote | Very remote | Australia(b) | |
| |
| Clinicians | 288 | 169 | 138 | 130 | 134 | 254 | |
| Primary care | 105 | 90 | 80 | 86 | 93 | 111 | |
| Hospital non-specialist | 29 | 14 | 15 | 19 | 28 | 25 | |
| Specialist | 114 | 55 | 35 | 19 | 10 | 90 | |
| Specialist in training | 40 | 10 | 8 | 6 | 3 | 28 | |
| Non-clinician | 24 | 78 | 8 | 10 | 7 | 21 | |
| Total | 312 | 176 | 146 | 140 | 141 | 275 | |
| Nurses (2001) | 1 059 | 1 109 | 1 058 | 1 034 | 959 | 1 176 | |
| |
| (a) Based on full-time equivalent (FTE) rate. |
| (b) Includes medical practitioners who did not report the regions in which they worked. |
| AIHW 2004d, 2003c |
| The geographical classification used to present data has changed since the previous edition of this publication. The 2003 edition used the Rural, Remote and Metropolitan Areas (RRMA) classification to differentiate between regions. |
The availability of health professionals, health promotion programs and health training courses can be a challenge to Aboriginal and Torres Strait Islander communities. Detailed information about the availability of health services for people living in discrete Indigenous communities is collected in the Community Housing and Infrastructure Needs Survey (CHINS). The 2001 CHINS collected data on a total of 1,216 discrete communities with a combined population of approximately 109,000 (ABS 2002a). Approximately 85% of these people lived in very remote areas of Australia.
Distance to health services
Indigenous Australians are more likely to live outside urban areas, and are therefore more likely to live further from health services, than are other Australians. Aboriginal Community Controlled Health Services, operating in many parts of the country, including remote areas, go some way to addressing the gaps in health service provision for a more geographically dispersed population.
In 2001, more than three-quarters of all discrete Indigenous communities (943 communities or 78%) were located 50km or more from the nearest hospital. These represented 62% (67,131) of the reported population living in discrete Indigenous communities. The Northern Territory, Western Australia and South Australia had the highest proportion of communities located 50km or more from the nearest hospital.
One-half of all discrete Indigenous communities (606 communities with a combined population of 11,581 people) were located 25km or more from the nearest community health centre and 10km or more from the nearest hospital (table 10.3). States and territories with the highest proportion of Indigenous communities located 25km or more from the nearest community health centre were the Northern Territory (54%), Queensland (51%) and Western Australia (49%).
6.3 Distance to nearest hospital and community health centre - 2001 |
| |
| | | | NSW | Qld | SA | WA | NT | Australia | |
| |
| Discrete communities located less than 10km from nearest hospital | no. | 33 | 22 | 11 | 27 | 34 | 127 | |
| Discrete communities located 10km or more from nearest hospital | | | | | | | | |
| Distance to nearest community health centre | | | | | | | | |
| | Less than 25km | no. | 17 | 48 | 43 | 117 | 254 | 481 | |
| | 25km or more | no. | 10 | 72 | 42 | 139 | 342 | 606 | |
| | Total | no. | 27 | 120 | 85 | 256 | 596 | 1 087 | |
| Total number of communities(a) | no. | 60 | 142 | 96 | 283 | 632 | 1 216 | |
| Total population(a) | no. | 7 771 | 30 961 | 5 226 | 16 558 | 47 233 | 108 085 | |
| Proportion 10km or more from nearest hospital and 25km or more from nearest community health centre | | | | | | | | |
| Communities | % | 16.7 | 50.7 | 43.8 | 49.1 | 54.1 | 49.8 | |
| Population | % | 9.9 | 3.0 | 14.7 | 17.4 | 12.7 | 10.7 | |
| |
| (a) There are no discrete Indigenous communities in the ACT. Tasmania and Victoria are included in the total. |
| ABS, 2001 CHINS |
Of the 109,000 Indigenous people ( in 1,216 communities) that were surveyed, 3,255 people (174 communities) were located 100km away from either a hospital or a community health centre.
Transport
While distance to various health services provides one measure of access, lack of transport can often mean that even comparatively short distances are an impediment to service use. Data are available from the 2001 Census on the number of vehicles per household and from the 2002 National Aboriginal and Torres Strait Islander Social Survey (NATSISS) - a survey of 9,400 Indigenous people aged 15 years or over - on access to motor vehicles and difficulties with transport.
The Census shows that households with Indigenous person(s) were more likely than other households to be without a vehicle in 2001. The proportion of households with Indigenous person(s) without a vehicle was 23%, compared with 10% for other households. Households with Indigenous person(s) in the remote and very remote regions were most likely to report having no vehicle.
Data from the 2002 NATSISS reveal that around 60% of Indigenous people aged 18 years or over had access to a motor vehicle to drive compared to 85% of non-Indigenous people (table 10.4). Around 12% of Indigenous Australians reported that they could not or often had difficulty getting to places needed, compared with only 4% of non-Indigenous Australians.
6.4 Transport access, Persons aged 18 years or over - 2002 |
| |
| | | Indigenous | Non-Indigenous | |
| | | Remote | Non-remote | Total | Total | |
| |
| Transport access | | | | | | |
| Has access to motor vehicles to drive | % | 47.5 | 64.4 | 59.7 | 85.2 | |
| Difficulty with transport(a) | | | | | | |
| Can easily get to places needed | % | 65.2 | 73.5 | 71.2 | 84.4 | |
| Cannot get to places needed | % | 16.4 | 9.8 | 11.6 | 3.6 | |
| Persons aged 18 years or over | no. | 69 300 | 182 100 | 251 400 | 14 353 800 | |
| |
| (a) Not all categories are shown for this data item. |
| ABS, 2002 NATSISS and 2002 GSS. |
Indigenous Australians in every state and territory were less likely to report having access to a motor vehicle(s), and more likely to report having difficulty getting to places needed, than non-Indigenous Australians. Indigenous people living in the Northern Territory were five times as likely, and in Western Australia four times as likely, to be without access to a motor vehicle as non-Indigenous people in these states and territories (ABS, 2002 NATSISS).
The data on vehicles per household and per person suggest that non-Indigenous people generally have better access to personal transport than Indigenous people and would therefore be more readily able to reach a health facility or service. Public transportation may compensate for the lack of personal transport, and clinics may provide a transport service for their patients, but these services are not available everywhere.
Other factors affecting access
In this section, information is presented about some of the economic and cultural factors which can affect one’s access to services, including affordability, having private health insurance, proficiency in English, communication with service providers and possession of a working telephone.
AFFORDABILITY
Many health services provided outside of public hospitals involve direct out-of-pocket payments by patients. These impact more on people with limited economic means and, given the generally poorer economic position of Aboriginal and Torres Strait Islander peoples (Chapter 2), the effect is likely to be greater on Indigenous people than on other Australians. Examples of this are services provided by dentists, physiotherapists and other health professionals not covered by Medicare, and pharmaceuticals not covered by the PBS. These do not attract subsidies from governments and, therefore, patients meet out-of-pocket fees when these services are accessed.
If medical services subsidised under Medicare are not bulk-billed, patients can face co-payments. In the September quarter 2004, 69% of medical services were bulk-billed (DoHA 2004). Bulk-billing rates are generally lower in rural and remote areas than in capital cities or other metropolitan centres (SCRGSP 2003). Patients who are not bulk-billed are usually required to pay the full fee at the time of service and can then seek a refund from Medicare. This, however, means that they must first be able to pay for the service. This difficulty is further exacerbated by the fact that some practitioners charge fees above the Medicare Benefits Schedule fee, requiring larger gap payments, which are generally borne by the patients. Aboriginal Community Controlled Health Services are covered by Medicare and patients using these services are bulk-billed.
People for whom drugs are prescribed under the PBS are also required to make out-of-pocket co-payments. The amount that a patient needs to find is adjusted to some extent in accordance with the patient’s ability to pay. Different co-payments apply to concession card holders, pensioners and general patients. The PBS also has safety net provisions that protect individuals and families from large overall expenses for PBS medicines.
PRIVATE HEALTH INSURANCE
Lack of health insurance is a barrier to accessing private hospitals and the services of those health professionals who work solely or primarily within the private health system. In the 2001 National Health Survey (NHS), non-Indigenous people aged 18 years or over living in non-remote areas were three times more likely to report having private health insurance (including hospital and/or ancillary cover) than Indigenous people in non-remote areas (51% compared with 17%). The large gap between the Indigenous and non-Indigenous populations is due, at least in part, to the relative economic disadvantage of Indigenous Australians, as discussed in Chapter 2.
CULTURAL BARRIERS
Measurement of the accessibility of health services involves factors other than the distance people must travel and the financial costs incurred (Ivers et al. 1997). Many Indigenous people or communities do not have adequate access to either culturally appropriate services or to other suitable arrangements, and where culturally appropriate services exist they are often under-resourced or unable to meet community needs (Bell et al. 2000). The perception of cultural barriers may cause Aboriginal and Torres Strait Islander people to travel substantial distances in order to access health services delivered in a more appropriate manner than those available locally (Ivers et al. 1997). The willingness of Indigenous peoples to access health services may be affected by such factors as community control of the service, the gender of health service staff, and the availability of Aboriginal and Torres Strait Islander staff, particularly where the patient’s proficiency in spoken and written English is limited (Ivers et al. 1997). Some Indigenous people do not feel comfortable attending services such as a private general practice because of educational, cultural, linguistic and lifestyle factors, and will do so only when there is no alternative or their health problem has worsened (Bell et al. 2000).
LANGUAGE
Not being able to speak, read and write English proficiently can mean that some Indigenous Australians find it difficult to approach health and welfare services. They may therefore miss out on important information and entitlements and may have difficulty reading and completing forms (House of Representatives Standing Committee on Aboriginal and Torres Strait Islander Affairs 1993).
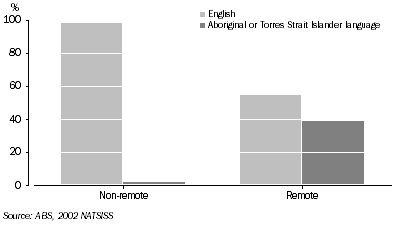
In the 2002 NATSISS, about 14% of Indigenous people aged 15 years or over reported that they spoke a language other than English as their main language at home. This figure includes 12% who said they spoke an Indigenous language at home (Chapter 2) and 2% who said they spoke another language or for whom the language was not adequately described. Indigenous people living in remote areas of Australia were much more likely to report speaking an Aboriginal or Torres Strait Islander language as their main language at home (39%) than those living in non-remote areas (2%) (graph 10.5).
6.5 Main language spoken at home, Indigenous persons aged 15 years and over - 2002
COMMUNICATING WITH SERVICE PROVIDERS
The 2002 NATSISS collected information on whether Indigenous Australians had difficulty communicating with service providers. Approximately 11% of males and females aged 18 years or over reported that they had difficulty understanding and/or being understood by service providers (table 10.6). Indigenous people living in remote areas were more likely to report experiencing difficulty (19%) than those in non-remote areas of Australia (8%). Indigenous Australians aged 55 years or over had the most difficulty understanding and/or being understood by services providers (14%) (ABS, 2002 NATSISS).
6.6 Communication with service providers, Indigenous persons aged 18 years or over - 2002 |
| |
| | Non-remote | Remote | Total | |
| | Males | Females | Males | Females | Males | Females | |
| |
| Has difficulty understanding service providers | % | 2.6 | 3.7 | 3.9 | 4.2 | 3.0 | 3.8 | |
| Has difficulty being understood by service providers | % | 3.0 | 1.8 | 4.6 | *3.8 | 3.5 | 2.4 | |
| Has difficulty understanding and being understood by service providers | % | 2.2 | 2.3 | 9.7 | 11.3 | 4.3 | 4.8 | |
| Total experiencing difficulty | % | 7.8 | 7.8 | 18.2 | 19.3 | 10.7 | 10.9 | |
| No difficulties | % | 92.2 | 92.2 | 81.5 | 80.1 | 89.2 | 88.9 | |
| Total(a) | % | 100.0 | 100.0 | 100.0 | 100.0 | 100.0 | 100.0 | |
| Indigenous persons aged 18 years or over | no. | 85 800 | 96 200 | 33 400 | 35 900 | 119 200 | 132 200 | |
| |
| * estimate has a relative standard error of 25% to 50% and should be used with caution |
| (a) Includes not stated responses. |
| ABS, 2002 NATSISS |
The proportion of Indigenous Australians who reported difficulty communicating with services providers varied by state and territory. Indigenous people in Western Australia (18%), South Australia (17%) and the Northern Territory (15%) were approximately twice as likely to experience difficulty communicating with service providers as those in New South Wales (8%), Victoria (9%) and Queensland (9%) (ABS, 2002 NATSISS).
TELEPHONE ACCESS
A working telephone in the home is often considered a necessity in cases of emergency so that health services such as hospitals, ambulances and doctors can be contacted quickly. People without a working telephone in the home are less equipped to seek urgent medical help when required.
In 2002, 71% of Indigenous Australians aged 18 years or over reported having a working telephone in the home. Those living in non-remote areas were more likely to have a working telephone (82%) than those living in remote areas (43%).
The proportion who had a working telephone varied by state and territory. The Northern Territory had the lowest proportion of Indigenous Australians with a working telephone (37%), which reflects the high proportion of Indigenous people in the Northern Territory who live in remote areas. Approximately 61% of people in Western Australia and 71% in South Australia were without a working telephone (ABS, 2002 NATSISS).
 Print Page
 Print All