CHARACTERISTICS OF NEW RESIDENTIAL DWELLINGS - A 15 YEAR SUMMARY
INTRODUCTION
This article presents information on the floor area and cost of new residential dwellings. It builds on a similar article published in the December 2008 issue of this publication.
The 'floor area' of a building is a measure of the amount of useable space in a building (and its attachments) at the final stage of its construction and is measured in square metres. The boundary of the recorded floor area of a building is delineated by the external perimeter of the exterior walls of the building. The area under un-enclosed verandahs, carport, etc, attached outside the exterior walls of one or more storeys, is excluded. The floor area of apartments is the total floor space of the building (including common areas and hallways) divided by the number of dwellings.
The 'cost' of building is a measure of the total value of the completed building, as provided by the respondent at the final stage of its construction and is measured in dollars. Direct costs associated with materials, labour, engineering and architectural services are included, as well as all costs associated with in-built fixtures and fittings. The cost and/or value of land is excluded, as is any landscaping.
Data are presented for the following types of buildings:
- 'Houses' - defined as detached buildings used for long term residential purposes, consisting of only one dwelling unit and are not a result of alterations or additions to a pre-existing building.
- 'Townhouses' - defined as semi-detached row or terrace houses attached in some structural way to one or more dwellings, with their own private grounds and no separate dwelling above or below.
- 'Flats, units or apartments' - defined as blocks of dwellings that don't have their own private grounds and usually share a common entrance, foyer or stairwell.
For further information refer to
Functional Classification of Buildings, 1999 (Revision 2011) (cat. no. 1268.0.55.001).
METHOD
| The data presented are from the Australian Bureau of Statistics (ABS) quarterly publication Building Activity, Australia. Data presented in this article are available in the 'Building Activity: Average Floor Area' and 'Building Activity: Average Cost' data cubes on the downloads tab. |
The proportion of survey records with floor area data that was not stated has varied annually between 9% and 25% of all residential dwellings and these have been excluded from the analyses. While fluctuating from year to year, the proportion of stated floor area has increased in recent years. Survey records with the following floor area data have been excluded from the analysis due to the unreliability of the data:
- Less than 25 square metres and greater than 1,800 square metres per dwelling for houses,
- Less than 25 square metres and greater than 800 square metres per dwelling for townhouses.
- Less than 25 square metres and greater than 300 square metres per dwelling for flats, units and apartments.
All dwellings under $50,000 have been excluded from the calculation of average cost.
Only Private sector dwellings have been included in this analysis.
CHARACTERISTICS OF NEW HOUSES
Average cost to build a new house
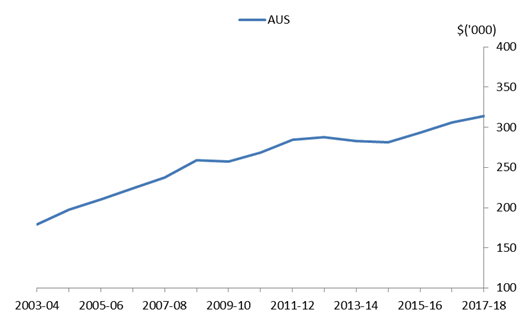
The average cost of building a house in Australia increased 74.8%, rising from $179,467 in 2003-04 to $313,775 in 2017-18. Over this period, the average annual increase was 5.3%. The rate of increase was greatest in the Australian Capital Territory, increasing from $202,921 in 2003-04 to $431,504 in 2017-18, an average annual rise of 8.0%. Queensland experienced the smallest growth rate in new house costs, from $177,551 in 2003-04 to $289,414 in 2017-18, an average annual rise of 4.5%. The cost to build a new house in 2017-18 in New South Wales was 11.0% higher than the national average.
In 2017-18, the Australian Capital Territory had the highest average cost to build a new house at $431,504, 37.5% higher than the national average. South Australia had the lowest average cost at $270,982.
Table 1: Average cost to build new house, by State and Territory
|
 | 2003-04 | 2010-11 | 2017-18 | 2003-04 to 2010-11 | 2010-11 to 2017-18 |
| State | $ ('000) | $ ('000) | $ ('000) | Annual change | Annual change |
|
| NSW | 210.3 | 307.3 | 348.4 | 6.6% | 1.9% |
| Vic. | 180.8 | 254.2 | 316.5 | 5.8% | 3.5% |
| Qld | 177.6 | 277.5 | 289.4 | 8.0% | 0.6% |
| SA | 147.3 | 219.9 | 271.0 | 7.0% | 3.3% |
| WA | 152.0 | 273.1 | 297.7 | 11.4% | 1.3% |
| Tas. | 150.3 | 224.4 | 291.5 | 7.0% | 4.3% |
| NT | 202.9 | 363.1 | 356.1 | 11.3% | -0.3% |
| ACT | 202.9 | 285.1 | 431.5 | 5.8% | 7.3% |
| Australia | 179.5 | 268.6 | 313.8 | 7.1% | 2.4% |
|
Graph 1: Average cost to build a new house, Australia
 | Graph 2: Average cost to build a new house, by State and Territory
 |
Average floor area of new houses
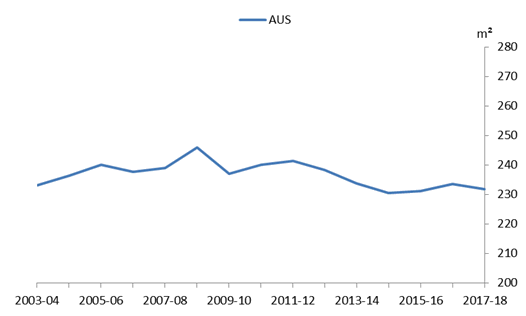
The national average of floor area of new houses over the 15 years to June 2018 has broadly remained unchanged, ranging from 230m
2 to 245m
2. The average floor space of constructed houses peaked in 2008-09 at 245.9m
2 and was lowest in 2014-15 at 230.6m
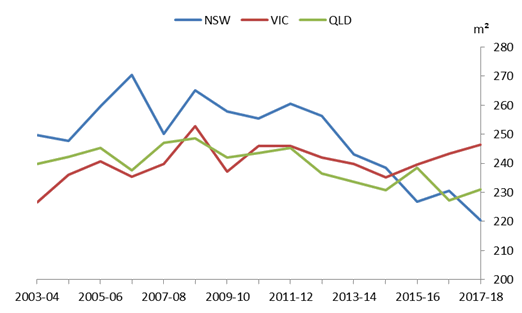
2. Of the mainland states, the size of New South Wales houses shrank the most over the period examined, decreasing 11.7% since 2003-04, or 0.8% annually on average. The size of houses in Victoria grew the most over the
period, increasing 8.7%, or 0.6% annually on average.
Over the 15 years to 2017-18, the average floor area of new houses decreased in the the Northern Territory (13.7%), New South Wales (11.7%), Queensland (3.6%) and Western Australia (0.6%). Average floor area of new houses increased in Victoria (8.7%), the Australian Capital Territory (3.4%), South Australia (0.6%) and Tasmania (0.4%).
The largest average floor area of new houses built in 2017-18 was found in Victoria at 246.4m
2. The smallest average floor area of a new house for 2017-18 was recorded in Tasmania with 188.3m
2.
Table 2: Average floor area of new houses, by State and Territory
|
 | 2003-04 | 2010-11 | 2017-18 | 2003-04 to 2010-11 | 2010-11 to 2017-18 |
| State | m² | m² | m² | Annual change | Annual change |
|
| NSW | 249.7 | 255.4 | 220.5 | 0.3% | -2.0% |
| Vic. | 226.7 | 246.0 | 246.4 | 1.2% | 0.0% |
| Qld | 239.7 | 243.5 | 231.0 | 0.2% | -0.7% |
| SA | 197.9 | 196.3 | 199.2 | -0.1% | 0.2% |
| WA | 237.9 | 239.2 | 236.5 | 0.1% | -0.2% |
| Tas. | 187.5 | 186.3 | 188.3 | -0.1% | 0.2% |
| NT | 222.5 | 244.8 | 192.0 | 1.4% | -3.1% |
| ACT | 234.6 | 203.6 | 242.5 | -1.9% | 2.7% |
| Australia | 233.2 | 240.0 | 231.9 | 0.4% | -0.5% |
|
Graph 3: Average floor area of new houses, Australia
 | Graph 4: Average floor area of new houses, by State and Territory
|
CHARACTERISTICS OF TOWNHOUSES
Average cost to build a new townhouse
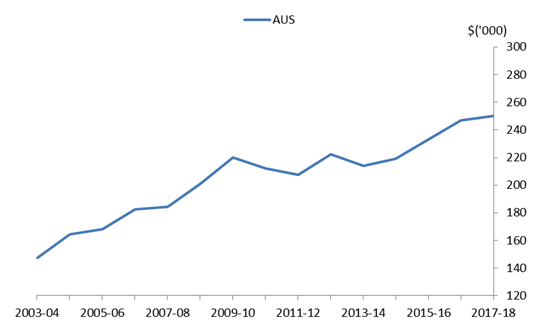
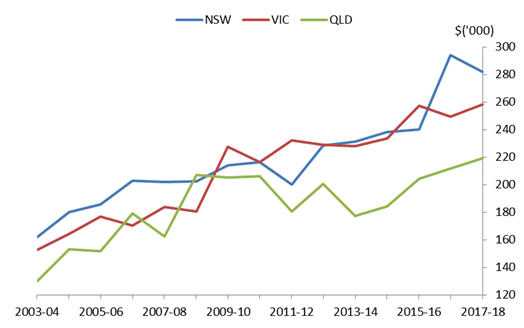
The average cost of building a new townhouse in Australia increased 69.8% over the past 15 years, rising from $147,365 in 2003-04 to $250,227 in 2017-18. Over this period the average annual increase was 5.0%. The rate of increase was greatest in Western Australia, increasing from $108,685 in 2003-04 to $233,046 in 2017-18, an average annual rise of 8.2%. South Australia experienced the smallest growth rate in new townhouse costs, from $146,788 in 2003-04 to $210,131 in 2017-18, an average annual rise of 3.1%. Costs to build townhouses were driven by New South Wales and Victoria, 12.8% and 3.2% higher than the national average respectively.
Table 3: Average cost to build a new townhouse, by State and Territory
|
 | 2003-04 | 2010-11 | 2017-18 | 2003-04 to 2010-11 | 2010-11 to 2017-18 |
| State | $ ('000) | $ ('000) | $ ('000) | Annual change | Annual change |
|
| NSW | 162.1 | 216.2 | 282.2 | 4.8% | 4.4% |
| Vic. | 152.5 | 216.6 | 258.3 | 6.0% | 2.8% |
| Qld | 130.1 | 206.4 | 219.2 | 8.4% | 0.9% |
| SA | 146.8 | 195.2 | 210.1 | 4.7% | 1.1% |
| WA | 108.7 | 215.1 | 233.0 | 14.0% | 1.2% |
| Tas. | 102.2 | 177.7 | 207.5 | 10.5% | 2.4% |
| NT | 221.6 | 328.0 | 332.0 | 6.9% | 0.2% |
| ACT | 163.5 | 202.2 | 259.7 | 3.4% | 4.1% |
| Australia | 147.4 | 211.9 | 250.2 | 6.3% | 2.6% |
|
Graph 5: Average cost to build a new townhouse, Australia
 | Graph 6: Average cost to build a new townhouse, by State and Territory
|
Average floor area of new townhouses
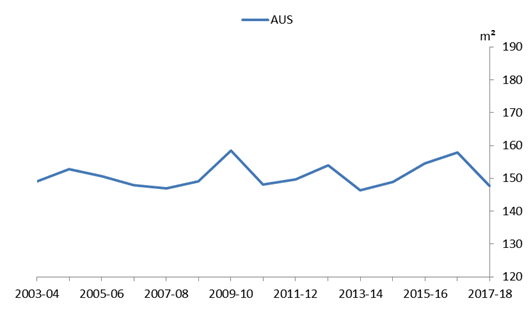
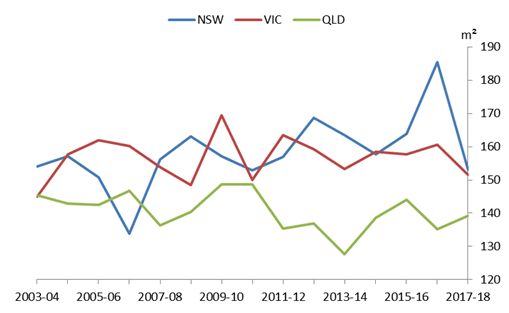
The national average of floor area of new townhouses over 15 years to June 2018 decreased only slightly (0.9%) and has ranged from 145m2 to 160m2. The average floor space of these dwellings peaked in 2009-10 at 158.5m2 and was lowest in 2013-14 at 146.3m2. Of the mainland states, the size of Queensland townhouses shrank the most over the period examined, decreasing 4.2% since 2003-04, or 0.3% annually on average. The size of townhouses in Victoria grew the most over the 15 year period, increasing 4.6%, or 0.3% annually on average.
From 2003-04 to 2017-18, the average floor area of new townhouses decreased in the Australian Capital Territory (32.8%), the Northern Territory (30.4%), Queensland (4.2%), New South Wales (0.6%) and Western Australia (0.1%). Average floor area increases occurred in Tasmania (35.8%), Victoria (4.6%) and South Australia (1.8%).
Table 4: Average floor area of new townhouses, by State and Territory
|
 | 2003-04 | 2010-11 | 2017-18 | 2003-04 to 2010-11 | 2010-11 to 2017-18 |
| State | m² | m² | m² | Annual change | Annual change |
|
| NSW | 154.0 | 153.0 | 153.0 | -0.1% | 0.0% |
| Vic. | 144.9 | 150.1 | 151.6 | 0.5% | 0.1% |
| Qld | 145.4 | 148.6 | 139.3 | 0.3% | -0.9% |
| SA | 150.9 | 143.3 | 153.7 | -0.7% | 1.0% |
| WA | 151.7 | 148.4 | 151.7 | -0.3% | 0.3% |
| Tas. | 99.0 | 114.9 | 134.4 | 2.3% | 2.4% |
| NT | 211.6 | 182.1 | 147.3 | -2.0% | -2.7% |
| ACT | 184.6 | 127.7 | 124.1 | -4.4% | -0.4% |
| Australia | 149.1 | 148.1 | 147.7 | -0.1% | 0.0% |
|
Graph 7: Average floor area of new townhouses, Australia
 | Graph 8: Average floor area of new townhouses, by State and Territory
 |
CHARACTERISTICS OF NEW APARTMENTS
Average cost to build a new apartment
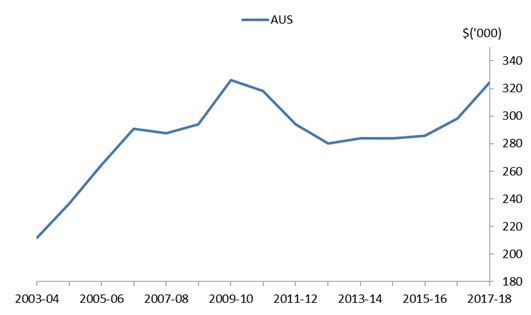
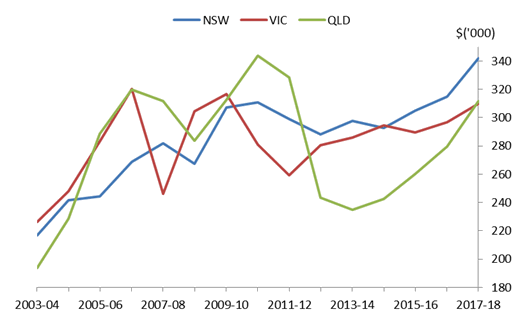
The average cost of building a new apartment in Australia increased by 53.0% over the past 15 years, rising from $211,999 in 2003-04 to $324,281 in 2017-18. Over this period the average annual increase was 3.8%. Queensland recorded a 60.8% increase in average cost to build a new apartment, one of the largest rates of increase. Victoria experienced the smallest growth rate in apartment construction costs, from $226,493 in 2003-04 to $309,740 in 2017-18, an average annual rise of 2.6%. Costs to build new apartments were driven primarily by New South Wales which was 5.5% higher than the national average in 2017-18.
Table 5: Average cost to build a new apartment, by State and Territory
|
 | 2003-04 | 2010-11 | 2017-18 | 2003-04 to 2010-11 | 2010-11 to 2017-18 |
| State | $ ('000) | $ ('000) | $ ('000) | Annual change | Annual change |
|
| NSW | 216.9 | 311.0 | 341.9 | 6.2% | 1.4% |
| Vic. | 226.5 | 281.0 | 309.7 | 3.4% | 1.5% |
| Qld | 193.7 | 343.9 | 311.6 | 11.1% | -1.3% |
| Australia | 212.0 | 318.1 | 324.3 | 7.1% | 0.3% |
|
Graph 9: Average cost to build a new apartment, Australia
 | Graph 10: Average cost to build a new apartment, by State and Territory
 |
Average floor area of new apartments
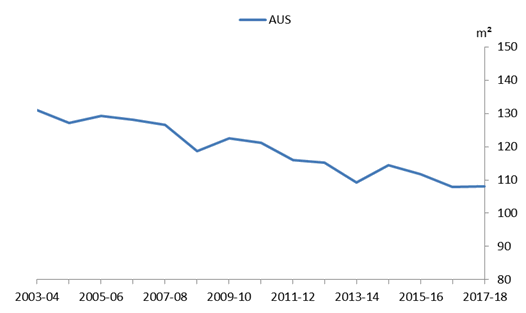
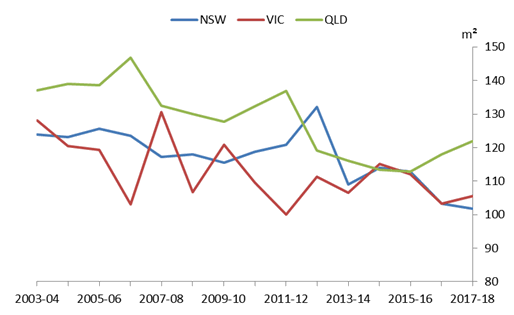
The national average of floor area of new apartment dwellings over 15 years decreased 17.5% from 131.0m2 in 2003-04 to 108.0m2 in 2017-18, averaging an annual decrease over this time of 1.3%. Of the mainland states, the size of New South Wales apartments decreased the most over 15 years, shrinking by 17.8% since 2003-04, or 1.3% annually on average. The average floor area of Queensland apartments decreased the least of the mainland states, falling only 11.1% over 15 years, or 0.8% annually on average.
Over the 15 years to 2017-18, the average floor area of a new apartment dwelling decreased New South Wales (17.8%), Victoria (17.7%) and Queensland (11.1%).
Table 6: Average floor area of new apartments, by State and Territory
|
 | 2003-04 | 2010-11 | 2017-18 | 2003-04 to 2010-11 | 2010-11 to 2017-18 |
| State | m² | m² | m² | Annual change | Annual change |
|
| NSW | 123.9 | 118.8 | 101.8 | -0.6% | -2.0% |
| Vic. | 128.2 | 109.7 | 105.5 | -2.1% | -0.5% |
| Qld | 137.2 | 132.3 | 122.0 | -0.5% | -1.1% |
| Australia | 131.0 | 121.2 | 108.1 | -1.1% | -1.5% |
|
Graph 11: Average floor area of new apartments, Australia
 | Graph 12: Average floor area of new apartments, by State and Territory
 |
CONCLUSION
The cost to build a new house, new townhouse or a new apartment has increased over the 15 year period examined, while the size of these dwellings has generally been flat, except for new apartments, whose size decreased 17.5%. Annual construction cost rises in the lead-up to the late 2000's financial crisis far outpaced the more modest cost increases of the past seven years.
Some upwards bias is present in the size of apartments and their cost to build, as it is difficult to adjust for non-residential floor space in large apartment towers that can include commercial space such as retail, office, or other mixed use components. Common areas such as foyers, lifts and resident amenities are also included which further increase the cost and size recorded in ABS surveys.
The size of houses built in New South Wales (-11.7%) and Victoria (+8.7%) have moved in opposite directions over the past 15 years. In comparison, changes to floor area of new houses in Queensland (-3.6%), South Australia (+0.7%), and Western Australia (-0.6%) have been minimal. |
 Print Page
 Print All
 Quality Declaration