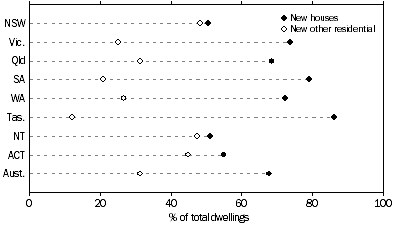
DWELLINGS APPROVED BY TYPE OF DWELLING 2007–08
STATES AND TERRITORIES
The number of dwelling units approved in the States and Territories during 2007-08 is shown in the table below, for each type of dwelling category.
 |  | NSW | Vic. | Qld | SA | WA | Tas. | NT | ACT | Aust. |  |
 |  | no. | no. | no. | no. | no. | no. | no. | no. | no. |  |
|  |
| New houses | 15 709 | 31 551 | 30 058 | 10 341 | 17 104 | 2 530 | 587 | 1 284 | 109 164 |  |
| New semidetached, row or terrace houses, townhouses etc of: |  |  |  |  |  |  |  |  |  |  |
 | One storey | 2 434 | 2 234 | 2 124 | 1 084 | 1 940 | 260 | 143 | 30 | 10 249 |  |
 | Two or more storeys | 3 158 | 3 279 | 3 691 | 768 | 968 | 22 | 32 | 164 | 12 082 |  |
 | Total | 5 592 | 5 513 | 5 815 | 1 852 | 2 908 | 282 | 175 | 194 | 22 331 |  |
| New flats, units, apartments in a building of: |  |  |  |  |  |  |  |  |  |  |
 | One or two storeys | 1 120 | 419 | 1 087 | 244 | 209 | 72 | 8 | 34 | 3 193 |  |
 | Three storeys | 1 228 | 908 | 1 633 | 14 | 319 | - | 13 | 142 | 4 257 |  |
 | Four or more storeys | 7 035 | 3 908 | 5 207 | 610 | 2 848 | - | 350 | 680 | 20 638 |  |
 | Total | 9 383 | 5 235 | 7 927 | 868 | 3 376 | 72 | 371 | 856 | 28 088 |  |
| Total new other residential building | 14 975 | 10 748 | 13 742 | 2 720 | 6 284 | 354 | 546 | 1 050 | 50 419 |  |
| Other |  |  |  |  |  |  |  |  |  |  |
 | Alterations and additions to residential building | 165 | 279 | 64 | 21 | 154 | 16 | 4 | - | 703 |  |
 | Conversion | 217 | 145 | 15 | 9 | 20 | 18 | 1 | - | 425 |  |
 | Non-residential building | 44 | 74 | 81 | 7 | 65 | 20 | 12 | 5 | 308 |  |
| Total building | 31 110 | 42 797 | 43 960 | 13 098 | 23 627 | 2 938 | 1 150 | 2 339 | 161 019 |  |
|  |
| - nil or rounded to zero (including null cells) |
SUMMARY COMMENT
Of the 161,019 dwelling units approved in Australia in 2007-08, 109,164 (67.8%) were new houses. In 2006-07 new houses accounted for 69.4% of dwellings units approved. Although new houses accounted for over 50% of approved dwellings units in each of the States and Territories, the mix of dwelling types varied significantly across the States and Territories. New houses accounted for over 70% of all dwelling units in Victoria (73.7%), South Australia (79.0%), Western Australia (72.4%) and Tasmania (86.1%).
DWELLINGS APPROVED, States and territories
- By type of dwelling
- 2007-08

 Quality Declaration
  Print Page
 Print All