Feature Article - Focus on the Tasmanian Construction Industry
DEFINING THE CONSTRUCTION INDUSTRY
The construction industry consists of those businesses engaged mainly in the construction of residential and non-residential buildings (including alterations and additions), engineering structures and related trade services. This includes, for example the construction of dwellings and recreational facilities, schools and hospitals, and infrastructure for transport, water and electricity supply and telecommunications.
Division E of the Australian and New Zealand Standard Industry Classification (ANZSIC) is devoted to the Construction industry and is subdivided into General construction and Construction trade services. General construction includes Building construction, which incorporates Residential building (houses, flats etc.), Non-residential building (offices, shops, hotels etc.) and Non-building or Engineering construction (roads, bridges etc.). Construction trade services includes Site preparation services and Building structure services (bricklaying, concreting etc.), Installation trade services (plumbing, electrical etc.), Building completion services (painting and decorating, glazing etc.) and Other construction services (landscaping etc.).
CONTRIBUTION TO GROSS STATE PRODUCT
In 2002-03 the Construction industry in Tasmania contributed 6.2% to Gross State Product (GSP), making it the fifth largest industry behind Manufacturing (13.7%), Health and community services (8.9%), Finance and insurance (6.6%) and Retail trade (6.4%). Nationally, construction contributed an estimated 6.7% to Gross Domestic Product (GDP) in 2002-03.
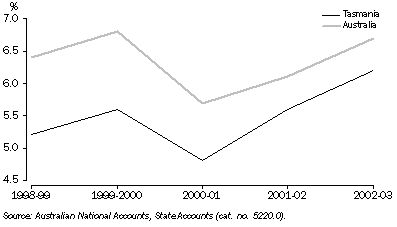
In Tasmania, over the past five years, this contribution has fluctuated from a low of 4.8% in 2000-01 to a high of 6.2% in 2002-03. The impact on the Construction industry of the introduction of The New Tax System in July 2000 can be seen in graph 1. There was an increase in construction activity in 1999-2000 as work was brought forward prior to the introduction of The New Tax System, followed by a larger downturn in 2000-01 after its implementation. The First Home Owners Grant (FHOG) and the Commonwealth Additional Grant (CAG) coincided with a recovery in construction activity from 2000-01. In 2002-03 the Construction industry's contribution to GSP reached its highest level for the last five years.
GRAPH 1. CONTRIBUTION OF CONSTRUCTION TO GSP AND GDP
ACTIVITY
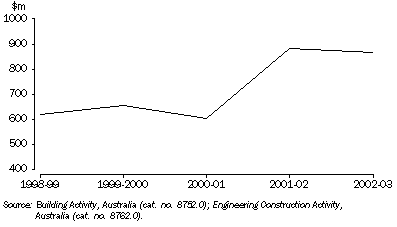
The value of construction activity in Tasmania, in current price terms, rose from $620.7 million in 1998-99 to $868.2 million in 2002-03, an increase of 39.9% over the five year period. Proportionally, growth in the value of the construction activity in Tasmania during this period exceeded growth at the Australian level (up 31.8%). In Tasmania the largest growth in this period occurred in 2001-02 when total construction activity increased 46.1%, three times the national increase of 15.1%. In 2002-03 construction activity in Tasmania fell 1.7%, while nationally it increased 20.5%
.
GRAPH 2. TOTAL CONSTRUCTION ACTIVITY, Value of Work Done - Tas.
Growth in the value of construction activity in Tasmania over the five years from 1998-99 to 2002-03 was driven mainly by Residential building. The value of Residential building activity rose from $181.4 million in 1998-99 to $318.8 million in 2002-03, an increase of 75.7%, compared to the Australian increase of 54.1%. Over this five year period, the value of work done on Houses in Tasmania increased 78.1% ($133.6 million). In 2002-03, Residential building activity accounted for 36.7% of total construction activity in Tasmania, lower than the Australian level of 44.5%.
After Residential building, Engineering construction experienced the next largest increase in value from $262.0 million in 1998-99 to $364.0 million in 2002-03, an increase of 38.9%. This was higher than the increase experienced at the Australian level where it rose 28.9% over the same period. In 2002-03 Engineering construction contributed 41.9% of total construction activity in Tasmania, compared to 34.4% nationally.
The value of Non-residential building activity in Tasmania also increased over the five years, from $177.3 million in 1998-99 to $185.4 million in 2002-03. This was an increase of 4.6% and compares to the national increase of 3.9%. In 2002-03 Non-residential building activity accounted for 21.4% of total construction activity in Tasmania, while nationally it contributed 21.0% to total national construction activity.
VALUE OF WORK DONE, Construction Industry - Tas. |
|  |
| | 1998-99 | 1999-2000 | 2000-01 | 2001-02 | 2002-03 | |
| Type of activity | $m | $m | $m | $m | $m | |
| |
| Residential building | | | | | | |
| Houses | 171.1 | 214.7 | 168.7 | 235.2 | 304.7 | |
| Other residential building | 10.3 | 19.3 | 19.2 | 24.8 | 14.1 | |
| Total | 181.4 | 234.0 | 187.9 | 260.0 | 318.8 | |
| Non-residential building | 177.3 | 164.9 | 152.3 | 169.2 | 185.4 | |
| Engineering construction | 262.0 | 254.0 | 264.2 | 453.8 | 364.0 | |
| Total construction | 620.7 | 652.9 | 604.4 | 883.0 | 868.2 | |
| |
| Source: Building Activity, Australia (cat. no. 8752.0); Engineering Construction Activity, Australia (cat. no. 8762.0). |
BUSINESS INVESTMENT
In the Tasmanina Construction industry, reported private new capital expenditure was at low levels from 1998-99 to 2000-01, however there was a substantial rise in 2001-02 and 2002-03.
PRIVATE NEW CAPITAL EXPENDITURE, Construction Industry - Tas. |
| |
| 1998-99 | 1999-2000 | 2000-01 | 2001-02 | 2002-03 | |
| $m | $m | $m | $m | $m | |
| |
| Total construction | 4 | 8 | 8 | 26 | 26 | |
| |
| Source: ABS data available on request, Private New Capital Expenditure and Expected Expenditure, Australia. |
EMPLOYMENT
NUMBER OF EMPLOYED PERSONS
In 2002-03 the Construction industry employed 6.0% of Tasmania's total workforce, making it the seventh largest employing industry behind Retail trade (16.1%), Health and community services (11.3%), Manufacturing (11.1%), Education (8.0%), Agriculture, Forestry and Fishing (7.9%) and Property and business services (7.5%). In 2002-03 the Construction industry in Tasmania employed 12,000 persons, 2.6% higher than in 1998-99. Nationally, employment in this sector increased 15.1%.
In 2002-03, of the 12,000 persons employed in the Tasmanian Construction industry, 70.8% were employed in Construction trade services and 29.2% were employed in General construction. Between 1998-99 and 2002-03, the number of persons employed in Construction trade services increased by 16.4%, while General construction fell by 20.5%.
NUMBER OF EMPLOYED PERSONS(a), Construction Industry - Tas. |
| |
| | 1998-99 | 1999-2000 | 2000-01 | 2001-02 | 2002-03 | |
| | ('000) | ('000) | ('000) | ('000) | ('000) | |
| |
| General construction | | | | | | |
| Building construction | 3.0 | 2.7 | 3.1 | 3.0 | 2.7 | |
| Non-building construction | 1.4 | 1.5 | 0.9 | 1.0 | 0.8 | |
| Total(b) | 4.4 | 4.2 | 4.0 | 4.0 | 3.5 | |
| Construction trade services | | | | | | |
| Site preparation services | 1.1 | 0.5 | 0.7 | 0.3 | 0.5 | |
| Building structure services | 0.7 | 0.7 | 0.5 | 0.9 | 0.8 | |
| Installation trade services | 2.9 | 2.6 | 3.2 | 2.7 | 2.7 | |
| Building completion services | 2.3 | 2.1 | 2.0 | 2.1 | 3.4 | |
| Other construction services | 0.4 | 0.4 | 0.7 | 0.8 | 1.1 | |
| Total(b) | 7.3 | 6.3 | 7.2 | 6.8 | 8.5 | |
| Construction(b) | 11.7 | 10.5 | 11.2 | 10.8 | 12.0 | |
| |
| (a) Average for year ending May. |
| (b) Discrepancies may occur between sums of industry components and totals due to rounding. |
| Source: ABS data available on request, Labour Force Survey, Australia. |
STATUS OF EMPLOYMENT
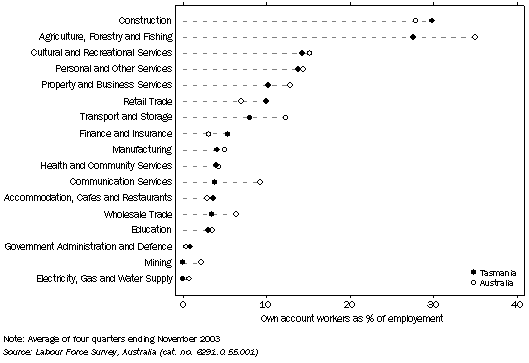
In 2002-03, 57.7% (7,100) of persons employed in the Tasmanian Construction industry were employees, compared to 65.5% nationally. The second highest percentage of workers were those engaged on an 'own account' basis and constituted 30.1% (3,700) of persons employed in Construction in Tasmania in 2002-03. This is above the national proportion of 27.9% (graph 3). Employers and Contributing family workers accounted for 10.6% (1,300 persons) and 1.6% (200 persons) of the Tasmanian Construction industry. Nationally their share of the Australian Construction industry was 6.0% and 0.6% respectively.
GRAPH 3. Own Account Workers as a Percentage of Industry Employment, 2002-03
HOURS WORKED
Persons employed in the Construction industry in Tasmania worked an average of 37.2 hours per week in 2002-03, compared to 38.4 hours per week nationally. In Tasmania, the average number of hours worked per week differed between General construction and Construction trade services in 2002-03. Persons employed in General construction worked an average of 38.1 hours per week, and those employed in Construction trade services working an average of 36.8 hours per week.
AVERAGE HOURS WORKED PER WEEK, Construction Industry - Tas. |
| |
| 1998-99 | 1999-2000 | 2000-01 | 2001-02 | 2002-03 | |
| hrs | hrs | hrs | hrs | hrs | |
| |
| Construction | 35.5 | 36.2 | 36.7 | 36.0 | 37.2 | |
| General construction | 38.6 | 36.9 | 37.5 | 38.1 | 38.1 | |
| Construction trade services | 33.6 | 35.7 | 36.3 | 34.7 | 36.8 | |
| |
| Source: Labour Force Survey, Australia (cat. no. 6291.0.55.001) |
For further information on this article, contact Rachel Smith on (08) 8237 7324.
 Print Page
 Print All