STATES AND TERRITORIES
The figures in the commentary below relate to 2013-14 for all states and territories, and to the industry designated as 'Selected mining', that is, ANZSIC subdivisions 06-09 (Coal mining, Oil and gas extraction, Metal ore mining and Non-metallic mineral mining and quarrying) only. ANZSIC subdivision 10 (Exploration and other mining support services) is excluded. Data for the Australian Capital Territory are included with those for New South Wales and are not available separately. See Explanatory Notes paragraph 38 for an outline of the methodology used to derive these estimates.
SALES AND SERVICE INCOME
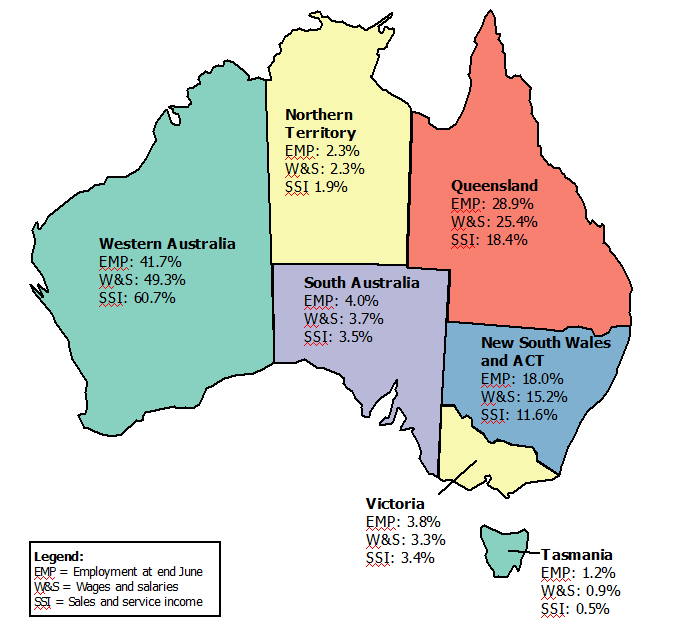
In 2013-14 sales and service income for the Selected mining industry increased by 7.0% ($13.1b) to $200.7b. Western Australia accounted for 60.7% (or $121.9b) of sales and service income in 2013-14, followed by Queensland with 18.4% ($36.9b) and New South Wales with 11.6% ($23.3b).
EMPLOYMENT
During 2013-14, 41.7% of employment (59,830 people) in the Selected mining industry was recorded against Western Australia, followed by Queensland with 28.9% (41,380 people). New South Wales contributed 18.0% (25,756 people).
WAGES AND SALARIES
In 2013-14, Western Australia accounted for 49.3% ($10.7b) of wages and salaries for the Selected mining industry, followed by Queensland at 25.4% ($5.5b) and New South Wales at 15.2% ($3.3b).
STATE AND TERRITORY CONTRIBUTION TO SELECTED MINING INDUSTRIES (a), 2013-14
 Quality Declaration
  Print Page
 Print All