STATES AND TERRITORIES
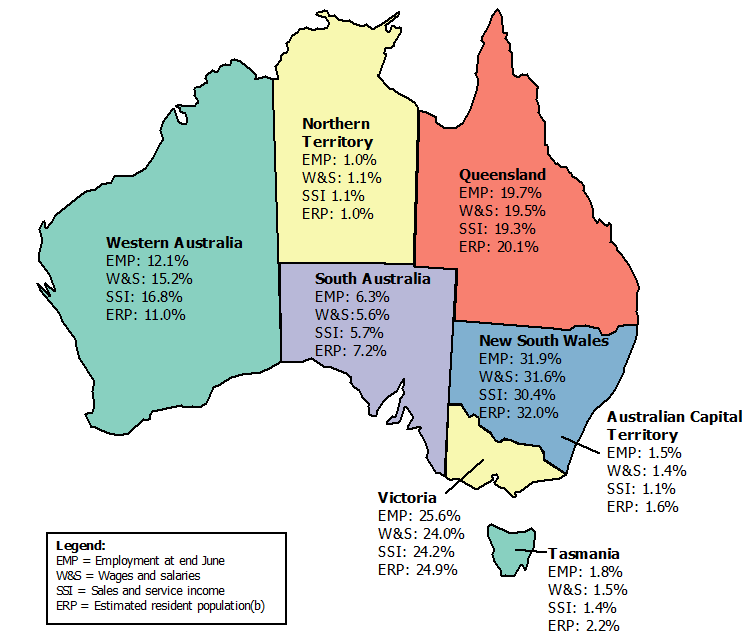
While the key economic indicators for most states and territories were commensurate with the population distribution, the exception was Western Australia, where sales and service income accounted for 16.8% (or $486b) of the national total relative to a population share of 11.0%.
SALES AND SERVICE INCOME
In 2013-14 New South Wales continued to have the largest sales and service income at 30.4% ($879b) of Total selected industries, followed by Victoria at 24.2% ($699b) and Queensland (19.3% or $556b).
EMPLOYMENT
At June 2014 New South Wales had the highest employment at 31.9% (about 3,421,000 people), followed by Victoria with 25.6% (about 2,748,000 people) and Queensland (19.7% or about 2,117,000 people). This aligned with their shares of Estimated Resident Population in June 2014, which were 32%, 24.9% and 20.1% respectively.
WAGES AND SALARIES
New South Wales accounted for the largest share of wages and salaries in 2013-14 at 31.6% ($160b), followed by Victoria with 24.0% ($122b) and Queensland (19.5% or $99b). However, Western Australia had the highest average wages and salaries per employed person at $59,522, followed by Northern Territory ($51,364) and New South Wales ($46,899) and Queensland ($46,885) (see Endnote).
STATE AND TERRITORY CONTRIBUTION TO TOTAL SELECTED INDUSTRIES(a), 2013-14
Note that average wages and salaries have been calculated using wages and salaries for the full financial year 2013-14, whereas employment is a point in time estimate at June 2014, so they should be used with caution.
 Quality Declaration
  Print Page
 Print All