6359.0 - Forms of Employment, Australia, November 2011  Quality Declaration
ARCHIVED ISSUE Released at 11:30 AM (CANBERRA TIME) 20/04/2012
Page tools:
 Print Page Print Page
 Print All Print All
| ||
|
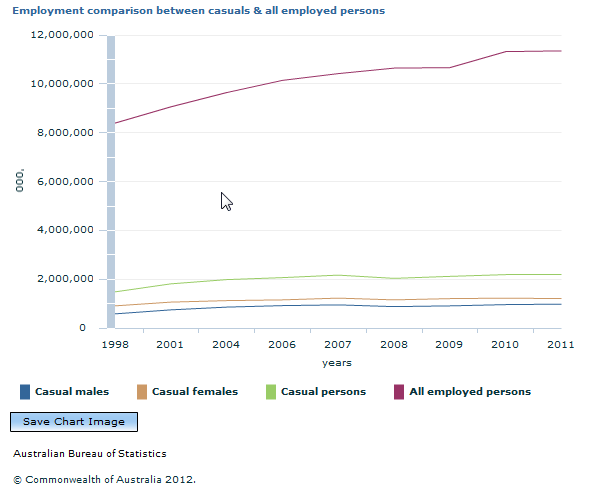
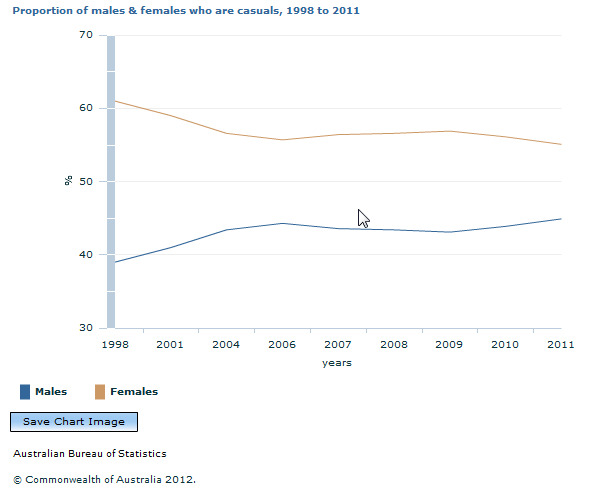
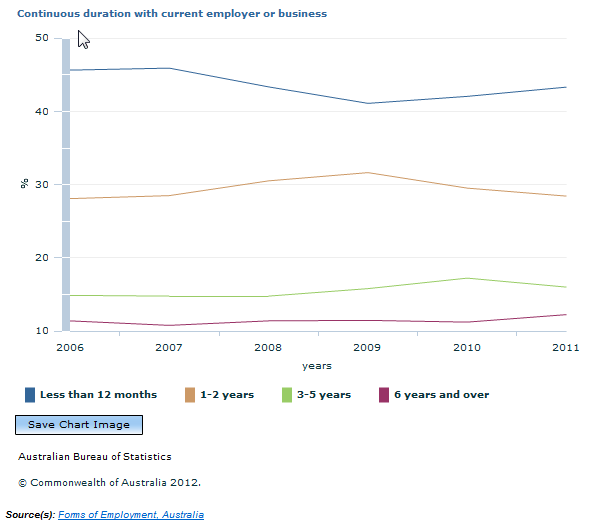
CASUAL EMPLOYMENT AND CONDITIONS ARE STABLE OVERVIEW This article discusses the extent of casual employment and the conditions under which casual employees work. While the number of casuals (those without either paid sick and paid holiday leave) is generally increasing over time, it is not at an equivalent rate to the entire workforce, resulting recently in a small fall in the proportion of the labour force employed on a casual basis. In addition, the rights and entitlements of these casuals today are similar to previous years.  Source(s): Forms of Employment, Australia The number of employed persons has continued to increase in the workforce in comparison with those deemed to be casuals (employees without paid leave entitlements). Generally, the number of casuals in the workforce is increasing, however it is increasing at a rate lower than that of all employed persons. In 1998, there were 8.3 million employed persons of whom the number of casuals was 1.5 million (18% of all employed persons). The proportion of casuals reached a peak of 21% of all employed persons (2.2 million casuals and 10.4 million employed persons) in 2007, and now sits at 19% of all employed persons (2.2 million casuals and 11.4 million employed persons) in 2011.  Source(s): Forms of Employment, Australia The proportion of casual females decreased from 61% in 1998 to 55% in 2011, while the proportion of casual males increased from 39% in 1998 to 45% in 2011. Since 2006 the proportions have remained steady.  Source(s): Forms of Employment, Australia The proportion of casual employees working for 1-2 years with their employer has generally remained at the same level, 28% in 2006 and 28% in 2011, likewise for those employed for 3-5 years, 15% in 2006 and 16% in 2011. The proportion of casual employees working for their employer for less than 12 months has had more variability. This was 46% in 2006 and then generally declined to 41% in 2009 before reaching 43% in 2011. The following points illustrate that there have been only slight changes in entitlements for casual workers since 2006.
Data from the Working Time Arrangements, Australia, November 2009 (cat. no. 6342.0) indicate that for casual employees:
More information on Forms of Employment can be found in the Summary of Findings and the following tables. Document Selection These documents will be presented in a new window.
|
|
