6224.0.55.001 - Labour Force, Australia: Labour Force Status and Other Characteristics of Families, June 2017  Quality Declaration
Quality Declaration ARCHIVED ISSUE Released at 11:30 AM (CANBERRA TIME) 04/12/2017
Page tools:
 Print Page Print Page
 Print All Print All
| |||
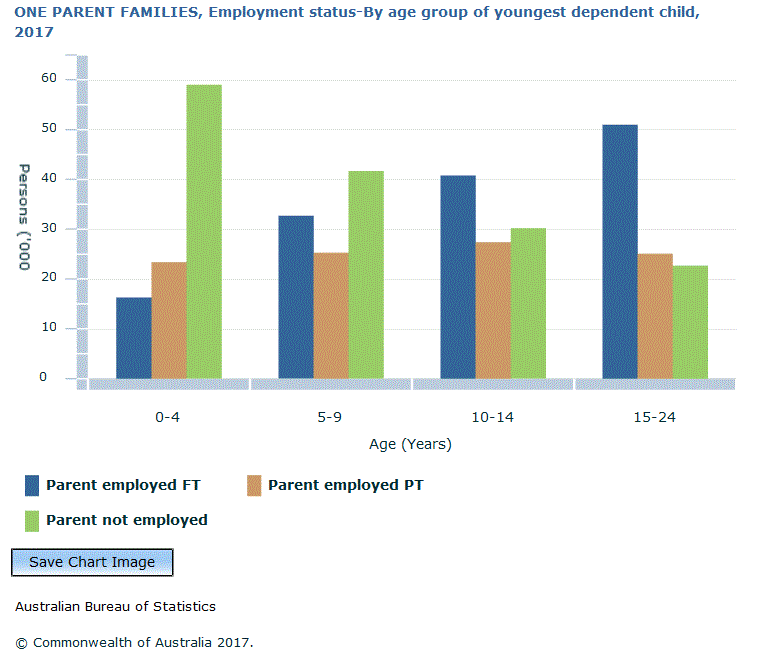
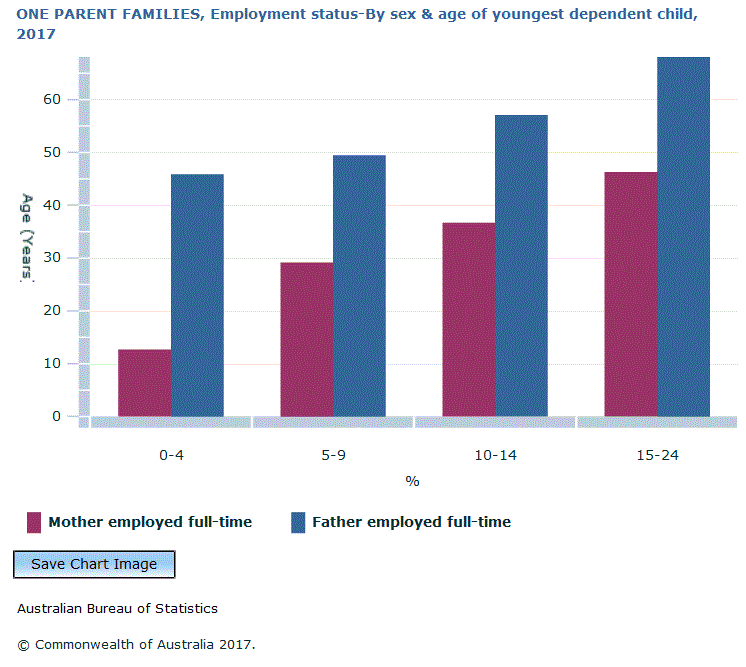
ONE PARENT FAMILIES
Document Selection These documents will be presented in a new window.
|
|||