6202.0 - Labour Force, Australia, Oct 2011  Quality Declaration
ARCHIVED ISSUE Released at 11:30 AM (CANBERRA TIME) 10/11/2011
Page tools:
 Print Page Print Page
 Print All Print All
| ||
|
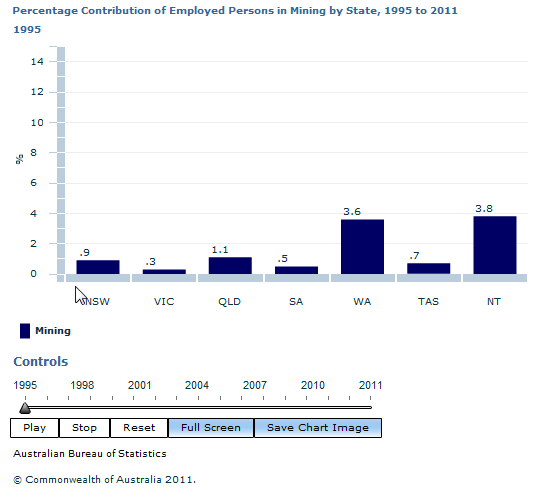
PERCENTAGE CONTRIBUTION OF EMPLOYED PERSONS IN SELECTED INDUSTRIES ORIGINAL ESTIMATES INTRODUCTION The graphs below show the percentage contribution of employed persons in selected Australian and New Zealand Standard Industrial Classification, 2006 (ANZSIC) industries to total employment. To avoid the impacts of seasonal variability, annual estimates have been created by combining the industry data across the four quarterly measurements. Since November industry data for 2011 are not available yet, each annual estimate is based on the data collected from the previous November to the current February, May and August months. MINING Original series estimates of employed persons in the Mining industry as a percentage of total employment showed two year-on-year increases in Western Australia. From an estimate of 5.1% in 2009, 7.1% of all employed Western Australians are now working in the Mining industry in 2011. Queensland also had a year-on-year increase in 2011, up to 2.6%.
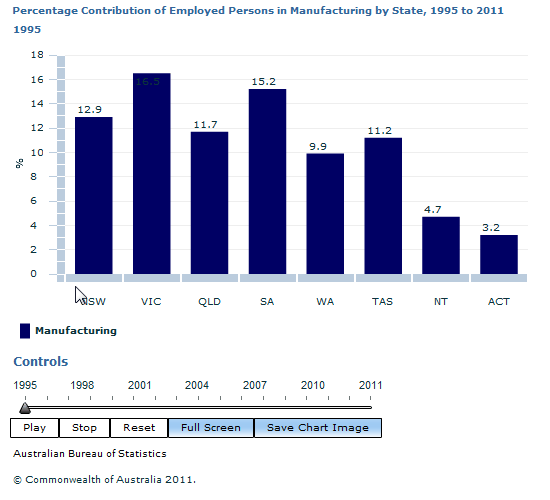
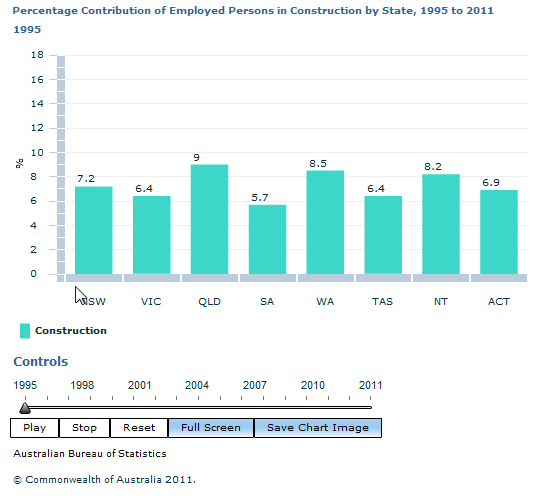
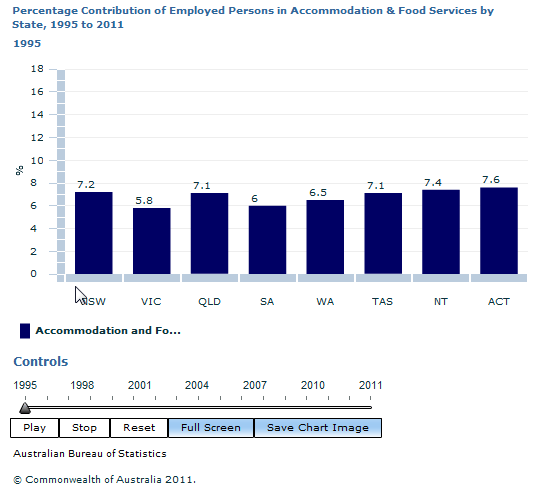
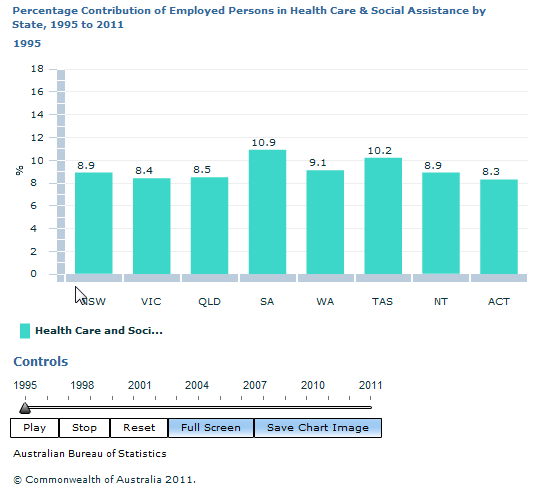
MANUFACTURING Original series estimates of employed persons in the Manufacturing industry as a percentage of total employment decreased year-on-year from 2009 to 2010 in Western Australia, but the decline eased in 2011. Employment in Manufacturing in the Northern Territory also decreased year-on-year to 3.2% in 2011. An estimated 10.7% of employed persons in Victoria are employed in the Manufacturing industry in 2011. CONSTRUCTION Original series estimates of employed persons in the Construction industry as a percentage of total employment showed two year-on-year increases from 2009 to 2011 in Victoria. Western Australia and Australian Capital Territory also had year-on-year increases in 2011, with the ACT rising 1.3 pts to 7.6%. An estimated 11.0% of employed persons in Western Australia are employed in the Construction industry in 2011. RETAIL TRADE Original series estimates of employed persons in the Retail Trade industry as a percentage of total employment increased year-on-year from 2010 to 2011 in New South Wales with the percentage of people employed now at 10.7% in 2011. The Australian Capital Territory has shown a year-on-year decline in 2011, falling to 7.1%. Employment in Retail Trade in Western Australia also noticeably declined between 2009 and 2010, although the year-on-year movements have eased in 2011. ACCOMMODATION AND FOOD SERVICES Original series estimates of employed persons in the Accommodation and Food Services industry as a percentage of all industries showed two year-on-year increases from 2009 to 2011 in South Australia and Northern Territory, both rising to an estimate of 7.5%. Both states now have a proportion of employed people working in the Accommodation and Food Services industry similar to Queensland and Tasmania. Both Queensland and Tasmania also had year-on-year increases in 2011. HEALTH CARE AND SOCIAL ASSISTANCE Original series estimates of employed persons in the Health Care and Social Assistance industry as a percentage of all industries showed two year-on-year increases from 2009 to 2011 in New South Wales and Victoria, rising to 11.5% and 11.7% respectively. The percentage of employment in Tasmania in the Health Care and Social Assistance industry increased in 2011, rising to 13.1%. Queensland and Western Australia have also shown strong year-on-year rises in 2011. FURTHER INFORMATION For further information, refer to the ABS publications Labour Force, Australia, Detailed Quarterly (cat. no. 6291.0.55.003) and Australian and New Zealand Standard Industrial Classification (ANZSIC), 2006 (Revision 1.0) (cat. no. 1292.0). Document Selection These documents will be presented in a new window.
|
|

